XMM-Newton broad-band observations of NGC 7582:
NH
variations and fading out of the active nucleus
We present results from two XMM–Newton observations of the bright classical Seyfert 2 galaxy NGC 7582 taken four years apart (2001 May and 2005 April). We present the analysis of the high-resolution (0.3-1 keV) RGS and low-resolution (0.3-10 keV) EPIC spectroscopic data. A comparison with a 1998 BeppoSAX observation suggests that XMM–Newton caught the source in a “reflection-dominated” phase, measuring the lowest continuum flux level ever ( = 2.3 10-12 erg cm-2 s-1) in 2005. NGC 7582 therefore experienced a dramatic spectral transition most likely due to the partial switching-off of the nuclear activity. The XMM–Newton spectrum of the continuum emission is very complex. It can be well described by a model consisting of a combination of a heavily absorbed (NH 1024 cm-2) power law and a pure reflection component both obscured by a column density of 4 1022 cm-2. Notably, we detect a significant increase by a factor of 2 in the column density of the inner, thicker absorber covering the primary X-ray source between 2001 and 2005. The 2005 XMM–Newton spectra show the strongest Fe K emission line ever measured in this source. This is consistent with the line delayed time response to the decrease of the nuclear activity. Our analysis also reveals that the soft X-ray spectrum is dominated by emission lines from highly ionized metals. The detection of a narrow OVIII radiative recombination continuum suggests an origin in a photoionized plasma.
Key Words.:
Galaxies: individual: NGC 7582 – Galaxies: active – Galaxies: nuclei – X-ray: galaxies1 Introduction
In Type 2 Seyfert galaxies the otherwise overwhelming primary continuum
emission from the active nucleus is attenuated by the presence of an
obscuring screen (the putative dusty torus of the unified model,
e.g. Antonucci 1993). This favorable condition enables us to investigate in
detail the geometrical and physical properties of the emitting/absorbing gas
in the nuclear environment. X-ray
observations of obscured sources permit to efficiently map the inner
kpc-scale region around the accreting black hole (BH) and understand the
physical processes at work in AGN. Recent XMM–Newton and Chandra results have
provided unprecedented insights into the structure and dynamics of the
reprocessing materials (see e.g. Risaliti et al. 2005; Iwasawa et al. 2003;
Guainazzi & Bianchi 2007 and references therein) and the starburst
contribution to the total X-ray emission (e.g. Jimenez-Bailón et al. 2003).
In this paper we present the analysis of two XMM–Newton observations of NGC 7582. This source is a highly inclined ( 65∘) barred spiral galaxy at = 0.0053 (1 arcsec 110 pc in the source rest-frame). Optical observations reveal a complex morphology, with a kpc-scale disk of H II regions and a prominent dust lane, parallel to the major axis of the galaxy, running across the nuclear region at a distance of some hundreds parsecs (Regan & Mulchaey 1999; Prieto et al. 2002; Wold & Galliano 2006). The optical spectrum is a superposition of a Seyfert 2 nucleus and a starburst (Cid Fernandes et al. 1998, Sosa-Brito et al. 2001). NGC 7582 also shows a sharp-edged [O III] outflow cone (Storchi-Bergmann & Bonatto 1991) having its vertex centered in the (supposedly) hidden nucleus of the host galaxy. All these pieces of evidence suggest that NGC 7582 has a hidden active nucleus lying in a dusty environment and surrounded by circumnuclear starburst.
X-ray observations of NGC 7582 have given further support to this scenario. Thank to its brightness (Piccinotti et al. 1982) this AGN has been targeted by most of the X-ray telescopes: Einstein (Maccacaro & Perola 1981), EXOSAT (Turner & Pounds 1989), Ginga (Warwick et al. 1993), ASCA (Schachter et al. 1998, Xue et al. 1998), BeppoSAX (Turner et al. 2000, T00 hereafter), and Chandra (Bianchi et al. 2007, B07 hereafter). All these studies reported a flat X-ray spectrum dominated by heavy obscuration. The first detailed description of the complex absorber in NGC 7582 was given in T00. Exploiting the unique BeppoSAX broad bandpass, these authors reported the detection of two absorbing systems: one fully-covering Compton-thin (NH 1.4 1023 cm-2) screen plus a Compton-thick (NH 1.6 1024 cm-2) absorber covering 60% of the X-ray source. Previous X-ray observations of NGC 7582 also revealed rapid short-term (with a factor of 2 variations on time scale as short as 5.5 hours) as well as complex long-term variability of the hard X-ray flux (e.g. Risaliti et al. 2002).
XMM–Newton observed this source in 2001 for 23 ks and, again, in 2005 for 100 ks. A partial analysis of the first observation, limited to the hard portion (i.e. 2 keV) of the low-resolution EPIC spectrum, can be found in Dewangan & Griffiths (2005).
The analysis of the second XMM–Newton observation, presented in this paper for the first time, has provided the highest quality X-ray spectrum of NGC 7582 ever obtained. We also re-analyzed the 2001 dataset extending the Dewangan & Griffiths (2005) spectroscopic analysis to the soft X-rays range. For both observations we performed the analysis of the high-resolution (0.3-1 keV) RGS and low-resolution (0.3-10 keV) EPIC spectroscopic data.
2 XMM–Newton observations
NGC 7582 was observed by XMM–Newton on 2001 May 25 and 2005 April 29 for about 23 and 100 ks, respectively. Both observations were performed with the EPIC PN (Struder et al. 2001) and MOS (Turner et al. 2001) cameras operating in full-frame mode.
Data were reduced with SAS 6.5 (Gabriel et al. 2003) using standard procedures. X–ray events corresponding to patterns 0–12(0–4) for the MOS(PN) cameras were selected. The event lists were filtered to ignore periods of high background flaring according to the method presented in Piconcelli et al. (2004) based on the cumulative distribution function of background light curve count-rates. Useful exposure times of 71.2(18.1) ks for the PN and of 81(22.4) ks for the two MOS cameras were obtained for the 2005(2001) observation.
The source photons were extracted from a circular region with a radius of 40 arcsec (32 arcsec in the case of the 2001 observation), while the background counts were estimated from a source-free similar region on the same chip. Appropriate response and ancillary files for all the EPIC cameras were created using RMFGEN and ARFGEN tasks in the SAS, respectively. As the difference between the MOS1 and the MOS2 response matrices is a few percent, we created a combined MOS spectrum and response matrix. The background-subtracted spectra for the PN and the combined MOS cameras were then simultaneously fitted. Events outside the 0.3–10 keV range were discarded in the PN spectrum while we restricted the analysis of the MOS data to the 0.5–10 keV range111In the case of the lower statistics data from the 2001 observation, we ignored the MOS data below 1 keV due to the presence of cross-calibration uncertainties between the MOS cameras in the 0.3-1 keV band which could prevent an unbiased determination of the PNMOS best-fit spectral model (Stuhlinger et al. 2006).
The RGS (den Herder et al. 2001) was operating in standard spectroscopic mode during the XMM–Newton observations. We have therefore reduced also the RGS data using the standard SAS meta-task rgsproc, and the most updated calibration files available at the moment the reduction was performed (October 2006). The wavelength systematic uncertainty is 8 mÅ across the whole RGS sensitive bandpass. We refer the reader to Guainazzi & Bianchi (2007) for further details on the data reduction of the RGS dataset.
3 Temporal analysis of the 2005 observation
X–ray light curves were extracted from the 2005 PN dataset in the soft (0.2–2 keV) and hard (2–15 keV) bands. The time bin size was set to be 5000 s for all light curves. Background light curves were extracted from source-free regions in the same CCD and with the same bin size.
The soft X-ray Count Rate (CR) did not vary during the exposure apart a small-amplitude ( 20% of the average CR) rapid drop in the bin around 85 ks. The hard band light curve did not present any evidence of large-amplitude variability.
The analysis of the hard X-ray variability of the 2001 data has been recently presented by Awaki et al. (2006). They reported a smooth and nearly linear decrease ( 30%) of the hard X-ray CR from the start up to the end of the observation, which is confirmed by our analysis. In addition, we have also extracted the soft X-ray band light curve for this observation. The 0.2-2 keV CR remained almost steady during the exposure with only a decrease of approximately 2 from the average CR level in the final interval.
4 Spectral analysis
All spectra were analyzed with the XSPEC v11.2 package (Arnaud 1996). All models discussed in this paper include absorption due to the line-of-sight Galactic column of NH = 1.47 1020 cm-2 (Stark et al. 1992). The cosmology assumed has = 70 km s-1 Mpc-1, = 0.3, and = 0.7 (Bennett et al. 2003). The quoted errors on the model parameters correspond to a 90% confidence level for one interesting parameter ( = 2.71; Avni 1976).
4.1 The Hard X-ray Continuum
Given the spectral complexity of NGC 7582, we began our analysis by fitting the EPIC data in the 3–10 keV range.
| NHa | NHb | EW(Fe K)d | e | |||
|---|---|---|---|---|---|---|
| 1022 cm-2 | 1022 cm-2 | % | eV | 10-12 erg cm-2 s-1 | ||
| XMM-Newton 2005 | 2.35 | 9.4 | 93.5 | 90 | 715 | 1.1 |
| XMM-Newton 2001 | 2.28 | 10.2 | 66.9 | 90 | 330 | 1.7 |
| BeppoSAX 1998 | 2.06 | 16.9 | 265.1 | 50 | 83 | 11.7 |
a “fully-covering” absorber. b “partially-covering” absorber. c best-fit covering factor. d Measured for an absorption-corrected line against absorption-corrected continuum. e An absorbed power-law model with = 1.7 and NH = 1.5 1022 cm-2 was assumed.
We initially assumed the “dual absorber” model used by T00 for the 3–100 keV BeppoSAX data consisting of a power law modified by two neutral absorbers, one of which (the thicker) only partially covers the primary X–ray source. We also included two narrow Gaussian lines in order to account for the iron K and K emission features, which were both clearly visible in the spectrum. The energy of the K line was fixed to 7.06 keV. In the case of the 2005 spectrum we also added in the model two narrow Gaussian lines at 6.67 and 7.55 keV to reproduce the FeXXV K and NiXXI K emission. Each line represents an improvement in the resulting fit statistics significant at 99.9% confidence level.
This parameterization (dual3-10 hereafter) provided a very good fit to both XMM–Newton datasets with a final (dof)=0.96(204) and (dof)=0.94(172) for the 2005 and 2001 observations, respectively (Table 1). The continuum slope and the column density of the fully-covering absorber did not differ between the two epochs. On the contrary, the 2005 spectrum shows a much stronger Fe K line with an EW 700 eV. We also found a significant change in the best-fit value of the column density of the partially–covering absorbing screen with an increase of (N) 25 1022 cm-2, while the covering factor remained unchanged ( = 90%)
We then adopted a model consisting of an absorbed power law plus an unabsorbed pure Compton reflection component from neutral matter (PEXRAV model in XSPEC, e.g. Magdziarz & Zdziarski 1995, with the metal abundances fixed to the solar value, the inclination angle fixed to 65 deg) reflecting a power-law with the same photon index of the absorbed primary continuum. Such a model has been found to successfully reproduce the X–ray spectrum of most heavily–obscured Seyfert 2 galaxies observed by XMM–Newton so far (e.g. Schurch, Roberts & Warwick 2002; Matt et al. 2004; Bianchi et al. 2005a). Narrow Gaussian lines were included as in the dual3-10 model. This model (indicated as refl3-10 hereafter) gave an equally good description of the hard X–ray spectrum of NGC 7582 with an associated (dof) = 0.93(205) ((dof) = 0.96(173) for the 2001 data). For the 2005 spectrum we measured a = 2.40 and a column density of NH = (140) 1022 cm-2. The energy centroid(EW) of the Fe K line was 6.4040.006 (802 eV, calculated with respect to the pure reflection component). This energy corresponds to low ionization states, i.e. FeI–XIII (Kallman et al. 2004).
The application of the refl3-10 model to the 2001
hard X-ray spectrum yielded results consistent with
those reported by Dewangan & Griffiths (2005), i.e. =
2.08 and NH = (75) 1022
cm-2. This fit gave, therefore, a further confirmation for an
increase in the level of absorption between 2001 and 2005. On the
contrary, the values of the normalization of the reflection
component and the intensity of the Fe K line are
consistent with being the same
in the two XMM–Newton observations within errors. This fact is not
surprising since both these spectral features are believed to be the
result of reprocessing of the primary (obscured) X-ray
emission in a distant material ( 1 pc from the X-ray source).
Models dual3-10 and refl3-10 are statistically indistinguishable. However, they correspond to very different physical scenarios for the hard X-ray emission in NGC 7582, requiring either the presence of two different absorbers (“transmission scenario”) or reflection/reprocessing from optically thick matter (“reflection-dominated scenario”), respectively. We extensively discuss both scenarios and their implications in the Sect. 5 and in Sect. 6.1.
| Line Id. (Å) | RGS data | EPIC data | ||
|---|---|---|---|---|
| Intensity | Intensity | |||
| (Å) | (10-5 ph/cm2/s) | (Å) | (10-5 ph/cm2/s) | |
| CVI Ly-(33.74) | 33.78(33.73,33.83) | 1.07(0.22,1.86) | ||
| NVII Ly-(24.78) | 24.80(24.70,24.84) | 0.68(0.28,1.11) | ||
| OVII He-()(22.10) | 22.10⋆ | 1.37(0.87,1.88) | 22.10† | 1.33(1.15,1.58) |
| OVII He-()(21.80) | 21.80⋆ | 0.87(0.40,1.39) | ||
| OVII He-()(21.60) | 21.60(21.59,21.61) | 0.97(0.48,1.50) | ||
| OVIII Ly-(18.97) | 18.98(18.97,18.99) | 1.47(1.13,1.85) | 18.97† | 0.97(0.84,1.14) |
| OVII He-(18.63) | 18.66(18.62,18.69) | 0.22(0.06,0.55) | ||
| FeXVII 3s2p(17.08) | 17.10(17.08,17.11) | 0.69(0.48,1.07) | ||
| FeXVIII 3s2p(16.09) | 16.03(15.99,16.08) | 0.45(0.21,0.67) | 16.09† | 0.78(0.67,0.92) |
| OVIII Ly-(16.00) | 16.02(15.98,16.10) | 0.29(0.11,0.53) | ||
| FeXVII 3d2p3D1(15.26) | 15.26† | 0.96(0.73,1.32) | ||
| FeXVII 3d2p1P1(15.01) | 15.01(15.00,15.03) | 1.07(0.80,1.43) | 14.79(14.77,14.88) | 1.97(1.78,2.04) |
| FeXVIII 3d2p(14.41) | 14.51(14.48,14.55) | 0.32(0.09,0.60) | ||
| NeIX He-(r)(13.45) | 13.48(13.46,13.52) | 0.86(0.36,1.37) | 13.45† | 1.62(1.55,1.79) |
| OVIII RRC(14.22) | 14.22† | 0.30(0.11,0.71) | ||
| FeXXI 3d2p(12.28) | 12.15(12.11,12.19) | 0.54(0.13,0.97) | 12.21(12.16,12.26) | 1.30(1.15,1.35) |
| FeXXIV 3d2p(11.18) | 11.18† | 0.41(0.34,0.47) | ||
| NeX Ly-(10.24) | 10.35(10.26,10.45) | 0.29(0.21,0.33) | ||
| MgXI He-(9.23) | 9.21(8.99,9.24) | 0.46(0.38,0.49) | ||
| MgXII Ly-(8.42) | 8.53(8.43,8.59) | 0.14(0.11,0.22) | ||
| MgXII Ly-(7.10) | 7.10† | 0.09(0.06,0.13) | ||
| SiXIV Ly-(6.18) | 6.18(6.15,6.23) | 0.19(0.12,0.22) | ||
| SiXIII He-(6.69) | 6.68(6.66,6.71) | 0.48(0.43,0.56) | ||
| SXV He-(5.04) | 5.07(5.05,5.09) | 0.32(0.26,0.36) | ||
| SXVI Ly-(4.72) | 4.68(4.60,4.76) | 0.05(0.02,0.11) | ||
| FeXXV K(1.86) | 1.86† | 0.23(0.15,0.31) | ||
| Fe K(1.76) | 1.76† | 0.32(0.24,0.40) | ||
| NiXXI K(1.64) | 1.65(1.63,1.66) | 0.17(0.10,0.25) | ||
The values in parentheses in columns 2 to 5 indicate the minimum and the maximum limits of the 90% confidence interval for each parameter. ⋆ The wavelength of the forbidden and the intercombination lines were fixed to be at + and 0.2 Å from the resonance line best-fit wavelength; † fixed value.

4.2 The 0.3–10 keV spectrum
The extrapolation of the hard X-ray models (see Sect. 4.1) to energies lower than 3 keV shows the presence of a smooth continuum excess along with several narrow excess features. This excess has been observed in most of X-ray obscured Seyfert galaxies (Turner et al. 1997) and, thanks to Chandra and XMM–Newton high-resolution spectroscopy, it has been interpreted as a combination of reflected emission of the hidden nuclear continuum by a warm gas (and/or a tiny leaked fraction of the nuclear emission) with unresolved blends of emission lines, which originate from the same gas (e.g. Sako et al. 2000; Sambruna et al. 2001; Matt et al. 2004; Pounds & Vaughan 2006; Bianchi et al. 2005a; B07).
The analysis of the RGS spectrum lends support to this interpretation, revealing for the first time that the soft X-ray emission of NGC 7582 is clearly dominated by emission lines, as shown in Fig. 1. This figure is generated by combining the 1st and 2nd order spectra of the two RGS cameras, and smoothing the combined spectra through a convolution with a 5-spectral channel wide triangular function. Errors are not shown in the fluxed spectrum of Fig. 1, which is presented for illustration purposes only since the applied smoothing procedure can amplify any spurious features due to instrumental issues as, for instance, in the case of the two strong unidentified emission lines visible at 26.5 and 28.3 Å that correspond to chip gaps in RGS2 CCD array (and are not associated with any relevant atomic transition). Table 2 reports the parameters of the lines detected by a combined forward-folding fit of the spectra of the two RGS cameras, employing the spectral fitting procedure outlined in Guainazzi & Bianchi (2007). Their origin and the implications concerning the physical properties of the emitting gas are discussed in detail in Sect. 6.2.
| Obs. | NH | (Fe K) | EW(Fe K) | Flux | Lum. | (dof) | |||
|---|---|---|---|---|---|---|---|---|---|
| (1) | (2) | (3) | (4) | (5) | (6) | (7) | (8) | (9) | (10) |
| 2005 | 1.93 | 4.8 | 35 | 1.06 | 23 | 772 | 3.8d | 41.68d | 381(361) |
| 129.3 | 23.5e | 41.86e | |||||||
| 2001 | 1.90 | 3.9 | 35 | 1.06 | 22 | 620 | 3.7d | 41.68d | 295(272) |
| 54.9 | 40.2e | 41.89e |
The columns give the following information: (1) the observation date; (2) the power-law photon index; (3) the absorber column density of the absorber (1022 cm-2); (4) the normalization of the absorbed power law (10-4 photons/keV/cm2/s); (5) the normalization of the scattered power law (10-4 photons/keV/cm2/s); (6) the intensity of the Fe K line (10-6 photons/cm2/s); (7) the Fe K equivalent width (eV); (8) the flux (10-13 erg cm-2 s-1); (9) the logarithmic value of luminosity (erg/s); (10) the reduced and the number of degrees of freedom. a Absorber covering the reflected component and the primary continuum. b Absorber covering only the primary continuum. c Measured with respect to the pure reflection component. d Value for the 0.5-2 keV band. e Value for the 2-10 keV band.
For the above reasons, we added a power-law component to the refl3-10 model to account for the continuum “soft excess” emission. The photon index was constrained to be that of the primary (absorbed) continuum but the normalization was left free to vary. For the reasons explained in the Sect. 6, model refl3-10 turns out to be physically preferable to model dual3-10 and we therefore used the former as baseline model for the broad band EPIC spectrum of NGC 7582. Apart from the strongest emission lines detected in the RGS spectrum in the range 0.3–1 keV, we also included in the fitting model eight narrow Gaussian lines, required at a significance level of 99%, to account for the strongest emission features observed in the 1–3 keV band, where the RGS detectors are less sensitive. Table 2 lists the best-fit parameters together with the likely identification for each of these lines as measured in the longest observation. Finally, no absorption line is required by the data.
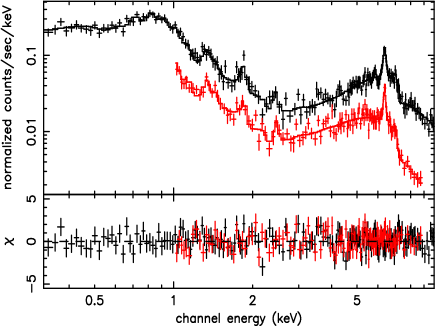

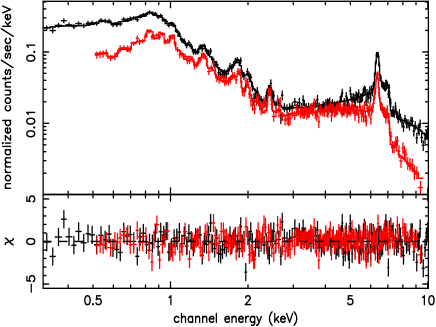

This extension of the model refl3-10 to the broad band produced a 1.2 for both XMM–Newton datasets222Given the high complexity of the broad band spectrum and the poorer statistics of the 20 ks spectrum taken in 2001, we constrained the value of the normalization of the reflection component to vary within the 99% confidence level interval derived for the same parameter from the 2005 data. The 2001 and 2005 unconstrained values for this parameter were consistent within errors., indicating that such a parametrization of the continuum spectral shape was not satisfactory. However, a very significant (99.9% confidence level) improvement was obtained by including in this fit an additional absorber obscuring both the primary emission and the Compton reflection. We derived column densities of NH = (3.9) 1022 cm-2 (2001 value), and NH = (4.8) 1022 cm-2 (2005 value). On the contrary, as already pointed out in Sect. 4.1, the column density of the inner, thicker absorber covering only the primary continuum increased by a factor of about 2.4 (NH 7 1023 cm-2) between 2001 and 2005. The best-fit parameters yielded by the application of this model (refl hereafter) are listed in Table 3. Spectral residuals and unfolded spectral models are shown in Figs. 2 and 3.
5 XMM–Newton versus BeppoSAX results: evidence of a spectral transition
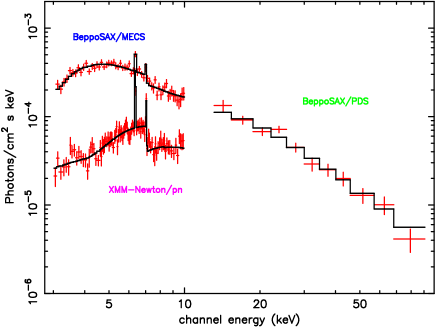
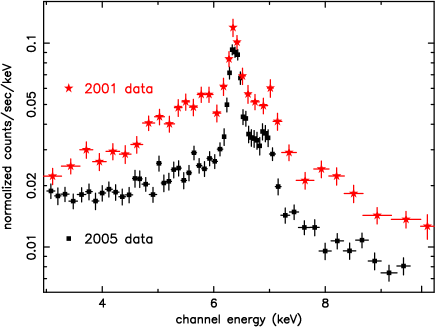
In Fig. 4a the 2001 3–10 keV PN spectrum and the 3–90 keV MECSPDS spectra are plotted together and fitted by the best-fit model used by T00 for the continuum emission above 3 keV (which is similar to our dual3-10 model). It is worth noting the decrease of the X-ray flux between the two epochs: XMM–Newton caught, in fact, the source in a extremely faint state with a 3–10(8–10) keV flux lower than a factor of 7(4) if compared with the BeppoSAX observation. NGC 7582 was even fainter during the second XMM–Newton observation performed four years later as shown in Fig. 4b. Among the previous studies of NGC 7582, the XMM–Newton continuum flux levels (e.g. = 4 10-12 erg cm-2 s-1 and = 2.3 10-12 erg cm-2 s-1) are the lowest ever measured: EXOSAT ( 1.7 10-11 erg cm-2 s-1, Turner & Pounds 1989), ASCA ( 1.5 10-11 erg cm-2 s-1, Xue et al. 1998) and Ginga ( 6 10-12 erg cm-2 s-1, Warwick et al. 1993) all observed the source in a brighter state.
Spectral variations are also evident between the BeppoSAX and XMM–Newton observations (see Table 1 and Fig. 4). The XMM–Newton spectrum of NGC 7582 shows the typical features (i.e. a strong iron line emerging from a hard and curved continuum) of a source in a “reflection-dominated” phase. The detection of a prominent Fe K line (EW700 eV; see Table 1) coupled with the excellent fit to the data provided by the model refl3-10 (e.g. Sect. 4.1) suggest that the X-ray emission detected by XMM–Newton can be considered as the echo of primary – i.e. nuclear – continuum during a prior phase of more intense nuclear activity. This change of appearance from a transmission- to reflection-dominated spectral state (or vice versa, e.g. Guainazzi et al. 2002) was reported by Matt, Guainazzi & Maiolino (2003) and Bianchi et al. (2005b) in a handful of Seyfert 2 galaxies. They argued that this temporal behavior can be due to switching-off (or following re-emergence) of the nuclear activity.
6 Discussion
6.1 A possible geometry for the nuclear region in NGC 7582
In this section we focus on the properties of the very complex X-ray spectrum above 3 keV with the aim of providing a physically acceptable scenario for the nuclear emission of NGC 7582.
Both the refl3-10 and the dual3-10 model describe the data equally well (see Sect. 4.1). However, the comparison between the BeppoSAX and XMM-Newton X-ray spectra leads us to favor the former on the basis of physical considerations. In a pure transmission-dominated scenario with the 2005(2001) X-ray continuum attenuated by a column of NH 9(7) 1023 cm-2 there is no explanation for the presence of a strong Fe K line with an EW of 700 (330) eV (e.g. Matt 2002). It is also worth noting that during the XMM–Newton exposures of NGC 7582 no rapid and large-scale variations in the hard band light curve occurred, at odds with previous ASCA and BeppoSAX observations which caught the source in a clear transmission-dominated phase. This suggests that the primary X-ray source has experienced a large-amplitude decline prior to the 2001 XMM–Newton observation unmasking the reflection component underlying the primary emission. Hereafter we therefore refer to the reflection-dominated spectral state model (i.e. refl) as the most physically acceptable description of the XMM–Newton broad band spectra of NGC 7582.
A similar apparent switching-off of the nucleus was observed in other Seyfert 2 galaxies (e.g. Guainazzi et al. 2005, G05 hereafter) and even in Type 1 AGN (Guainazzi et al. 1998). The physical reason of this phenomenon is likely associated with variations in the accretion flow onto the BH (Uttley et al. 1999) or, at least in some cases, with dramatic changes in the properties (i.e. column density, covering factor) of the line-of-sight absorber (e.g. Risaliti et al. 2005; Elvis et al. 2004; Matt Guainazzi & Maiolino 2003). It is worthwhile to notice that in NGC 7582 the AGN continuum has not completely disappeared as a significant component of transmitted (absorbed) nuclear emission is detected (e.g. Figs. 2, 3 and Table 3).
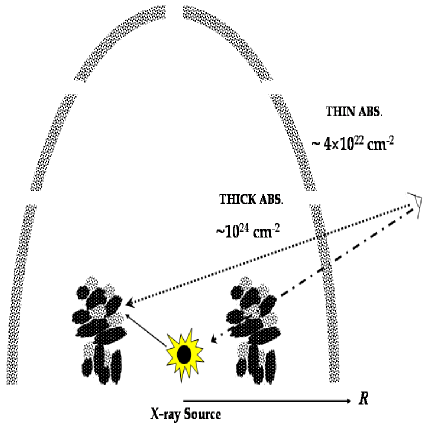
Our best-fit model for both XMM–Newton observations requires the presence of two absorbers (e.g. Table 3): a screen with NH 4 1022 cm-2, which blocks both primary and reflected emission, and a medium with NH 5–10 1023 cm-2 which obscures the nuclear source only. In the following we will refer to them as the thin and the thick absorber, respectively. The gas responsible for the reflection is most likely located at the far inner side of the molecular torus (i.e. the cylindrically-symmetric compact dusty absorber invoked in the simplest version of the AGN unified models, e.g. Krolik & Begelman 1988; Antonucci 1993; see also Jaffe et al. 2004). Given the column density of the thick absorber, it is quite straightforward to associate it to the torus. This in turn implies that the thin absorber surrounds both the central engine and reflecting/reprocessing region and, therefore, should be located well beyond the pc-scale distance usually attributed to the torus. A sketch of the proposed absorption geometry in the circumnuclear region of NGC 7582 is shown in Fig. 5.
This scenario is also supported by the discovery of an increase of a factor of 2.4 in the column density of the thick absorber between the two XMM–Newton observations (i.e. over an interval of about 4 years). Interestingly, similar large-amplitude variations of the absorbing column over the whole X-ray history of NGC 7582 were reported by Risaliti et al. (2002). They measured a fast variation in the NH value by a factor of 1.2 in a time interval of six months. The NH change observed between the XMM–Newton observations is, however, one of the largest amplitude detected so far. As suggested by Risaliti et al. (2002) and Matt, Guainazzi & Maiolino (2003), these variations cast serious doubts on the existence of a single homogeneous absorber (i.e. torus) as invoked in the simplest version of the unified models for AGN. They instead support a more complex scenario whereby the obscuring gas is largely inhomogeneous in space or time, with multiple absorbing components distributed in a range of distances from fractions of parsec up to several hundreds parsecs from the central supermassive BH.
Our results also corroborate the conclusions drawn by B07 on the basis of Chandra and HST images of NGC 7582. The extremely high value of the nuclear flux ratio between 1.6 and 0.6 m measured for this Seyfert galaxy suggests, in fact, the presence of a second intervening absorber more external than the expected torus. This could be linked to a prominent dust lane and/or dusty compact regions associated with starburst formation (e.g. Sosa-Brito et al. 2001; Wold & Galliano 2006) in this source. The XMM–Newton observations presented in this paper provide us with the direct evidence of the existence of two circumnuclear absorbing regions and allow us to shed light on their location.
This finding also agrees with the results presented by Guainazzi, Matt & Perola (2005) on the basis of a large sample of Seyfert 2 galaxies observed with Chandra or XMM–Newton and HST high-resolution optical coverage. They found that the presence of dust lane is correlated with values of the X-ray column density in the Compton-thin range. Even if the large-scale dust lanes seen in HST images do not seem to be directly responsible for the X-ray obscuration, these authors suggested that a dusty inner host galaxy environment may favor the formation of clumps/filaments of X-ray Compton-thin absorbing matter with large covering fractions.
These results lend support to the model presented by Matt (2000). He proposed a modification of the simplest version of the unification model for AGN whereby the line of sight of Compton-thick Seyfert 2 galaxies intercepts a compact distribution of dense matter (the torus) close ( 1–10 pc) to the nucleus, while Compton-thin Seyfert galaxies are viewed through absorbing patches likely associated with the dust lane(s) extending on scales of hundreds of parsecs observed in all Seyfert galaxies (see Malkan et al. 1988; Maiolino & Rieke 1995). As predicted by this model, in the case of NGC 7582 our line of sight intercepts both the torus and the “Compton-thin” regions which, therefore, coexist in this source.
6.1.1 The Fe K emission line
The EW values of the Fe K line at 6.4 keV derived from the XMM–Newton observations, i.e. EW2001 330 and EW2005 700 eV assuming a transmission-dominated scenario (see Table 1), are by far the largest measured in NGC 7582 so far. All previous X-ray observations reported a weaker feature with an EW 150 eV. However, when calculated with respect to the reflection component, the 2001 value of the line EW of 600 eV (e.g. Table 3) appears to be relatively low if compared with the expected one, i.e 1 keV (Matt et al. 1996), and usually observed in reflection-dominated sources (G05). Nonetheless, an iron K line with a EW600 eV has been recently detected in the mildly Compton-thick Seyfert galaxy Mrk 3 by Bianchi et al. (2005a). They suggested to explain such an Fe K line intensity by the combination of iron under-abundance and a small inclination angle (i.e. 90 deg) between our line of sight and the symmetry axis of reflecting medium. This interpretation might hold also for NGC 7582.
However, it is also worth noting that nearly all the reflection-dominated sources observed to date are truly Compton-thick, i.e. obscured by a NH 1.6 1024 cm-2, while the 2001 XMM–Newton spectrum of NGC 7582 turns out to be absorbed by a smaller column density (i.e. NH 5.5 1023 cm-2). Furthermore, in most of the theoretical calculations the geometry of the reflector is assumed to be a parallel slab illuminated by an isotropic X-ray source and this assumption may be incorrect in the case of NGC 7582. In fact, as emerged from this paper, the properties of the nuclear region in this Seyfert galaxy seems to be peculiar, with a lot of (variable) components contributing to the complex observed spectrum.
6.2 The soft X-ray emission
The combination of EPICRGS data provides by far the best quality spectrum of the soft X-ray emission in NGC 7582 to date. Our spectral analysis of these data has revealed that this emission is dominated by a wealth of emission lines from different ions (Fig. 1) superimposed on a very faint (i.e. 2% of the primary continuum) scattered continuum.
Table 2 shows the most prominent emission lines detected both in the RGS and in the EPIC spectra. All the line widths are unresolved and most of them were identified with hydrogen- and helium-like lines of the most abundant metals, from carbon to sulfur. The strongest lines are associated to the OVII He- and OVIII Ly- transitions. An intense OVIII Ly- is usually found in galaxies with powerful starburst activity (e.g. Guainazzi & Bianchi 2007). However, B07 found no spatial correlation between the peaks of the OVIII emission and the optical star-forming regions in the high-resolution composite Chandra and HST image of NGC 7582. Furthermore, the detection of the narrow OVIII Radiative Recombination Continuum (RRC) can be interpreted as strong evidence for recombination in a low-temperature photoionized plasma. In fact, in a collisional plasma these features are broad and weak and, therefore, hardly discernible above the bremsstrahlung continuum (Liedahl 1999). The presence of Fe L (i.e. FeXVII-XVIII) features can also provide further information on the nature of the line-emitting gas. The larger intensity of the 3-2 lines with respect to the 3-2 ones is at odds with the expectations for a recombination-dominated plasma, suggesting an important contribution from photoexcitation of bound-bound transitions by the continuum radiation field (Kallman et al. 1996; Sako et al. 2000).
This discovery significantly improves our understanding of the nature of the “soft excess” emission in this Seyfert galaxy. In fact, previous ASCA and BeppoSAX observations did not provide firm conclusions on the origin of this spectral component. T00 invoked the presence of emission from a collisionally ionized gas (mekal model in XSPEC), accounting for 41% of the total 0.1-2 keV flux, plus a “leaking” unabsorbed fraction ( 0.4%) of the hard X-ray continuum power law. Xue et al. (1998) suggested a mixture of scattered and thermal emission without detecting any emission line due to the poor statistics of their ASCA data.
A detailed discussion on the soft X-ray emission morphology of NGC 7582 has been presented in B07 on the basis of high-resolution Chandra and HST images. According to B07, the hard X-ray Chandra image is dominated by the nuclear unresolved emission while the soft X-ray emission is extended over 20 arcsec. The large-scale dust lane visible in the optical image strongly affects the morphology of this soft X-ray emission. In particular, most of it arises on the west side of the nucleus where the dust lane is optically thinner and, remarkably, exhibits similarity with the [O III] radiation cone-shaped structure detected by Storchi-Bergmann & Bonatto (1991).
BO6 also present evidence for two “hot spots” i.e. regions where emission from higher ionization stages of O and Ne is enhanced. These “hot-spots” appear to be unrelated with nuclear star-forming regions, and therefore suggest that the star-forming activity does not provide an important contribution to the ionization of the soft X-ray emitting gas. Such a conclusion can be also inferred by our analysis. The far infrared (FIR) luminosity of NGC 7582 is 9.6 1043 erg s-1 (Taniguchi & Ohyama 1998). Using the relationship between FIR and soft X-ray luminosity discovered by Ranalli et al. (2003) on a large sample of star-forming galaxies, we estimate a starburst contribution 5% to the total soft X-ray luminosity in NGC 7582 (i.e. = 4.8 1041 erg s-1).
7 Summary
We have presented the spectral analysis of the
EPICRGS data from two XMM–Newton observations of the bright Seyfert
2 galaxy NGC 7582 (May 2001 and April 2005).
The main results from our analysis can be summarized as follows:
The spectrum of the broadband continuum emission is very complex. It can be well described by a model consisting of a combination of a heavily absorbed (NH 12.9(5.5) 1023 cm-2 in the 2005(2001) spectrum) power law and a pure reflection component, both obscured by an additional absorber with column density of 4 1022 cm-2.
We consider this model as the most physically plausible description for the
XMM–Newton data on the basis of the following observational pieces of evidence.
Firstly, the hard X-rays light curves do not show any rapid and/or large
amplitude variation which are typically observed in
“transmission-dominated” Seyfert 2 galaxies and, in particular, in all
previous observations of NGC 7582. Noteworthy, the 2–10 keV flux level during
both XMM–Newton observations (i.e. ()
2(4) 10-12 erg cm-2 s-1) are by far the lowest values measured for this
source to date. Secondly, comparing the XMM–Newton spectra with that obtained from
a 1998 BeppoSAX observation (see Fig. 4), it appears evident that
NGC 7582 experienced a dramatic spectral transition.
The most prominent spectral feature
above 3 keV is the strong narrow Fe K line at 6.4 keV (EW2005
700 eV).
All these pieces of evidence lend support to a scenario according to
which XMM–Newton caught the source in a Compton reflection-dominated phase with a
very faint level of the (absorbed) primary continuum and a strong reflection
component.
Our best-fit model requires the presence of two absorbers, with the thinner (i.e. NH 4 1022 cm-2) one obscuring both primary and reflected emission. This finding further strengthens the conclusions reported by Guainazzi, Matt & Perola (2005) and Matt, Guainazzi & Maiolino (2003) about a distribution of the X-ray absorbing gas much more complex than that usually assumed in the most popular Unified models for AGN. In particular, the X-ray spectrum of NGC 7582 confirms the presence of a multiplicity of absorbing regions coexisting in the same source. We have detected an unprecedented increase in the column density of the inner, thicker absorber of NH 7.4 1023 cm-2 between 2001 and 2005, while, on the contrary, the NH of the second absorber remained unchanged. This huge variation suggests strong clumpiness and inhomogeneity of the absorbing matter along the line of sight. A likely explanation for the observed spectral variability is the drift of clouds located very near the central source as proposed by Risaliti et al. (2005) and Lamer et al. (2003) to account for similar changes in the obscuring column density of NGC 1365 and NGC 3227, respectively.
Future observations above 10 keV of
NGC 7582 will be crucial to shed light on the properties of
the X-ray continuum emission as well as the geometry and variability
pattern of the obscuring gas in the nuclear
environment of this peculiar Seyfert 2 galaxy.
The analysis of the high resolution RGS spectrum has revealed that soft X-ray excess in this obscured AGN is dominated by a wealth of emission lines with a very low level of scattered/leaked continuum. According to the recent Chandra results presented by B07, this emission is extended on a hundreds-pc scale and, remarkably, its shape and location are very similar to the optical [OIII] ionization cone observed by Storchi-Bergmann & Bonatto (1991). The most prominent emission lines originate from H- and He-like ions of O, C and Ne as well as by L-shell transitions of FeXVII. The detection of a narrow OVIII RRC strongly suggests that most of the soft X-ray emission arises in a photoionized plasma. These findings are in agreement with the few high-resolution soft X-ray spectroscopic measurements published to date (e.g. Sambruna et al. 2001; Young et al. 2001; Kinkhabwala et al. 2002; Guainazzi & Bianchi 2007).
Acknowledgements.
We would like to thank the staff of the XMM–Newton Science Operations Center for their support. Useful discussions with Fabrizio Nicastro are acknowledged. This research has made use of the NASAIPAC Extragalactic Database (NED) which is operated by the Jet Propulsion Laboratory, California Institute of Technology, under contract with the National Aeronautics and Space Administration. EP acknowledges the financial support from INAF.References
- (1) Antonucci, R., 1993, ARA&A, 31, 473
- (2) Arnaud K.A., 1996, ASP Conf. Series, 101, 17
- (3) Awaki, H., Murakami, H., Ogawa, Y., Leighly, K. M., 2006, ApJ, 645, 928
- (4) Bennett, C.L., et al., 2003, ApJS, 148, 1
- (5) Bianchi, S., Miniutti, G., Fabian, A. C., Iwasawa, K., 2005a, MNRAS, 360, 380
- (6) Bianchi, S., Guainazzi, M., Matt, G., et al., 2005b, A&A, 442, 185
- (7) Bianchi, S., Guainazzi, M., Chiaberge, M., 2006, A&A, 448, 499
- (8) Bianchi, S., Chiaberge, M., Piconcelli, E., Guainazzi, M., 2007, 374, 697 (B07)
- (9) Cid Fernandes, R.., Storchi-Bergmann, T., Schmitt, H. R., 1998, MNRAS, 297, 579
- (10) den Herder, J. W., et al., 2001, A&A, 365, L7
- (11) Dewangan, G. C., Griffiths, R. E., 2005, ApJ, 625, L31
- (12) Elvis, M., Risaliti, G., Nicastro, F., et al., 2004, ApJ, 615, L25
- (13) Gabriel C., Denby M., Fyfe D. J., Hoar J., Ibarra A., 2003, in ASP Conf. Ser., Vol. 314 Astronomical Data Analysis Software and Systems XIII, eds. F. Ochsenbein, M. Allen, & D. Egret (San Francisco: ASP), 759
- (14) Gu, M. F., Kahn, S. M., Savin, D. W., et al., 1999, ApJ, 518, 1002
- (15) Guainazzi, M., et al., 1998, MNRAS, 301, L1
- (16) Guainazzi, M., Matt, G., Fiore, F., Perola, G. C., 2002, A&A, 388, 787
- (17) Guainazzi, M., Matt, G., Perola, G. C., 2005, A&A, 444, 119
- (18) Guainazzi, M., Fabian, A.C., Iwasawa, K., et al., 2005, MNRAS, 356, 295 (G05)
- (19) Guainazzi, M., & Bianchi, S., 2007, MNRAS, 374, 1290
- (20) Jaffe, W., et al., 2004, Nature, 429, 47
- (21) Jimenez-Bailon, E., et al., 2003, ApJ, 593, 127
- (22) Kallman, T. R., Liedahl, D., Osterheld, A., Goldstein, W., Kahn, S., 1996, ApJ, 465, 994
- (23) Kallman, T. R., Palmeri, P., Bautista, M. A., Mendoza, C., Krolik, J. H., 2004, ApJS, 155, 675
- (24) Kinkhabwala, A., Sako, M., Behar, E., et al., 2002, ApJ, 575, 732
- (25) Krolik, J. H., & Begelman, M. C., 1988, ApJ, 329, 702
- (26) Lamer, G., Uttley, P., McHardy, I. M., 2003, MNRAS, 342, L41
- (27) Liedahl, D. A. 1999, in X-Ray Spectrocopy in Astrophysics, ed. J. van Paradijs & J. A. M. Bleeker (Berlin: Springer), 189
- (28) Maccacaro, T., Perola, G. C., 1981, ApJ, 246, L11
- (29) Magdziarz, P., & Zdziarski, A., 1995, MNRAS, 273, 837
- (30) Maiolino, R., & Rieke, G. H., 1995, ApJ, 454, 95
- (31) Makishima, K., 1986, Lecture Notes in Physics, 266, 246
- (32) Malkan, M. A., Gorjian, V., Tam, T., 1998, ApJS, 117, 25
- (33) Matt, G., Brandt, W. N., Fabian, A. C., 1996, MNRAS, 280, 823
- (34) Matt, G., 2000, A&A, 355, L31
- (35) Matt, G., 2002, MNRAS, 337, 147
- (36) Matt, G., Guainazzi, M., Maiolino, R., 2003, MNRAS, 342, 422
- (37) Matt, G., Bianchi, S., D’Ammando, F., Martocchia, A., 2004, A&A, 421, 473
- (38) Molendi, S., Bianchi, S., Matt, G., 2003, MNRAS, 343, L1
- (39) Piccinotti, G., Mushotzky, R. F., Boldt, E. A., et al., 1982, ApJ, 253, 485
- (40) Piconcelli, E., Jimenez-Bailon, E., Guainazzi, M., et al., 2004, MNRAS, 351, 161
- (41) Pounds, K., & Vaughan, S., 2006, MNRAS, 368, 707
- (42) Prieto, M. A., Reunanen, J., Kotilainen, J. K., 2002, ApJ, 571, L7
- (43) Ranalli, P., Comastri, A., Setti, G., 2003, A&A, 399, 39
- (44) Regan, M. W., & Mulchaey, J. S, 1999, AJ, 117, 2676
- (45) Risaliti, G., Elvis, M., Nicastro, F., 2002, ApJ, 571, 234
- (46) Risaliti, G., Elvis, M., Fabbiano, G., Baldi, A., Zezas, A., 2005 ApJ, 623, L93
- (47) Sako, M., Kahn, S. M., Paerels, F., Liedahl, D. A., 2000, ApJ, 543, L115
- (48) Sambruna, R. M., Netzer, H., Kaspi, S., et al., 2001, ApJ, 546, L13
- (49) Schachter, J. F., Fiore, F., Elvis, M., et al., 1998, ApJ, 503, L123
- (50) Schurch, N. J., Roberts, T. P., Warwick, R. S., 2002, MNRAS, 335, 241
- (51) Sosa-Brito, R, M., Tacconi-Garman, L. E., Lehnert, M. D., Gallimore, J., 2001, ApJS, 136, 61
- (52) Stark, A. A., et al., 1992, ApJS, 79, 77
- (53) Storchi-Bergmann, T., & Bonatto, C. J., 1991, MNRAS, 250, 138
- (54) Struder, L., Briel, U., Dennerl, K., et al., 2001, A&A 365, L18
- (55) Stuhlinger M., et al., 2006, XMM-SOC-CAL-TN-0052, Issue 3.0, (astro-ph/0511395)
- (56) Taniguchi, Y., & Ohyama, Y., 1998, ApJ, 507, L121
- (57) Turner, T. J., & Pounds, K. A., 1989, MNRAS, 240, 833
- (58) Turner, T. J., George, I. M., Nandra, K., Mushotzky, R. F., 1997, ApJS, 113, 23
- (59) Turner, T. J., Perola, G. C., Fiore, F., et al., 2000, ApJ, 531, 245 (T00)
- (60) Turner, M. J. L., Abbey, A., Arnaud, M., et al., 2001, A&A, 365, L27
- (61) Uttley, P., McHardy, I. M., Papdakis, I. E., Guainazzi, M., Fruscione, A., 1999, MNRAS L6
- (62) Ward, M. J., Wilson, A. S., Penston, M. V., et al., 1978, ApJ, 223, 788
- (63) Warwick, R. S., Sembay, S., Yaqoob, T., etal., 1993, MNRAS, 265, 412
- (64) Wold, M., & Galliano, E., 2006, MNRAS, 369, L47
- (65) Xue, S., Otani, C., Mihara, T., Cappi, M., Matsuoka, M., 1998, PASJ, 50, 519
- (66) Young, A. J., Wilson, A. S., Shopbell, P. L., 2001, ApJ, 556, 6