Very high energy gamma-ray observations during moonlight and twilight with the MAGIC telescope
Abstract
We study the capability of the MAGIC telescope to observe under moderate moonlight. TeV -ray signals from the Crab nebula were detected with the MAGIC telescope during periods when the Moon was above the horizon and during twilight. This was accomplished by increasing the trigger discriminator thresholds. No change is necessary in the high voltage settings since the camera PMTs were especially designed to avoid high currents. We characterize the telescope performance by studying the effect of the moonlight on the -ray detection efficiency and sensitivity, as well as on the energy threshold.
keywords:
Gamma-ray astronomy; Imaging atmosphere air Cherenkov telescopes; analysis technique.PACS:
95.55.Ka , 95.75.-z , 95.85.Pw, , , , , , , , , , , , , , , , , , , , , , , , , , , , , , , , , , , , , , , , , , , , , , , , , , , , , , , , , , , , , , , , , , , , , , , , , , , , , , , , , , , , , , , , , , , , , , , , , , , , , , , , , , , , , , , , , , , , , , , , , , , , , , , , , , , , , , , , , , , , , , ,
1 Introduction
Ground-based searches for very high energy (VHE) -ray emission from celestial objects are normally carried out by so-called imaging air Cherenkov telescopes (IACT) during clear, moonless nights. The MAGIC IACT Lorenz has been designed to carry out observations also during moderate moonlight. In this paper we describe the technical innovations and analysis changes that allow observations in the presence of the Moon.
The MAGIC (Major Atmospheric Gamma Imaging Cherenkov) Telescope is located on the Canary Island La Palma (2200 m asl, , ). MAGIC is currently the largest IACT, with a 17 m-diameter tessellated reflector dish Cortina . The camera is equipped with 576 6-dynode compact photo-multiplier tubes111type 9116 25.4 mm, and 9117 of 34 mm, from Electron Tubes Inc. with CsRb cathodes with a peak QE of around 26 and spectral sensitivity extended to 650 nm.(PMTs) with enhanced quantum efficiency Paneque . The total field of view is 3.5∘, divided into two sections: an inner hexagon of 396 small pixels, of about 3 cm (0.1∘) diameter, which also corresponds roughly to the trigger area, and the outer rings of 6 cm diameter pixels. The use of larger pixels in the outer zone reduces the cost of the camera, while the quality of the image, already limited in this zone by coma aberration, it not deteriorated.
One of the unique features of MAGIC is its capability to observe under moderate moonlight. MAGIC has an average duty cycle per year of about 12 under strict condition of dark observations, i.e. between astronomical dusk and dawn and with the Moon below the horizon. If this strict requirement is relaxed to allow observations under moderate moonlight or twilight, an increase of the duty cycle to 18 (from 1000 to 1500 hours of observations per year) is possible. Such an increase in the duty cycle places MAGIC in a prominent position, in particular for the study of variable sources as well as in multi-wavelength campaigns together with other instruments.
Observations during moonlight were tested by the Whipple collaboration Pare . Their approach was based on restricting the PMTs sensitivity to the UV range, either by using solar blind PMTs or by using UV sensitive filters in front of regular PMTs Chantell . Later, the CT1 telescope of the predecessor experiment HEGRA pioneered regular operations under moderate moonlight Kranich , by lowering the PMT high voltages (HV). Regular observations were done with CT1 under such conditions, during its last years of operation. All these solutions were feasible, but also expensive, time consuming and not efficient in terms of energy threshold and sensitivity. Also, the change of the PMTs or of the filters were cumbersome during nights partially dark and partially with moonlight.
In section 2 we present the technical aspects regarding observations under moonlight with MAGIC. Section 3 describes the data used in this study, the analysis technique and some technical aspects related to the increase of the moonlight. Section 4 discusses the effects of the moonlight on the reconstruction of the shower images, based on Crab nebula data. In section 5 we present the telescope response in terms of -ray detection efficiency, sensitivity and energy threshold. The conclusions and some recommendations for moonlight data acquisition are given in Section 6.
2 Technical consideration for MAGIC observations under the moonlight
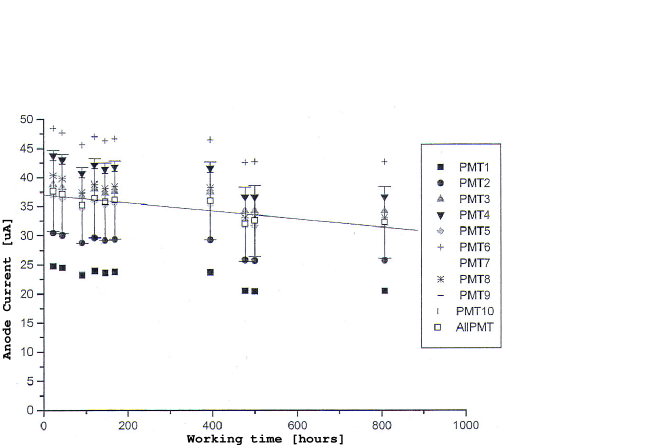
Traditionally, PMTs are operated with amplification gains around which, under moonlight, generate continuous (direct) currents (DCs) that can damage the last dynode, resulting in rapid ageing of the PMT. In addition very high anode currents liberate many absorbed molecules (mostly water) and ionize them. Quite a few of the ions might diffuse into the PMT front-end volume and get accelerated towards the cathode where they liberate a large number of electrons on impact, thus generating large secondary pulses (so-called afterpulses). The PMT ageing is dominantly caused by a damage of the last dynode due to this intense electron bombardment, which strongly reduces the electron emission of these dynodes. The reduction depends normally on the total charge per unit dynode area, as well as on the dynode material and its production characteristics. Due to the electron multiplication in the dynodes, obviously the last dynode is the most affected. The gain of a 1 cm2 area CuBe dynode drops by a factor two for an integrated charge of 200-400 Coulomb. In most cases the gain drop due to the ageing of the last dynode can easily be compensated by increasing the HV thus resetting the gain of the PMT back to the initial value. In order to study the range of ageing of the MAGIC PMTs under the influence of scattered moonlight an accelerated test has been carried out for a sample of ten of the Electron Tubes 9116 B PMTs which are used in MAGIC PMTs . The PMTs, operated at the standard MAGIC electronic conditions, were exposed to light from a stabilized red LED resulting initially in a mean anode current of 37 A. The anode current drop was monitored regularly over a time period of 820 h. Figure 1 shows the gain drop, averaged over the 10 PMTs, for the duration of the test. We observed a gain drop of 19 per 1000 h operation at this high level of illumination. The integrated anode charge was 120 Coulomb. The maximum moonlight illumination which is allowed in MAGIC corresponds to an anode current of 8 A. For this anode current we estimate a gain drop of 3.8 per 1000 h observation time. This time is more than a typical accumulated observation time per year during bright moonlight (here we make the assumption that no HV reset to recover the gain occurs during the gaps between nightly and monthly observations). For compensating this ageing effect we regularly readjust the HV of the MAGIC PMTS once or twice a year. From the accelerated ageing study and practical experience over more than two years one can conclude that the moonlight operation of low gain, six dynode PMTs is very safe and requires rarely modest gain adjustments. Actually, it is possible to operate the PMTs without serious degradation in the presence of much brighter moonlight.
The MAGIC camera was designed to allow observations under different light conditions, with no need of lowering the HVs. It is the only Cherenkov telescope camera equipped with PMTs that run at a gain of about 3 Performance thus avoiding high anode currents. In order to also detect single photoelectrons (phe) the PMT signal is fed to an AC-coupled fast, low noise preamplifier to raise the combined gain to about . The DC anode currents are in first order proportional to the photoelectron rate and in turn to the photon rate. When observing at a dark area of the night sky the anode currents are typically 0.8 A. This corresponds to a night sky background light of ph m-2 s-1 sr-1 Mirzoyan . Direct moonlight during full Moon is about a few times ph m-2 s-1. The increase of the background light due to the presence of the Moon depends on various factors including the source zenith angle, Moon phase, angular distance to the Moon, Moon zenith angle, and atmospheric composition as well as the aerosol content of the atmosphere. Even a clear atmosphere results in a loss of 10-20 of the light, mostly by Rayleigh scattering. Unavoidable Mie scattering results in strong light intensity close to the Moon direction. At around 25∘ away from the Moon the direct scattered moonlight approaches a constant level below the level of the night sky light background. In addition, moonlight has a spectral distribution different from that of the light of the night sky (LONS), peaking at blue wavelengths and thus better matching the Cherenkov light than the dark night LONS.
We restrict MAGIC observations to a maximum DC of 8 A. This permits observations in the presence of the Moon until (since) 3-4 days before (after) full Moon, for an angular distance to the Moon greater than 50∘ Performance .
Like most other IACTs, MAGIC operates on a double trigger threshold trigger , i.e., the hardware trigger threshold which is determined by the fluctuations in the LONS, and a higher software threshold for image reconstruction. A typical trigger condition requires that a minimum number of neighboring pixels (e.g. four in the present MAGIC configuration) exhibit a signal larger than a given threshold of a few phe within a short time window.
The PMT analog signal (see Figure 2) is transmitted over an optical fiber, converted into an electrical pulse and split into two branches. One of the branches is routed to the digitizers (FADCs). A second branch enters a discriminator, which issues a digital signal (5.5 ns FWHM) whenever the pulse exceeds a given threshold. The discriminator thresholds (DT) are set by an 8-bit digital-to analog converter (DAC) which is controlled from a PC. The thresholds can be modified during telescope operation.
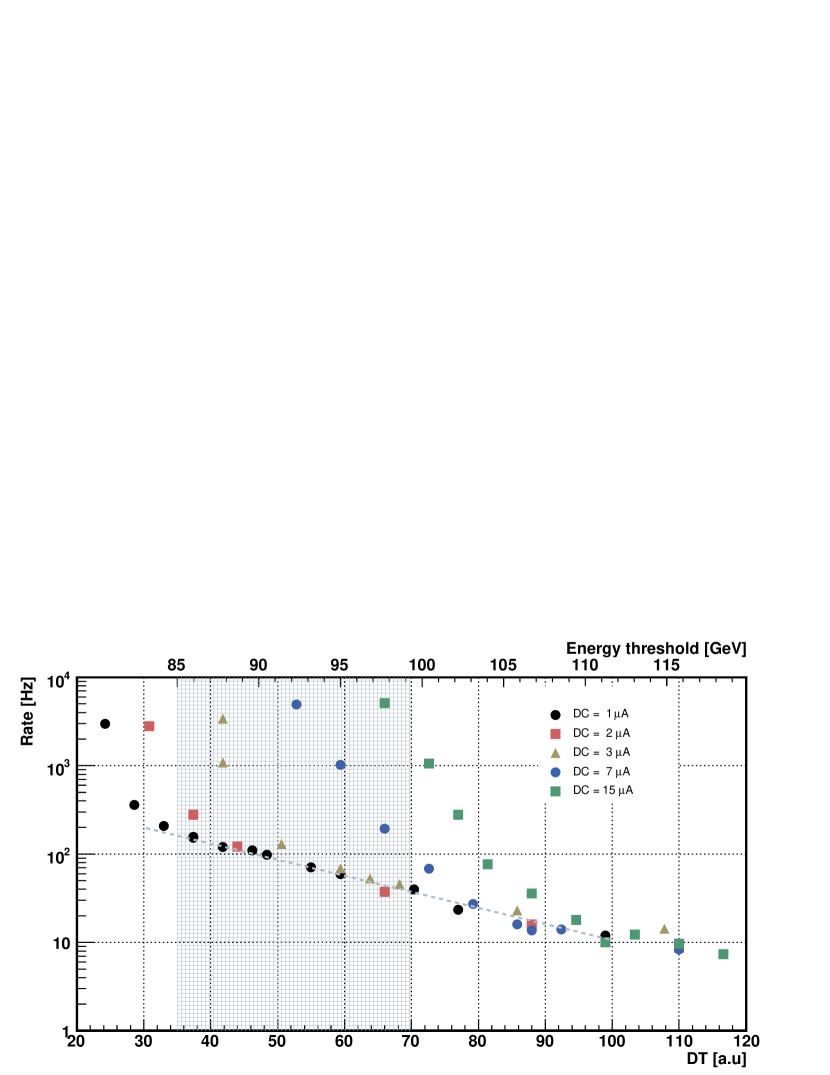
Figure 3 shows the dependence of the trigger rate (for a four neighboring pixels configuration) on the DT settings, for different illumination conditions (which produce different anode currents in the camera). Dark observations of a galactic plane region produce anode currents of about 1 A and the maximum allowed current under regular observations is 8 A. The LONS is responsible for the steep increase at low DT values (at 30 a.u. in the case of dark observations). At higher DT values the rate is caused by Cherenkov showers and a small admixture from accidental triggers caused by the LONS and/or large amplitude afterpulses. The telescope operates at the minimum possible DT for which the contribution of accidental triggers is negligible. For extragalactic regions the DTs are generally set to 30 a.u., which corresponds to a pulse charge of 8-10 phe. Galactic regions are brighter and require an increased minimum DT to the equivalent of 11-12 phe. Even higher DT values are needed to keep the trigger rate below the limit of the DAQ system (500 Hz) for observations during twilight and moonlight.
3 Observations and Data Analysis
To characterize the response of the telescope under moonlight, we observed the Crab nebula at different light conditions between January 2006 and March 2006 (see Table 1). The observations were carried out in ON/OFF mode, that is, the source was observed on-axis and observations from an empty field of view were used to estimate the background. Two data sets, one with zenith angle between 20∘ and 30∘, and a second one between 30∘ and 40∘, were acquired and analyzed separately. Depending on the different moonlight levels, the resulting anode currents ranged between 1 A and 6 A. Correspondingly, the DT was varied between 35 and 65 units. Data from quasi-simultaneous observations during dark time serve as reference when studying the performance of the telescope at those moonlight level conditions.
The acquired data were processed by the standard MAGIC analysis chain calib ; signal . The images were cleaned using absolute tail and boundary cuts at 10 and 5 phe, respectively. Quality cuts based on the trigger and after-cleaning rates were applied in order to remove bad weather runs and runs spoiled by car or satellite flashes. The shower images were parameterized using the following Hillas parameters Hillas : SIZE (total light content of the image), WIDTH, LENGTH (second moments of the distribution of light), DIST (distance from the image center of gravity (c.o.g) to the center of the camera –which corresponds to the position of the observed source), CONC (ratio between the light content of the two brightest pixels and SIZE) and ALPHA (angle between the image major axis and the line joining the center of the camera and the image c.o.g). Except for the ALPHA parameter, all the other variables were combined for /hadron separation by means of a Random Forest classification algorithm Bock ; Breiman , trained with MC simulated -ray events and data from galactic areas near the source under study but containing no -ray sources mc . The Random Forest method permits to calculate for every event a parameter dubbed HADRONNESS, which parameterizes the purity of hadron-initiated images in the multi-dimensional space defined by the Hillas variables. The signal region is defined by the cuts HADRONNESS0.15 and ALPHA8∘.
4 Effect of the Moon light on the Hillas Parameters
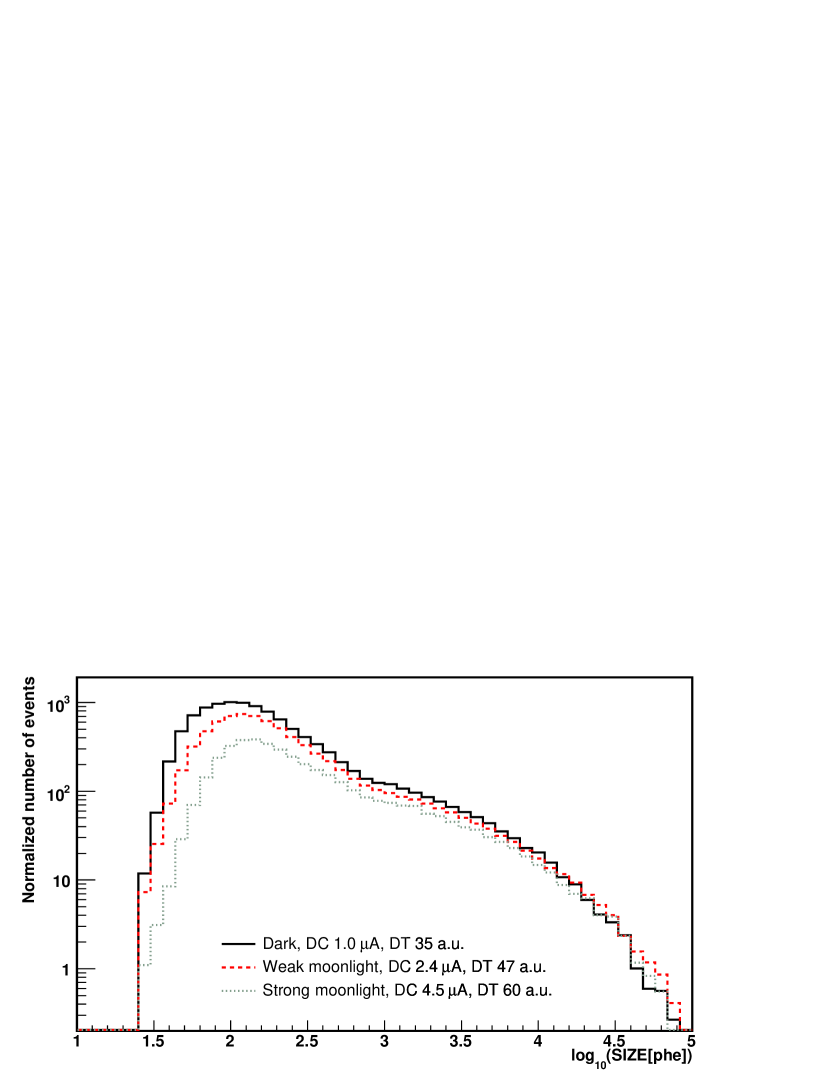
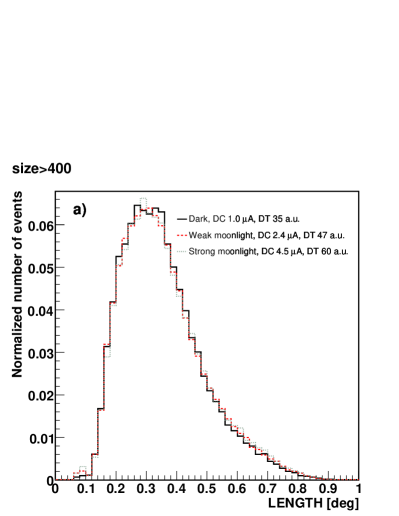
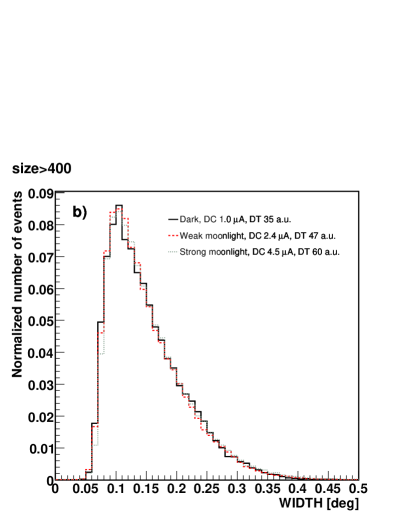
Several observation samples at different Moon illuminations, hence at different DT, were recorded for detailed studies of the impact of the moonlight on the analysis and the telescope performance. The distribution of the various Hillas parameters for each of these sets are to be compared with the reference set, derived from Crab nebula observations in dark conditions. As we increase the DT levels to counteract accidental triggers, one depletes the SIZE distribution of shower candidates, as expected, mostly at low values. However, we find that a substantial number of showers with SIZE up to phe, i.e. those well above the trigger level (which is around 50 phe), are also suppressed (see Figure 4). On the other hand, the LENGTH, WIDTH and CONC distributions above 200 phe do not show significant differences for events recorded either during dark nights or in the presence of the Moon. As an example, the distributions of LENGTH and WIDTH for SIZE400 phe are shown in Figure 5 (panels a and b). Since these parameters have the highest discrimination power between and hadron events, we do not expect /hadron separation to degrade due to the presence of the Moon. On the other hand, below 200 phe the distributions are distorted by the different trigger threshold. A study of the effect of the moonlight on the threshold is presented in section 5.2.
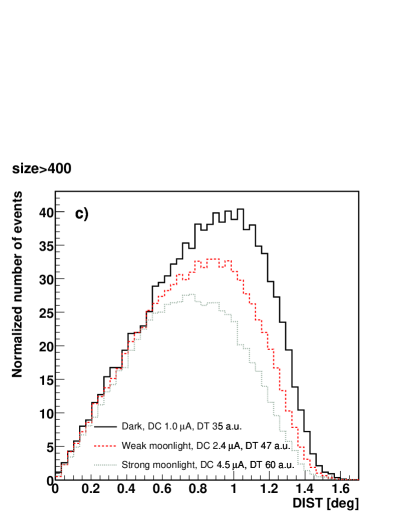
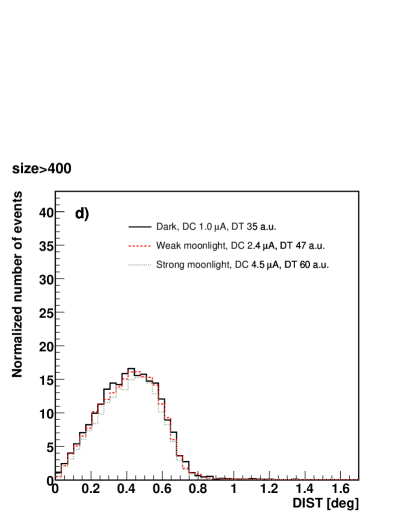
Showers with SIZE1000 phe are well above the trigger level, even for an increased DT due to the presence of the Moon. However, when the shower impact parameter is much larger than 100 m, i.e., the Hillas variable DIST is large, a significant fraction of the light falls outside the trigger area (1∘ radius around the camera center for a camera FOV of 3.5∘). In some cases, the fraction of the shower image contained inside the trigger area will not exceed the increased threshold for at least 4 neighboring pixels, as required for a trigger. This effect is reflected in the DIST distribution, shown in Figure 5c). For a lower SIZE cut of 400 phe there is an increased reduction of showers at large DIST (0.8∘) values , i.e. those not fully contained in the trigger area, confirming our hypothesis. Further confirmation was obtained by two different tests. First, the DIST distributions for events fully contained in the trigger region were compared (Figure 5d). In such a case we find similar distributions, confirming our hypothesis that the differences shown in Figure 5c) are coming from events whose image is only partially contained in the trigger region. A last test was performed by observing Crab in dark conditions (DC1.1 A), but with increased DTs. In this case we found similar inefficiencies as those shown in Figure 5c). Therefore we can conclude that the change of the DIST distribution is not related to the mean DC current (i.e. with the camera illumination) but only to the DT level.
These results show that moonlight does not distort the images from Cherenkov showers –for an image cleaning based on the pixels’ absolute light content, as that used in MAGIC. This has two important consequences. At first, the analysis based on the Hillas parameters does not have to be adapted for data acquired under moonlight, and in particular the /hadron separation power is not reduced for these kind of observations. Secondly, the differences that we find in the event rates and the DIST distributions are exclusively due to the fact that the DTs were increased to keep a low rate of accidental events, together with the fact that the trigger area does not span the whole camera. It is important to remark that this is a merely technical issue, imposed by the intrinsic maximum rate the DAQ system can handle (about Hz in the present MAGIC configuration). For this study we followed the conservative approach of increasing the DTs, and hence the dependence of the telescope response on the level of Moon illumination will be parameterized as a function of DT. However, with a fast enough DAQ system, we could keep constant the DTs and deal with the increased amount of accidental events produced by the moonlight during the off-line analysis, or by a more developed second-level trigger system.
5 Telescope Performance
As was shown above, shower images are not distorted by the moonlight. However, the performance of the telescope is modified for this kind of observations with respect to dark conditions, due to the increase of the DTs. As is shown in Figure 4, there is a reduction in the collection area over a wide range of energies. In principle, this effect could be taken into account by proper MC simulation of the different trigger conditions. In practice, however, the DTs are not fixed during the MAGIC observations, but change dynamically to compensate for short term variations of the camera illumination caused by the movement of the Moon and the source along the sky, as well as for variations of the position of stars in the MAGIC camera. This makes such a simulation a difficult task. Instead, we use Crab nebula observations to estimate the efficiency of detecting -rays, for every DT and SIZE, relative to the values for dark observations. These values are used during the off-line analysis together with the MC simulation with standard DTs to calculate the correct collection areas for every DT and SIZE. We also compute the effect of the moonlight on the telescope sensitivity (the minimal flux detectable with significance in 50 hours of observations), and on the energy threshold. Note that we will in the following use the level of DT as an equivalent measure of the moonlight.
5.1 -ray Detection Efficiency and Telescope Sensitivity
Observations of the Crab nebula are divided into different samples according to the observation date and the DT value. For each of the samples we get a measurement of the -ray rate (), i.e. the number of excess events per unit time. We find that, for a given SIZE range, the dependence of with the DT is well described by a linear function:
| (1) |
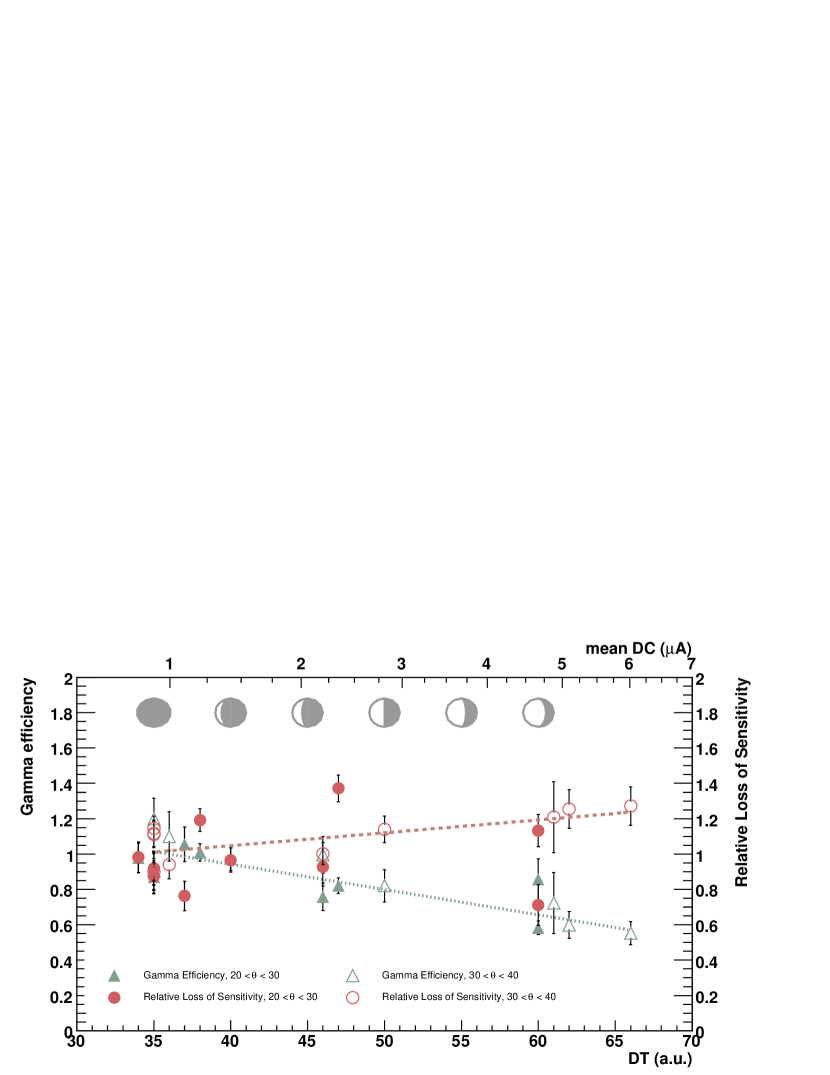
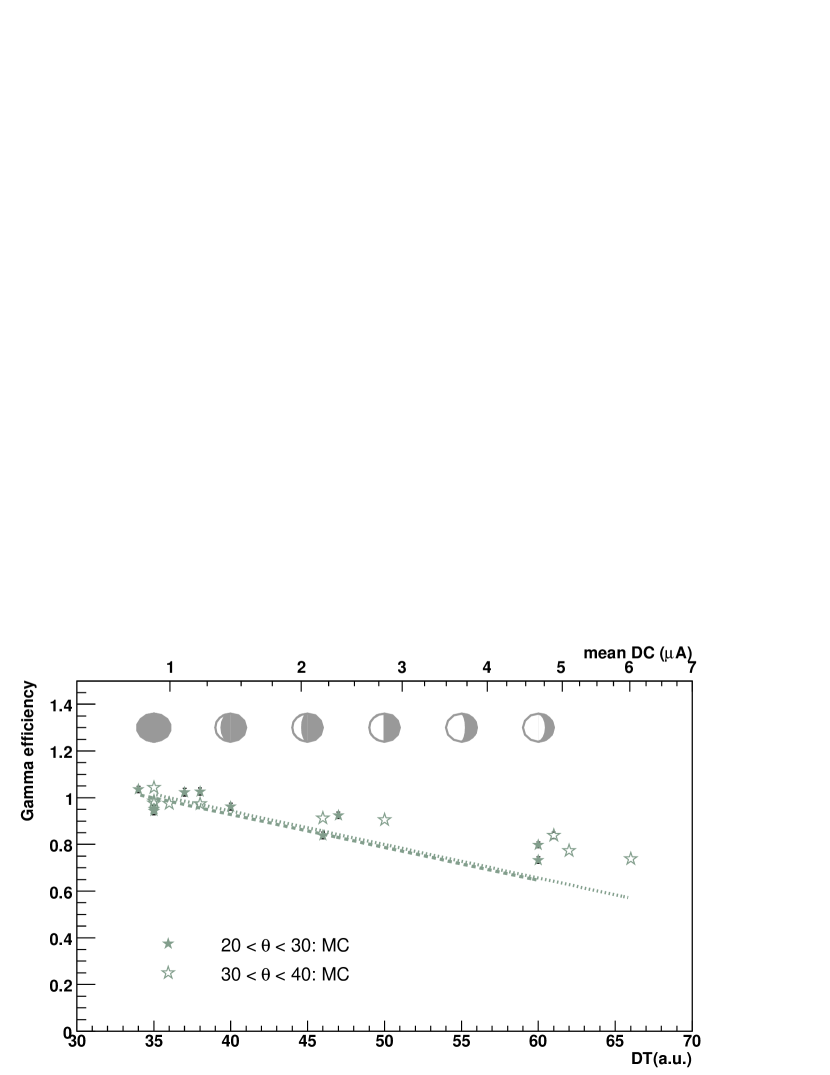
where is a normalization factor, is the efficiency loss rate, and is a reference DT value that, for convenience, is chosen as the one used in dark observations, i.e. . We present the results for , i.e. the -ray detection efficiency with respect to the case (dark observations). The results for SIZE400 phe and the two considered zenith angle samples ( and ) are shown in Figure 6. The fit parameters obtained for both zenith angles are compatible within statistical errors. This allows us to perform a combined fit for both samples. We obtain the following expression for the -ray detection efficiency:
| (2) |
The error quoted is obtained from the fit and it does not include any correlation with the normalization factor. The overall uncertainty obtained from the residuals of the individual data points is 0.1. This most likely comes from variations in the experimental conditions (weather, hardware, etc) in the different observation nights, and can be regarded as a measure of the systematic point-to-point uncertainty when measuring light-curves within the total observation time of our analysis, that is, three months. The results show that the -ray detection efficiency for events above SIZE phe is reduced with the moonlight brightness with a rate of 1.41 per DT count, implying that, for high illumination of the camera, detection efficiency losses up to 50 are expected. Moreover, this result seems to be independent of the studied zenith angle range. A study of the different dependence of the efficiency as a function of SIZE will be discussed in Subsection 5.2.
We have also measured the loss of sensitivity () produced by the increase of the DTs. In dark conditions the flux sensitivity () of the MAGIC telescope above 400 phe is 2.5 of the Crab nebula flux sensi . The relative sensitivity () is computed using Crab nebula observations under different moonlight conditions by:
| (3) |
where and are, respectively, the number of excess and background events after analysis cuts (see Section 3) for an observation lasting a time . The upper index 0 stands for the values for the DT=35. The dependence of the sensitivity loss as a function of DT for a SIZE cut 400 phe is shown in Figure 6. It is well fitted by a linear function, parameterized as , where is referred to as sensitivity loss rate, that is:
| (4) |
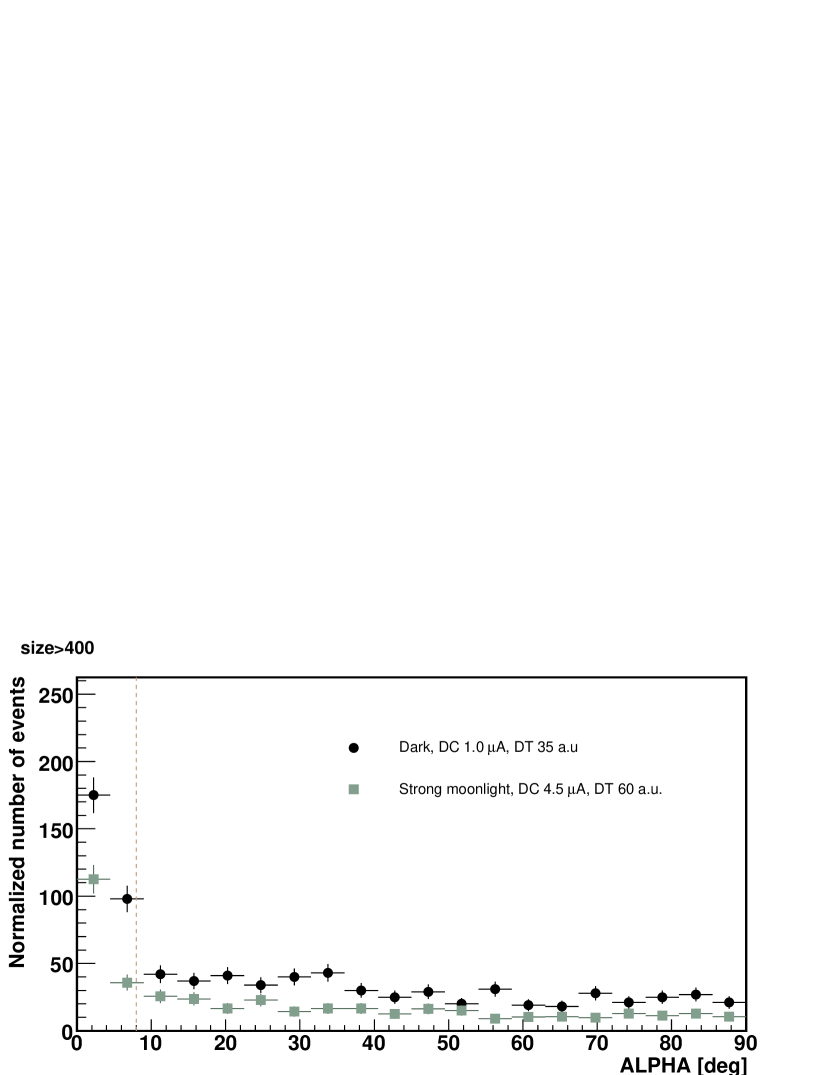
Therefore, a loss of sensitivity of per DT unit is observed for a cut SIZE400 phe. This value can be compared with the loss in the -ray detection efficiency obtained in Equation 2. For instance, for a rather high moonlight brightness, e.g. for DT=60, we get a -ray detection efficiency of 65 but the sensitivity decreases only by 15 (e.g. from a 2.5 to a 2.9 of the Crab nebula flux). This is due to the fact that signal and background rates both are equally reduced by an increase of the trigger threshold. The effect is further illustrated in Figure 7, where the distributions of ALPHA for dark and strong moonlight observations are compared (in this case the reduction of signal and background rates is a factor of ). One expects the loss of sensitivity to go as the square root of the loss of -ray rate, which is, within statistical errors, what we find in our data.
The results described above are compared with Monte Carlo (MC) simulations, for which the background light fluctuations and pixel trigger thresholds are increased in agreement with the values observed in the data. In Figure 8 we show the results of the fit to the -ray detection efficiency as determined from the different Crab nebula observations (from Figure 6), together with the results of the MC simulation. The result shows agreement in the general trend. The evident discrepancy between data and MC at large DT can be attributed to the fact that the simulation of the MAGIC trigger is not yet optimized for this type of observations. Note that the results shown in this paper rely on real data events only, and therefore are not affected by this discrepancy.
5.2 Dependence on SIZE and Energy
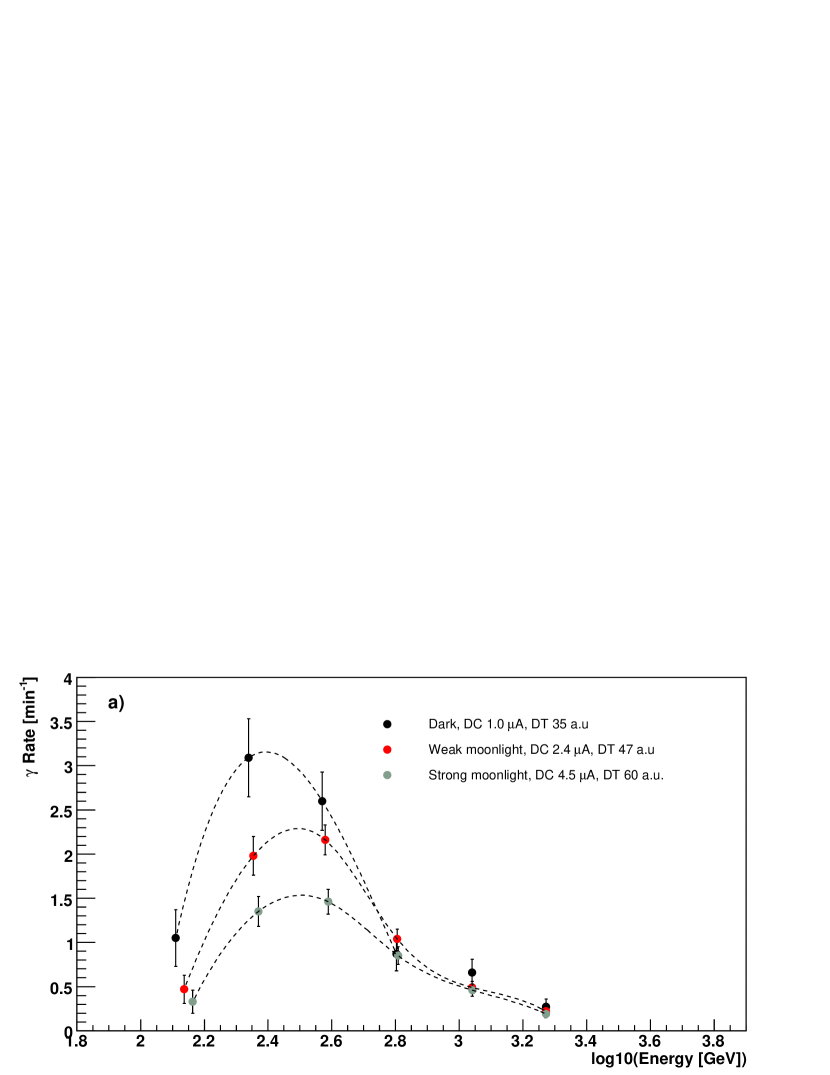
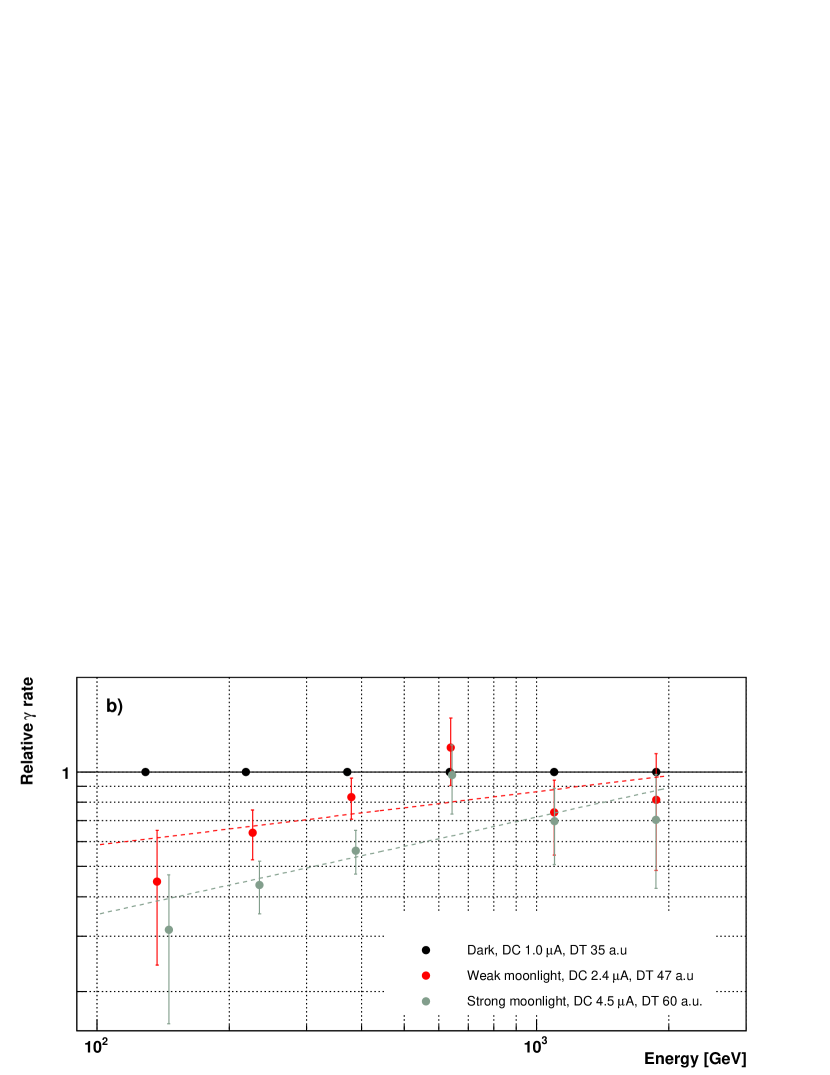
The results obtained in the previous section are valid for the integral flux above SIZE400 phe. However, the loss of efficiency and sensitivity are expected to depend strongly on SIZE and hence on the energy. Figure 9 shows the -ray rate as a function of the energy (both in absolute value and relative to the values for dark observations), for three different moonlight intensities. As expected, the loss is larger for more intense camera illuminations mainly at low energy values, whereas for high energies we find no significant differences. In order to quantify the impact of the moonlight in the physical parameters extracted from the MAGIC observations (that is, the flux normalization and spectral shape), we fit a power-law function () to the relative -ray rate (Figure 9b) for the different moonlight intensities. The normalization is chosen at 400 GeV to minimize the correlation between the errors of the two free parameters, namely: and . The fit yields , for a weak camera illumination and , for a strong camera illumination. and can be regarded as the systematic effect that would be introduced in the determination of the spectral parameters if not treating properly the moonlight-related changes. They can be compared to the systematic errors coming from other sources: for the flux normalization (see Section 5) and 0.2 for the spectral index, to stress the importance of this study to measure the spectral parameters.
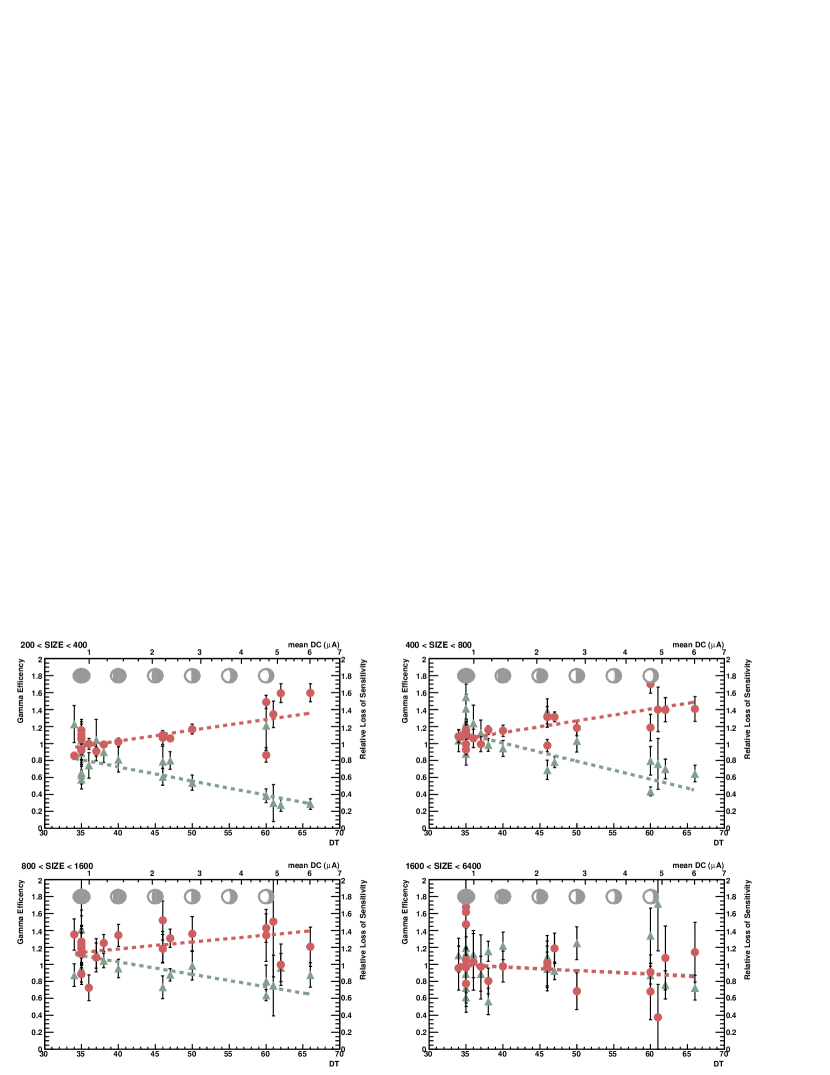
In order to understand the dependence of the -ray detection efficiency on the energy we have the same study for four bins of SIZE, namely [200,400], [400,800], [800,1600] and [1600,6400] phe, which roughly correspond to the energy ranges [150,300], [300,600], [600-1000] and 1000 GeV, respectively, for low zenith angle. The -ray efficiencies as a function of the moonlight brightness (using the DT setting as the equivalent measure) are shown in Figure 10 for zenith angles between 20∘ and 30∘. The data sample with zenith angles between 30∘ and 40∘ was also analyzed with similar results. Equation 1 describes reasonably well the data in all SIZE bins considered. The efficiency loss rate () decreases as SIZE increases since the probability of showers passing a high trigger level is higher for larger images. For high enough values of SIZE the -ray detection efficiency remains constant with DT (at least up to DT=60).
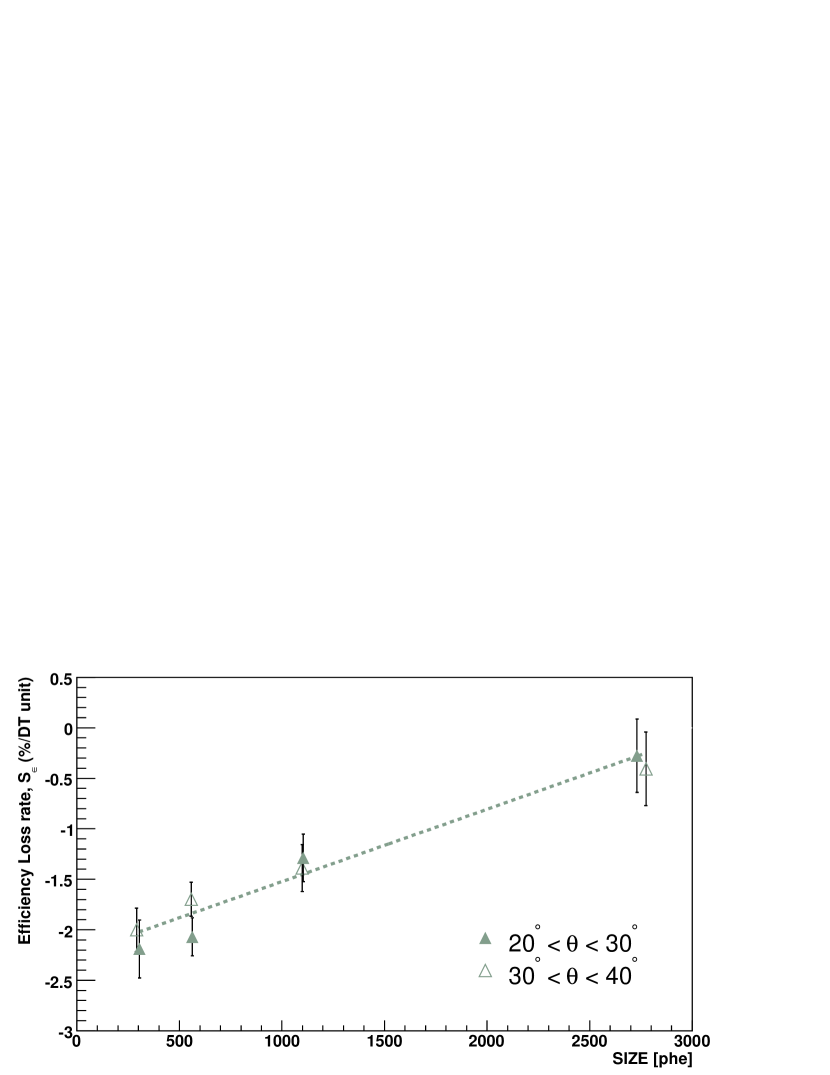
We observe no significant differences in the -ray detection efficiency between medium and low zenith angles, that is, the effect of the Moon does not depend on the zenith angle of the considered source. Figure 11 shows as a function of SIZE. The x-values of the shown data are the peak of the SIZE distribution for the different considered bins, obtained from MC simulated -ray events based on a Crab-like power-law spectrum and nominal DT. Up to SIZE=3000 phe we find a linear dependence that can be parameterized by:
| (5) |
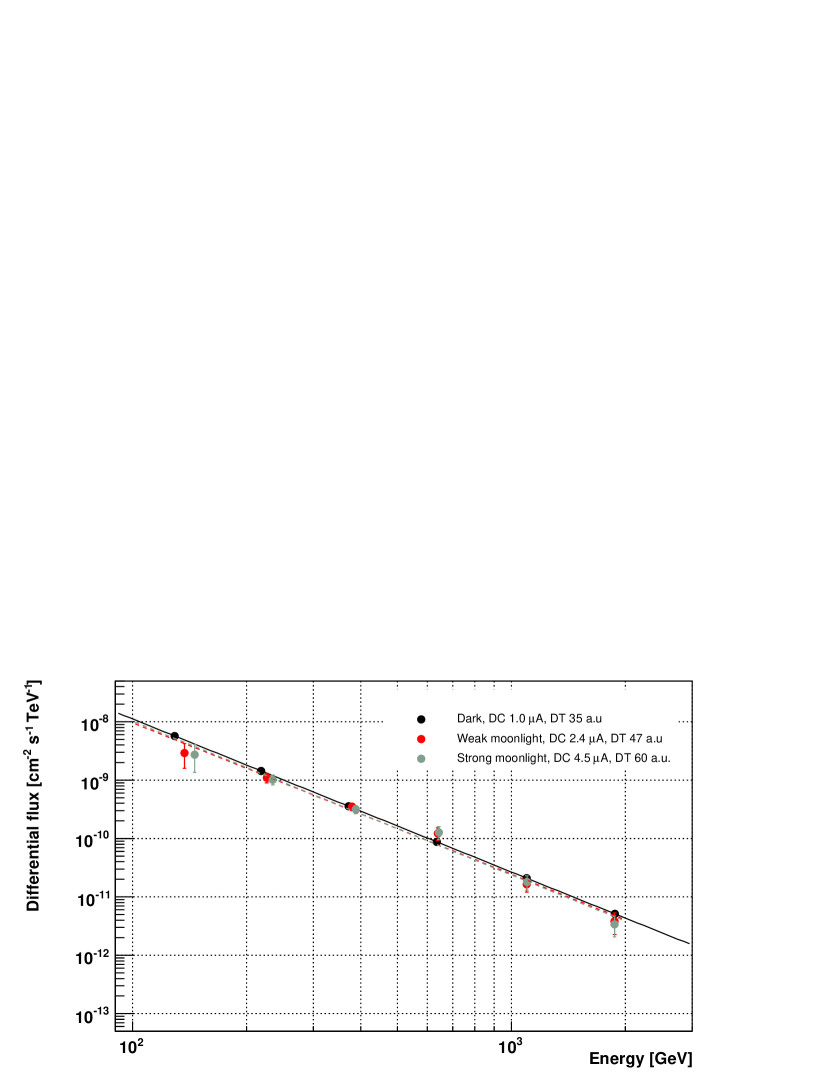
The quoted errors are obtained from the fit, and include the correlation between the two free parameters. This is a very useful result since, together with Equation 1, it allows one to compute the -ray detection efficiency loss for any SIZE and DT (i.e. for all tested moonlight conditions), and hence to correct the -ray fluxes during the off-line analysis, with no need of generating different MC samples for the different moonlight conditions. The results are rather independent of the zenith angle, at least for values below 40∘. Figure 12 shows the measured energy spectra for the Crab nebula from observations under weak and strong moonlight after applying the SIZE-DT dependent correction factors computed from Equations 1 and 5. The fit of a power-law ( 10-10 cm-1 s-1 TeV-1) yields , for weak camera illumination, and , for strong camera illumination. These values are statistically compatible with those obtained for dark observations (, ) sensi .
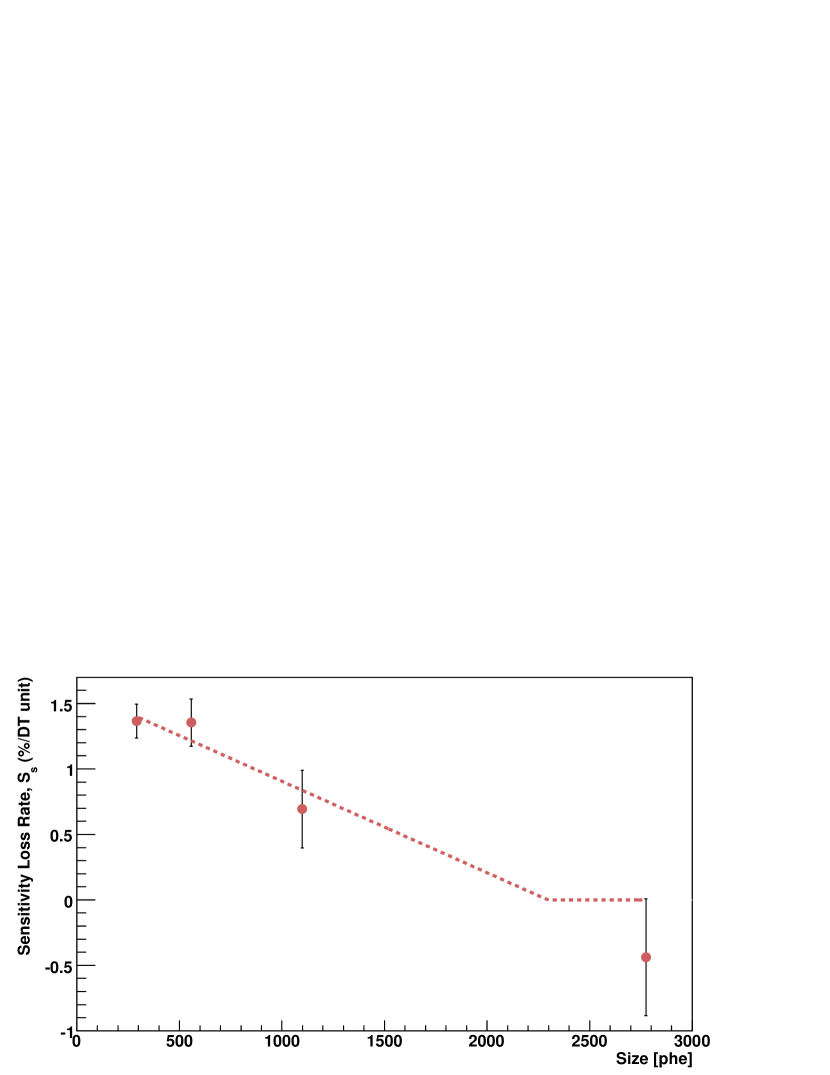
A similar analysis has been carried out to evaluate the differential sensitivity loss as a function of energy, i.e. as a function of SIZE. Figure 10 shows the sensitivity loss rate as a function of DT for the four aforementioned SIZE bins. For lower SIZE the sensitivity degrades with increasing DT reaching a maximum relative value of 50, while for larger SIZE it remains roughly constant with increasing DT. The sensitivity loss rate as a function of SIZE is shown in Figure 13. A linear fit to the data yields:
| (6) |
We tested the dependences quoted in Equations 5 and 6 under different HADRONNESS and ALPHA cuts, obtaining in all cases similar results in the efficiency and sensitivity loss rate within the statistical and systematic uncertainties.
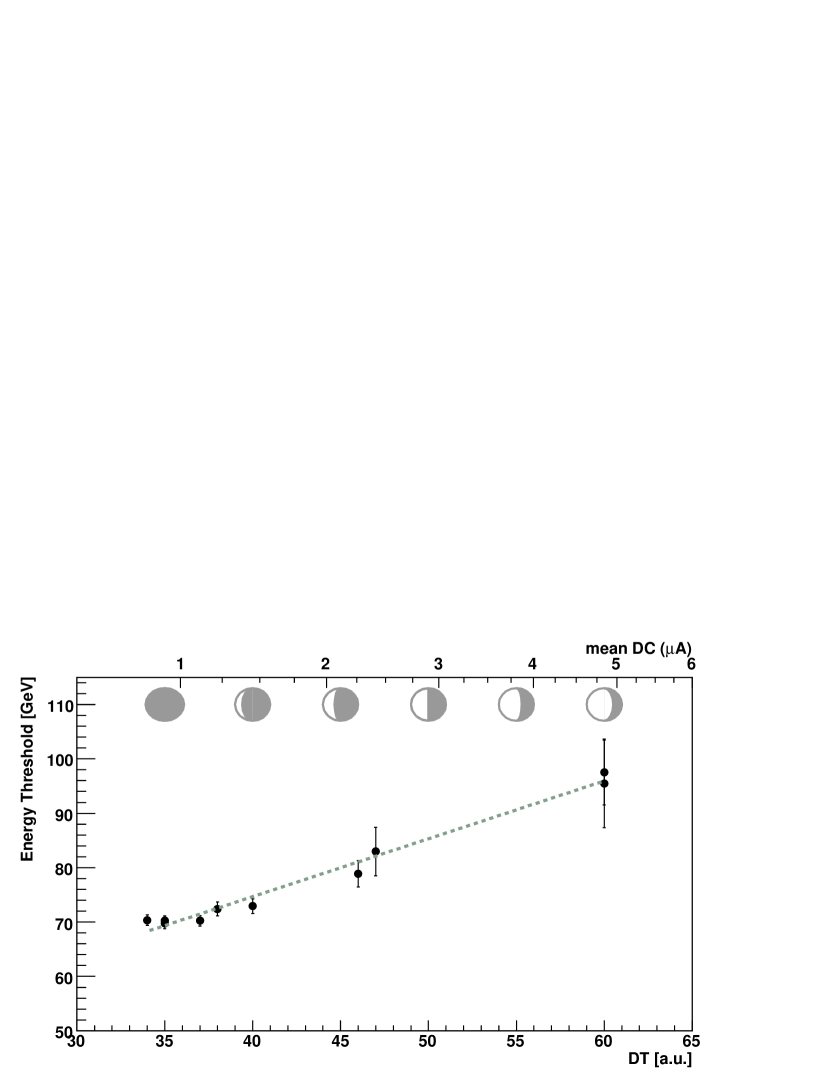
Finally, it is important to understand the influence of the moonlight on the energy threshold. We define the energy threshold as the peak of the energy distribution of all events after image cleaning and before analysis cuts. The energy is estimated assuming the correspondence SIZE/energy obtained from a MC simulated -ray sample (zenith angle ). The dependence of the energy threshold is well described by the following linear function (see Figure 14):
| (7) |
where the errors quoted are obtained from the fit and include the correlation between the two free parameters. From the above expression, the energy threshold increases GeV per DT unit. An increase of the threshold from to GeV at a mean zenith angle of 25∘ is observed at the maximally allowed camera illumination. This increase is relatively marginal, and it has to be noted again that it is due to the increase of the DTs, and hence only indirectly to the increase in the camera illumination.
6 Conclusions
The camera of the MAGIC telescope was designed to run under moderate moonlight or twilight by means of a reduced gain of the PMT dynode amplification system. MAGIC PMTs have been shown to operate under illumination up to thirty-five times stronger than the dark sky with no substantial degradation of their performance. The telescope has routinely operated in moonlight and twilight conditions for the past two years.
We have characterized MAGIC’s response in observations under moderate moonlight or twilight, using Crab nebula observations. The DTs were increased to keep the rate of accidental triggers produced by the moonlight roughly constant. We have found that, under such experimental conditions, we can characterize the performance of the telescope in terms of the selected DT value. In comparison, the noise induced by the moonlight itself has been shown to contribute in a negligible way. The distributions of the Hillas variables –and hence the -hadron separation power– are in good agreement. This makes the data taken under moonlight very simple to analyze, since no special treatment is required at the calibration, image cleaning and /hadron separation stages. Another important consequence is that, with a DAQ system capable of handling a much higher rate, no changes on the DTs are required, and the images produced by Cherenkov showers would still be basically of the same quality compared to those recorded during dark nights. During MAGIC operation, the DTs are set to a minimum value ensuring both, a low rate of accidental trigger events, and a minimal decrease of the collection area. Our results suggest that this is a somewhat conservative approach, and that the only real limitation is given by the intrinsic maximum rate of the DAQ system. The possibility of changing the second level of trigger (e.g. to a five neighboring pixels configuration) to reject the accidental events without increasing the DTs is left for a future study.
The increase in the DT produces a marginal increase of the telescope’s energy threshold, even for the most intense illuminations tested in this study. On the other hand, we have found important effects in the collection area in a wide range of energies, attributable to the increase of the DTs and a relatively small trigger area, that have been parameterized in terms of losses in the -ray detection efficiency. The sensitivity is comparatively less affected, due to the fact that hadrons also suffer from the same detection efficiency losses. The loss of sensitivity that we measure is compatible with zero at high energies, while for low energy/SIZE values the effect becomes important. The -ray detection efficiency decreases linearly with increasing DT levels and decreasing SIZE. Such dependences have been fully characterized using observations of the Crab nebula. When analyzing MAGIC’s moonlight or twilight data, the only concern is to correct the number of -ray events in a spectrum or light curve by the efficiency corresponding to the given DT and SIZE values, with no need of special MC simulations for the large (in principle, infinite) variety of moonlight conditions. It is also shown that these results are valid independent of particular analysis cuts, provided they are based on the Hillas image parameterization. The results are also independent of the zenith angle of the observation, at least up to 40∘.
MAGIC now performs regular observations under moderate moonlight during cycle II (May 2006-April 2007), so far with a cumulated time of h taken so far (Feb. 2007), representing of the total observation time during the same period. Some of these observations include the first unidentified TeV source TeV J2032+40 SNRs , SNRs such as Cassiopeia A, and variable sources such as the binary system LSI +61 303 LSI and AGNs like Mkn 501 and Mkn 421. Apart from the obvious gain in terms of duty cycle, the possibility to extend the observations also in the presence of the Moon has an important relevance in the study of variable sources. The increase of the observation window also allows a better overlap with other astronomical instruments when participating in multi-wavelength campaigns, and hence in the understanding of the physical processes governing the entire electromagnetic emission of variable sources. In particular, observations under moonlight have been of crucial importance in the study of the near AGN Mkn 501 with MAGIC, that has unveiled variability over exceptionally short time scales Mkn501 , or in the determination by MAGIC of the periodic nature of LSI +61 303 at VHE. Last but not least, an enlargement of the observation window increases the probability of detecting Gamma Ray Bursts GRB at VHE by MAGIC.
7 Acknowledgments
We would like to thank the IAC for the excellent working conditions at the Observatorio del Roque de los Muchachos in La Palma. The support of the German BMBF and MPG, the Italian INFN and the Spanish CICYT is gratefully acknowledged. This work was also supported by ETH Research Grant TH 34/04 3 and the Polish MNiI Grant 1P03D01028.
References
- (1) Lorenz, E., New Astron. Rev. (2004) 48, 339.
- (2) Cortina, J. et al., (MAGIC Collaboration), AIP Conf. Proc. (2005) 745, 730.
- (3) Paneque, D. et al., Nucl. Instrum. Meth. (2004) 518, 619.
- (4) Pare, E. et al, 22nd ICRC, Dublin, Ireland (1991) 1, 492.
- (5) Chantell, M. et al, 24th ICRC, Rome, Italy (1995) 2, 544.
- (6) Kranich, K. et al, Astrop. Phys. (1999) 12, 65.
- (7) Ostankov. A et al., Nucl. Instrum. Meth. A (2000) 442, 117.
-
(8)
Armada, A. “Characterization and some applications
of the anode current monitoring system of the MAGIC
telescope”. Master thesis, 2005.
Available at: http://wwwmagic.mppmu.mpg.de/publications/theses/ - (9) Mirzoyan, R. and Lorenz, E. Internal Report of the HEGRA collaboration. MPIPhE94-35 (1994).
- (10) Paoletti, R. et al., accepted for publication in IEEE Transactions on Nuclear Science (TNS), (2007).
- (11) Gaug, M. et al. Proc. of the 29th ICRC, Pune, India (2005) 5, 475.
- (12) Albert, J. et al., (MAGIC Collaboration), “Signal Reconstruction for the MAGIC Telescope”, astro-ph/0612385, submitted to NIMA.
- (13) Hillas, A.M. Proc. of 19th ICRC, La Joya (1985) 3, 445.
- (14) Bock, R. K. et al. Nucl. Instrum. Meth. (2004) A516, 188.
- (15) Breiman, L. Machine Learning (2001) 45, 5.
- (16) Majumdar, P. et al. Proc. of the 29th ICRC, Pune, India (2005) 5, 203.
- (17) Wagner, R. M. et al. Proc. of the 29th ICRC, Pune, India (2005) 4, 163.
- (18) Albert, J. et al., (MAGIC Collaboration), “Observations of the First Unidentified TeV -ray source (TeV J2032+4130) with the MAGIC telescope”, in preparation.
- (19) Albert, J. et al., (MAGIC Collaboration), Science (2006) 312, 1771.
- (20) Albert, J. et al., (MAGIC Collaboration), “MAGIC observations of the variable VHE -ray emission of Mkn 501”, astro-ph/0702008, submitted to ApJ.
- (21) Albert, J. et al., (MAGIC Collaboration), Astrophys. J. (2006) 641, L9.
| Zenith angle | 2030∘ | 3040∘ |
|---|---|---|
| Observation time (min) | 488 | 297 |
| Mean DC range (A) | 1.0 - 4.5 | 1.0 - 5.2 |
| Mean DT range | 35 - 60 | 35 - 66 |