Dynamical Evolution of Globular Cluster Systems formed in
Galaxy Mergers:
Deep HST/ACS Imaging of Old and Intermediate-Age Globular
Clusters in NGC 361011affiliation: Based on observations with the NASA/ESA Hubble
Space Telescope, obtained at the Space Telescope Science
Institute, which is operated by AURA, Inc., under NASA contract
NAS5–26555.
Abstract
The Advanced Camera for Surveys on board the Hubble Space Telescope has been used to obtain deep high-resolution images of the giant elliptical galaxy NGC 3610, a well-established remnant of a dissipative galaxy merger. These observations supersede previous, shallower observations which revealed the presence of a population of metal-rich globular clusters of intermediate age ( 1.5 – 4 Gyr). We detect a total of 580 cluster candidates, 46% more than from the previous WFPC2 images. The new photometry strengthens the significance of the previously found bimodality of the color distribution of clusters. Peak colors in are 0.93 0.01 and 1.09 0.01 for the blue and red subpopulations, respectively. The luminosity function of the inner 50% of the metal-rich (‘red’) population of clusters differs markedly from that of the outer 50%. In particular, the luminosity function of the inner 50% of the red clusters shows a flattening consistent with a turnover that is about 1.0 mag fainter than the turnover of the blue clusters. This is consistent with predictions of recent models of cluster disruption for the age range mentioned above and for metallicities that are consistent with the peak color of the red clusters as predicted by population synthesis models. The radial surface density profile of red clusters follows that of the underlying galaxy light more closely than in ‘normal’ elliptical galaxies, which is consistent with the intermediate-age nature of the red clusters. We determine the specific frequency of clusters in NGC 3610 and find a present-day value of . Using published age estimates for the diffuse light of NGC 3610 as well as cluster disruption models, we estimate that this value will increase to at an age of 10 Gyr, which is consistent with typical values for ‘normal’ elliptical galaxies. Our findings constitute further evidence in support of the notion that metal-rich cluster populations formed during major mergers involving gas-rich galaxies can evolve dynamically (through disruption processes) into the red, metal-rich cluster populations that are ubiquitous in ‘normal’ giant ellipticals.
Subject headings:
galaxies: star clusters — galaxies: elliptical and lenticular, cD — galaxies: individual (NGC 3610) — galaxies: interactions1. Introduction
Recent deep imaging studies of ‘normal’ giant elliptical galaxies with the Hubble Space Telescope (HST) and large, ground-based telescopes have shown that these galaxies usually contain rich globular cluster (GC) systems with bimodal color distributions (e.g., Zepf & Ashman, 1993; Kundu & Whitmore, 2001; Larsen et al., 2001; Peng et al., 2006). Typically, roughly half of the GCs are blue, and half red. Follow-up spectroscopy with 8-m class telescopes has revealed that both ‘blue’ and ‘red’ GC subpopulations are typically old ( 8 Gyr, Forbes et al., 2001; Cohen, Blakeslee, & Côté, 2003; Puzia et al., 2005) implying that the bimodality is mainly due to differences in metallicity. The colors of the ‘blue’ GCs are usually similar to those of metal-poor halo GCs in the Milky Way and M31, while the mean colors of the ‘red’ GCs are similar to those of the diffuse light of their host galaxies (e.g., Geisler, Lee, & Kim, 1996; Forbes, Brodie, & Grillmair, 1997). Hence, the nature of the ‘red’, metal-rich GCs is likely to hold important clues to the star formation history of their host galaxies.
One environment known to produce metal-rich GCs and bimodal color distributions is that of vigorous starbursts induced by mergers of gas-rich galaxies. Massive young GCs have been commonly found in mergers and young merger remnants using HST observations (e.g., Holtzman et al., 1992; Schweizer, 2002, and references therein). Follow-up spectroscopy has confirmed the ages (and in three cases even the high masses, Maraston et al., 2004; Bastian et al., 2006) of these young clusters predicted from their colors and luminosities (e.g., Schweizer & Seitzer, 1998). Their metallicities tend to be near solar, as expected for clusters formed out of enriched gas in spiral disks. A natural interpretation of these data is that the metal-rich GCs in ‘normal’, old giant ellipticals formed in gas-rich mergers at , and that the formation process of giant ellipticals with significant populations of metal-rich GCs was similar to that in galaxy mergers observed today e.g., Schweizer, 1987; Ashman & Zepf, 1992.
An often quoted hurdle for this ‘formation by merger’ scenario has been the marked difference in the luminosity functions (hereafter LFs) of old vs. young GC systems (e.g., van den Bergh, 1995). The LFs of old GC systems of ‘normal’ galaxies are well fit by Gaussians peaking at mag with a dispersion of mag e.g., Whitmore, 1997, while young GC systems in mergers and young remnants have power-law LFs with indices of e.g., Whitmore et al., 1999. Intermediate-age merger remnants with ages of 1 – 5 Gyr are ideal probes for studying the long-term dynamical effects on GC systems formed during a major merger. Such galaxies are still identifiable as merger remnants through their morphological fine structure (e.g., Schweizer & Seitzer, 1992), yet they are old enough to ensure that substantial dynamical evolution of the globular clusters has already occurred. Recent calculations of dynamical evolution of GCs (including two-body relaxation, tidal shocking, and stellar mass loss) show that the least massive GCs are expected to disrupt first as galaxies age, which can gradually transform the initial power-law LFs into LFs with Gaussian-like peaks or turnovers (e.g., Vesperini, 1998; Baumgardt, 1998; Fall & Zhang, 2001; Vesperini & Zepf, 2003; Prieto & Gnedin, 2006).
Recent HST studies of candidate intermediate-age merger remnants have revealed that their ‘red’ GC subpopulations show LFs consistent with power laws (as expected if formed during a recent merger event; Goudfrooij et al., 2001b; Whitmore et al., 2002, hereafter W02). However, the combination of field of view and sensitivity of the HST instrumentation was not quite efficient enough to allow a detection of a turnover in the LFs until just a few years ago. The first empirical evidence for dynamical evolution of red GC LFs from a power law toward a Gaussian-like shape in an intermediate-age early-type galaxy was facilitated by the unprecedented sensitivity of the Advanced Camera for Surveys (ACS) aboard HST. Based on ACS observations, Goudfrooij et al. (2004) found that the outer half of the red GC system of the 3-Gyr-old merger remnant NGC 1316 still shows a power-law LF, whereas the inner half shows a LF with a turnover characteristic of old GC systems.
In an effort to test how common this result may be among nearby intermediate-age ellipticals, the current paper reports on new ACS imaging of NGC 3610. Several optical imaging studies have shown that NGC 3610 is a bona fide intermediate-age merger remnant. Its colors are anomalously blue for a giant elliptical galaxy of its luminosity (Schweizer & Seitzer, 1992; Goudfrooij et al., 1994a; Idiart, Michard, & de Freitas Pacheco, 2002), suggesting recent star formation activity. Its inner region features a small, strongly twisted inner disk (Scorza & Bender, 1990; Whitmore et al., 1997). Such disks are a natural byproduct of gas-rich galaxy mergers in simulations (Barnes, 2002). The galaxy’s outer envelope is extremely boxy relative to its inner body and shows several non-concentric plumes and tails (Seitzer & Schweizer, 1990) which are most likely remnants of tidal perturbations. In fact, NGC 3610 has the highest “fine structure index” (indicative of structures believed to be resulting from galactic mergers) of all 74 early-type galaxies in the sample of Schweizer & Seitzer (1992). Finally, its spheroid is well fit by a de Vaucouleurs’ profile and has a surprisingly small effective radius for the galaxy’s luminosity (13′′ or 2.1 kpc in the band, Burstein et al., 1987). Overall, these features are consistent with NGC 3610 being the product of a dissipative merger with incomplete dynamical relaxation.
In this paper we adopt a distance of 33.9 Mpc for NGC 3610, corresponding to a distance modulus of mag as measured from surface brightness fluctuations (Tonry et al., 2001). The Galactic foreground reddening towards NGC 3610 is = 0.00 and 0.03 according to Burstein & Heiles (1984) and Schlegel et al. (1998), respectively. In accordance with most literature on photometry of NGC 3610 (e.g., Goudfrooij et al., 1994a; Whitmore et al., 1997, 2002; Michard, 2005), we adopt the Burstein & Heiles (1984) value in this paper. We do not make any corrections for reddening internal to NGC 3610, given the absence of any patchy absorption or color changes in optical images of NGC 3610 (Goudfrooij et al., 1994b; Whitmore et al., 1997) and the non-detection of far-infrared emission (Knapp et al., 1989).
2. Observations
NGC 3610 was observed with HST on June 29th, 2003, using the wide-field channel (WFC) of ACS and the F435W, F555W, and F814W filters, with total exposure times of 1080 s, 6410 s, and 6060 s, respectively. The F555W and F814W exposure times were chosen to reach a similar depth for an object of = 1.0, the mean color of globular cluster systems of giant elliptical galaxies (e.g., Kundu & Whitmore, 2001; Larsen et al., 2001). The F435W exposures were mainly included to provide a large color baseline to allow accurate age/metallicity measurements for the bright GCs, which does not require reaching very faint levels. Hence, the F435W exposures were relatively short and taken at only two positions (“dithers”) offset from each other by 3.5 columns of the WFC CCD. In contrast, the final F555W and F814W images were constructed from long (19 – 26 min) exposures taken at 5 dither positions, supplemented by one short exposure taken in each filter to avoid saturation of the bright central regions. The individual images in each band were combined using the task multidrizzle within PyRAF/stsdas v3.3, with task parameters set to pixfrac = 0.8 and scale = 1.0. Saturated pixels in the long exposures were replaced by those in the short exposures while running multidrizzle by setting the appropriate data quality flag in the affected pixels of the long exposures. The gain in sensitivity, spatial resolution, and spatial coverage of the new ACS images relative to the available WFPC2 images allowed us to detect roughly 50% more GC candidates than the WFPC2 images used in W02 did.
3. Cluster Selection and Photometry
3.1. Cluster Selection
Prior to performing source selection and photometry, the strongly varying light distribution of the galaxy was fitted and removed in order to minimize errors in the photometry due to any particular choice of object aperture and sky annulus (see below). Experimentation with various fitting methods revealed that any model fit to the galaxy surface brightness distribution is strongly hampered by the presence of a very prominent stellar disk in the central regions (e.g., Scorza & Bender, 1990; Goudfrooij et al., 1994a; Whitmore et al., 1997, 2002). Best results were achieved by approximating the diffuse light of the galaxy by applying a median filter with a 41 41 pixel2 kernel to the image.
The first step in the selection of candidate GC targets was the application of the daofind task from the daophot-ii package (Stetson, 1987) to an image prepared by dividing the sum of the F555W and F814W images (i.e., the image) by the square root of the corresponding median-filtered image (thus yielding uniform shot noise characteristics over the whole image). The detection threshold was set at 3 above the background. The region around the central stellar disk was masked out in this step. To allow the detection of candidate GCs in the region occupied by the stellar disk, daofind was applied again on the image divided by the square root of a median-filtered version of it, but this time using a much smaller kernel (7 7 pixel2). From this last run of daofind, we only included objects detected in the central area that was masked out in the first run into the final object list.
At this stage, a total of 1472 objects were detected. Task phot was then applied to obtain fixed-aperture photometry for all those objects in the median-subtracted , , , and images, employing several aperture radii. Due to the substantial structure in the median-filtered images in the innermost region, aperture photometry for the objects in the innermost region was obtained from the direct images, employing small apertures (radii for object/inner background/outer background were set at 2/3/5 pixels in this case; the photometry of these inner objects is shown with open symbols in Figure 4).
Since the object list at this point still includes Galactic foreground stars, background galaxies, and any residual cosmic rays and/or hot pixels in addition to the star clusters we are interested in studying, we devised an automated selection procedure based on two size-related parameters and the color. Quantitative size selection criteria were developed based on globular clusters known to be associated with NGC 3610 by means of radial velocities (Strader, Brodie, & Forbes, 2004), obvious bright foreground stars with visible diffraction spikes, and visual inspection of objects (especially near the extrema of the selection criteria). The first size parameter used is a ‘concentration index’, defined as the difference in F555W magnitudes measured using aperture radii of 2 and 5 pixels, hereafter denoted as F555W2-5. Visual inspection of the objects remaining after restricting F555W2-5 to the range 0.29 – 0.83 mag showed that many extended background galaxies, all obvious hot pixels, and some bright foreground stars were filtered out. However, this selection still left a substantial number of background galaxies in the target list. The second size parameter used for the classification is the FWHM of the radial profile of the object. Rather than assuming a specific model of the radial profile (e.g., Gaussian or Moffat), we used a more robust, direct measure of the FWHM by computing the radial derivative of the azimuthally averaged enclosed flux profile :
where is the radial profile of intensity per unit area. The peak of is found and the FWHM is twice the radius of the profile at half the peak value. As illustrated in Figure 1, we selected objects with mag and in this step.
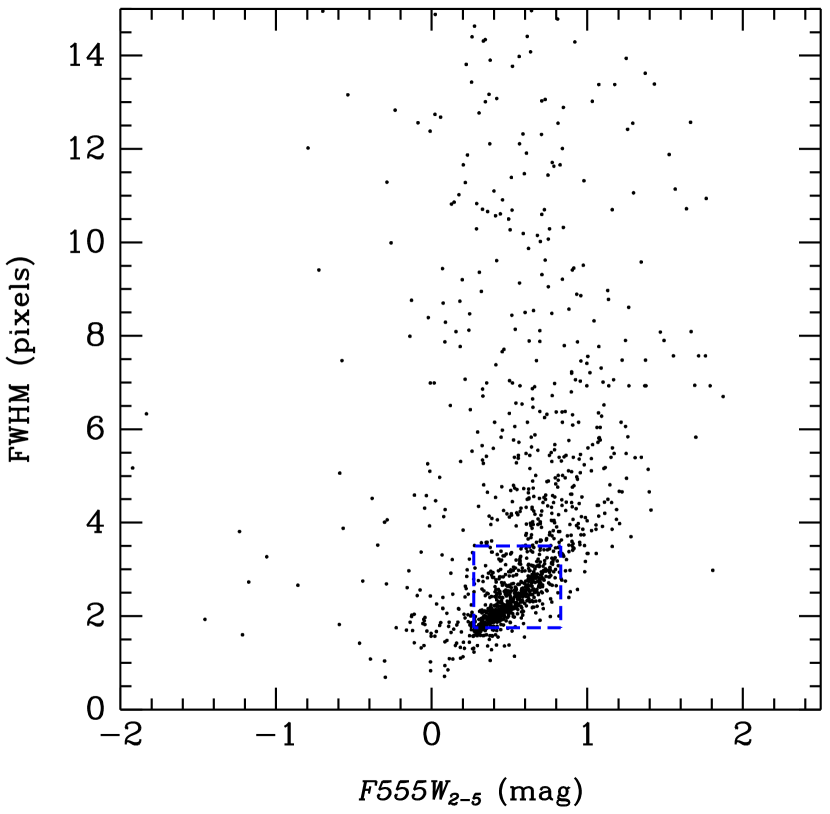
At the distance of NGC 3610, typical GCs are only marginally resolved at the resolution of the drizzled ACS images. This makes it somewhat difficult to distinguish foreground stars from GC candidates based on size parameters alone, especially at faint magnitudes where the absence of diffraction spikes hampers the visual identification of objects as foreground stars. Hence we use the color as another discriminant between stars and GC candidates by applying a color selection cut of . This interval constitutes the full range in expected for GCs older than 1 Gyr and according to the simple stellar population (SSP) models of Bruzual & Charlot (2003) and Maraston (2005), plus 0.2 mag of padding on the blue and red ends to allow for reasonable photometric errors. These concentration, size, and color cuts yielded a list of 580 GC candidates. Any further contamination of this list by foreground stars and compact background galaxies will be addressed by statistical subtraction (see below).
3.2. Photometry
Aperture corrections were mag in F435W , in F555W and mag in F814W for an aperture radius of 3 WFC pixels (i.e., 015). These values were determined through measurements of several isolated, well-detected GC candidates located throughout the field. These GC candidates spanned the range of size parameters mentioned in the previous section. We considered correcting for the effect of imperfect charge transfer efficiency (CTE). However, the effect was found to be negligible ( 0.01 mag) according to the formulae of Riess & Mack (2004), even at the corners of the F435W image which have the lowest background level by far ( 30 e-/pixel). A correction for CTE loss was therefore not applied. In order to facilitate comparisons of our photometry with predictions of various SSP models, we transformed the instrumental magnitudes to Johnson/Cousins , and using the calibrations derived by the ACS Instrument Definition Team (Sirianni et al., 2005). Photometry and astrometry for the 50 brightest GC candidates in the ACS frames are listed in Table 1.
| Object | W02 | RA | DEC | Radius | |||
|---|---|---|---|---|---|---|---|
| ID | ID | (mag) | (mag) | (mag) | (arcsec) | (arcsec) | (arcsec) |
| G1 | 2 | 21.530 0.498 | 1.095 0.784 | 1.971 0.804 | 0.31 | 1.23 | 1.30 |
| G2 | 3 | 21.548 0.007 | 1.062 0.010 | 1.894 0.015 | 21.35 | 5.07 | 22.21 |
| G3 | — | 21.567 0.007 | 1.047 0.010 | 1.822 0.015 | 39.73 | 38.77 | 56.18 |
| G4 | 6 | 21.659 0.007 | 1.054 0.010 | 1.835 0.015 | 21.86 | 5.88 | 22.90 |
| G5 | 5 | 21.668 0.054 | 1.068 0.056 | 1.867 0.057 | 4.93 | 2.14 | 5.45 |
| G6 | 16 | 21.872 0.323 | 1.191 0.561 | 1.910 0.536 | 0.20 | 1.92 | 1.96 |
| G7 | 14 | 21.887 0.312 | 1.040 0.561 | 2.169 0.708 | 1.90 | 0.00 | 1.91 |
| G8 | — | 21.894 0.008 | 0.931 0.011 | 1.270 0.015 | 59.39 | 0.13 | 60.11 |
| G9 | 9 | 21.955 0.008 | 1.066 0.011 | 1.876 0.018 | 67.05 | 17.14 | 70.04 |
| G10 | 11 | 21.983 0.008 | 1.125 0.012 | 2.007 0.021 | 10.97 | 8.23 | 13.89 |
| G11 | 12 | 22.011 0.008 | 0.950 0.012 | 1.654 0.018 | 5.93 | 15.78 | 17.06 |
| G12 | 15 | 22.038 0.423 | 1.076 0.757 | 1.920 0.765 | 1.62 | 0.37 | 1.68 |
| G13 | 10 | 22.046 0.008 | 0.893 0.012 | 1.522 0.018 | 60.15 | 55.51 | 82.83 |
| G14 | 17 | 22.076 0.009 | 1.031 0.012 | 1.808 0.019 | 16.57 | 15.51 | 22.97 |
| G15 | 7 | 22.082 0.009 | 1.105 0.012 | 1.920 0.021 | 17.42 | 3.81 | 18.04 |
| G16 | 13 | 22.115 0.011 | 1.122 0.014 | 1.936 0.023 | 3.84 | 5.55 | 6.83 |
| G17 | 18 | 22.433 0.011 | 1.143 0.014 | 1.980 0.025 | 7.40 | 3.21 | 8.15 |
| G18 | 20 | 22.463 0.010 | 0.934 0.014 | 1.607 0.022 | 32.92 | 37.30 | 50.35 |
| G19 | 19 | 22.569 0.061 | 1.239 0.056 | 2.079 0.061 | 5.29 | 0.84 | 5.41 |
| G20 | 22 | 22.597 0.011 | 0.896 0.015 | 1.583 0.024 | 54.59 | 55.51 | 78.79 |
| G21 | 24 | 22.598 0.244 | 1.131 0.320 | 2.852 0.691 | 0.43 | 3.01 | 3.08 |
| G22 | 25 | 22.615 0.011 | 0.913 0.015 | 1.569 0.024 | 47.25 | 50.24 | 69.79 |
| G23 | 26 | 22.662 0.013 | 1.059 0.017 | 1.913 0.029 | 9.11 | 3.69 | 9.96 |
| G24 | 23 | 22.685 0.013 | 1.091 0.017 | 1.872 0.027 | 0.23 | 8.39 | 8.49 |
| G25 | 27 | 22.801 0.380 | 1.196 0.509 | 1.982 0.479 | 3.38 | 2.71 | 4.37 |
| G26 | 28 | 22.836 0.013 | 0.984 0.017 | 1.783 0.028 | 3.82 | 77.72 | 78.76 |
| G27 | — | 22.852 0.013 | 1.133 0.017 | 2.011 0.029 | 56.78 | 32.04 | 65.98 |
| G28 | — | 22.882 0.013 | 0.910 0.017 | 1.555 0.027 | 51.21 | 62.83 | 82.03 |
| G29 | — | 22.938 0.013 | 1.047 0.017 | 1.806 0.029 | 36.19 | 6.62 | 37.24 |
| G30 | 31 | 23.070 0.014 | 1.059 0.019 | 1.879 0.032 | 9.71 | 41.71 | 43.35 |
| G31 | 32 | 23.094 0.014 | 1.053 0.019 | 1.801 0.031 | 58.58 | 67.12 | 90.15 |
| G32 | 30 | 23.120 0.015 | 1.018 0.021 | 1.759 0.033 | 37.40 | 17.47 | 41.76 |
| G33 | — | 23.166 0.015 | 1.111 0.020 | 1.978 0.035 | 14.36 | 96.98 | 99.23 |
| G34 | 33 | 23.175 0.015 | 1.072 0.019 | 1.853 0.033 | 3.75 | 28.17 | 28.77 |
| G35 | 34 | 23.197 0.017 | 1.071 0.021 | 1.863 0.036 | 10.59 | 12.36 | 16.48 |
| G36 | 35 | 23.340 0.017 | 1.121 0.022 | 1.923 0.037 | 2.44 | 18.53 | 18.91 |
| G37 | 37 | 23.347 0.021 | 1.101 0.025 | 1.951 0.044 | 0.02 | 8.52 | 8.61 |
| G38 | 38 | 23.384 0.020 | 0.977 0.027 | 1.650 0.042 | 0.54 | 8.78 | 8.90 |
| G39 | 39 | 23.391 0.333 | 1.372 0.366 | 2.168 0.371 | 2.57 | 4.28 | 5.06 |
| G40 | 36 | 23.403 0.018 | 1.153 0.024 | 2.057 0.043 | 9.68 | 18.34 | 20.99 |
| G41 | — | 23.429 0.017 | 0.954 0.023 | 1.688 0.037 | 53.47 | 66.51 | 86.38 |
| G42 | — | 23.516 0.018 | 0.890 0.023 | 1.547 0.037 | 39.71 | 23.19 | 46.55 |
| G43 | 41 | 23.550 0.018 | 0.925 0.023 | 1.591 0.038 | 8.43 | 72.84 | 74.21 |
| G44 | 43 | 23.560 0.019 | 1.166 0.024 | 2.009 0.043 | 12.33 | 10.03 | 16.08 |
| G45 | — | 23.597 0.019 | 1.114 0.024 | 1.936 0.041 | 27.75 | 43.83 | 52.51 |
| G46 | 40 | 23.598 0.019 | 1.106 0.025 | 1.913 0.043 | 13.11 | 59.10 | 61.26 |
| G47 | 49 | 23.599 0.019 | 1.119 0.023 | 1.918 0.039 | 48.15 | 29.76 | 57.26 |
| G48 | 42 | 23.636 0.019 | 1.057 0.026 | 1.909 0.047 | 3.30 | 31.04 | 31.58 |
| G49 | 45 | 23.640 0.020 | 1.064 0.026 | 1.927 0.048 | 4.92 | 20.53 | 21.37 |
| G50 | 44 | 23.697 0.020 | 1.126 0.026 | 1.989 0.046 | 30.48 | 1.42 | 30.89 |
Considering the sky coverage common to this study and that of W02, a comparison of the photometry in Table 1 with that of the brightest 50 GC candidates in the WFPC2 data of W02 (i.e., their Table 1) shows a weighted mean difference (in the sense “our minus W02”) in magnitudes of 0.01 with an rms scatter of 0.12 mag. (The weighting was done by means of the inverse variance.) The difference in weighted mean colors is 0.02 with a rms scatter of 0.11 mag. This comparison excludes objects # 1, 4, and 8 of W02, which are all located within the central disk of NGC 3610. A careful check of the ACS images does not show any evidence for the presence of objects on top of the bright disk light at these locations.
Completeness corrections were performed using the image, i.e., the one used to determine the initial list of GC candidates, using routines in the daophot package. We added artificial objects (in batches of 100) with a radial intensity profile derived from a fit to real GC candidates in the frame to the image, for five different background levels and several magnitude intervals. The color of the objects was set equal to the median color of GC candidates. Prior to running daofind to determine the fraction of retrieved artificial objects, the image was divided by the square root of its median-filtered version, as was done during the initial object finding procedure. Artificial objects retrieved by daofind were also subjected to the size selection criteria mentioned above using the median-filter-subtracted image before including them in the object counts111To reflect the different method of object photometry in the innermost regions (see Section 3.1), the photometry of the artificial objects at the highest background level was done on the direct image instead of the median-filter-subtracted image.. Figure 2 shows the resulting completeness functions.

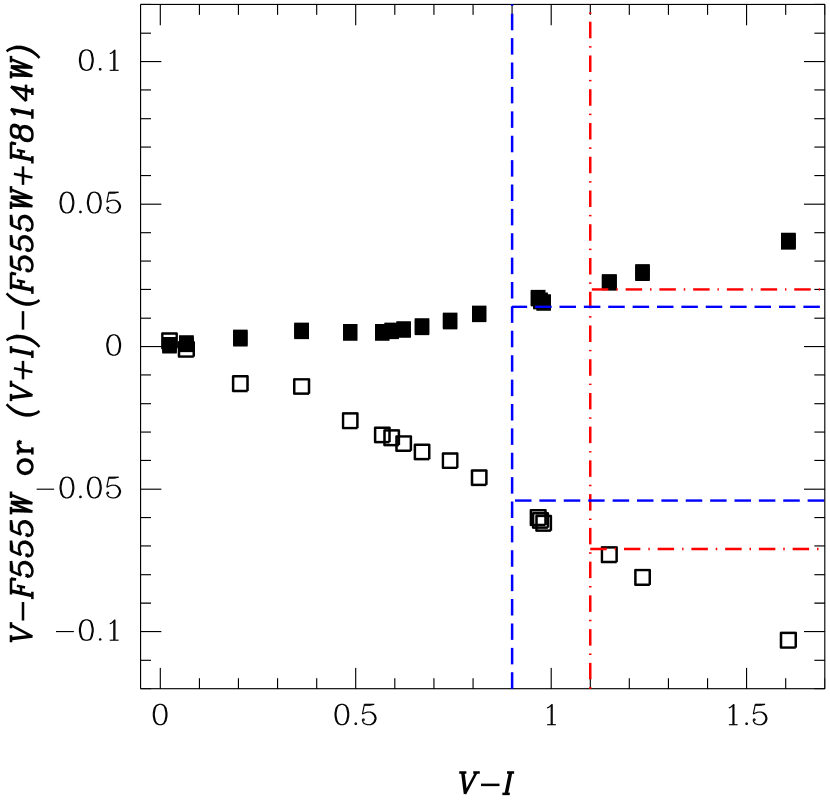
The two main reasons for using the image to determine the initial source list and completeness corrections (rather than the or image, which is often done) are (i) the greater depth reached by the image, and (ii) the fact that the transformation from instrumental magnitudes to Johnson/Cousins is significantly less dependent on source color than the transformations to either or , which helps during the completeness correction. The latter point is illustrated in Figure 3 which shows the dependence of the photometric zeropoints for and on the color. The zeropoints were derived using the synphot package within iraf/stsdas. Synthetic spectra of stellar types ranging from F2V to M0III from the Bruzual & Charlot (1993) library were convolved with Johnson/Cousins and filter passbands to yield Vega-based magnitudes, and with the ACS/WFC F555W and F814W passbands to yield STMAG magnitudes. As Figure 3 shows, the dependence of the zeropoint on color is much smaller than that of the zeropoint. In the context of the two common subpopulations of clusters in giant ellipticals, which typically have 0.95 and 1.2 for the blue and red subpopulations, respectively, the difference in zeropoint is only 0.006 mag (vs. 0.016 mag for the zeropoint). Hence, the determination of completeness fractions using needs only be conducted for one object color222Note however that these advantages for using the summed image are only applicable if the individual and images are of similar depth for the median color of the objects of interest..
4. Properties of the Globular Cluster System
4.1. Color Distributions
The top panels of Figure 4 show the vs. and vs. color-magnitude diagrams (hereafter CMDs) for GC candidates in NGC 3610. For reference, the region occupied by old halo GCs in our Galaxy (taken from the database of Harris, 1996), when placed at the distance of NGC 3610, is indicated by dashed lines in both CMDs.
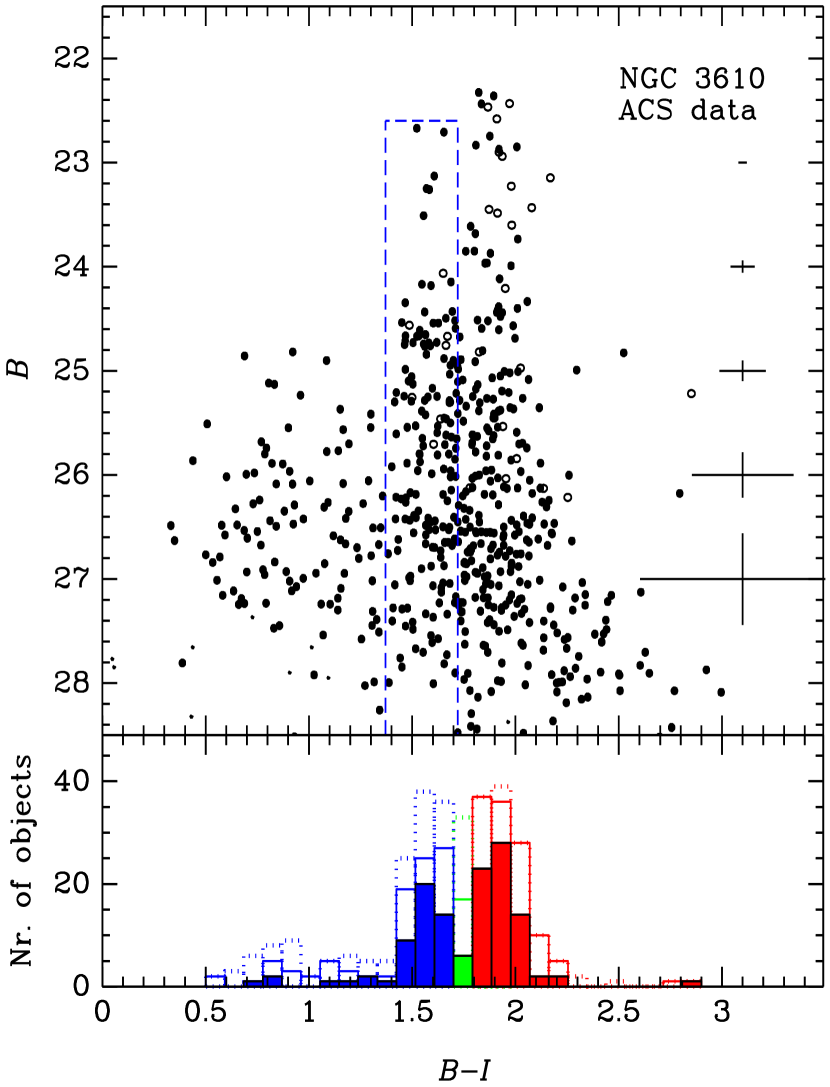
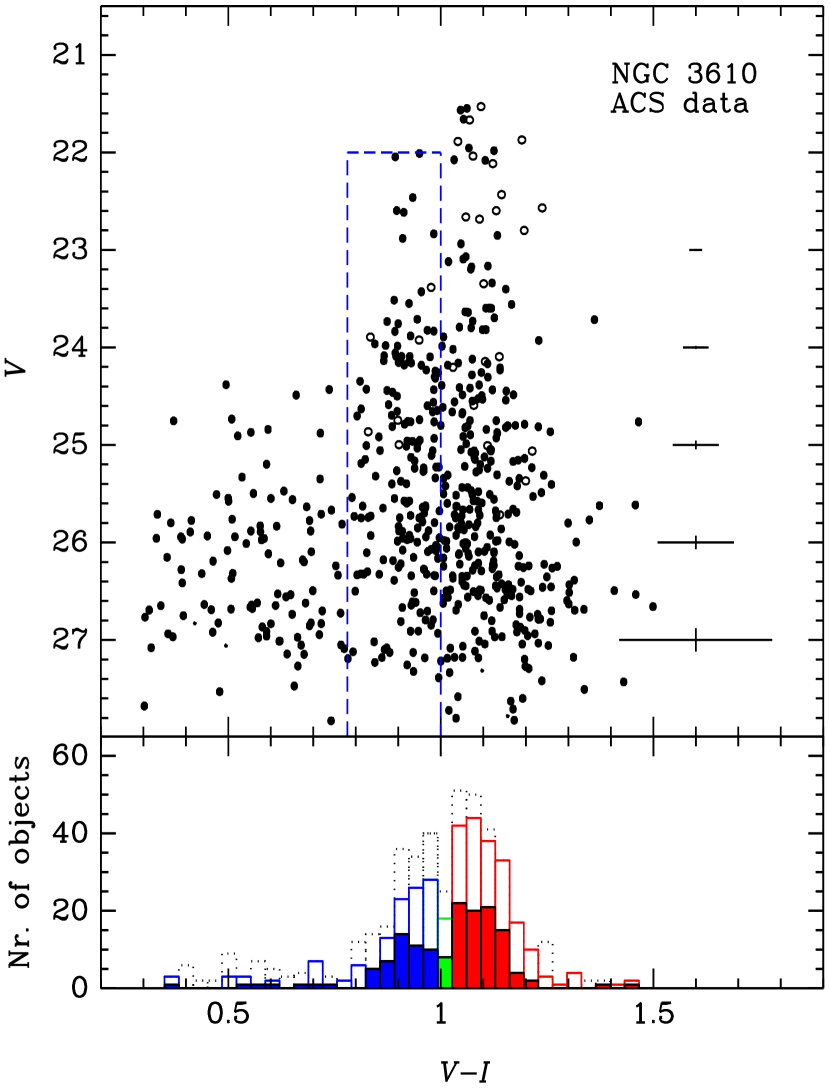
The CMDs show a color distribution of GC candidates that is clearly bimodal down to and where the typical color uncertainties are mag in and mag in . The ‘blue’ sub-population of GCs has colors and luminosities that are consistent with those of old halo GCs in our Galaxy, while the (larger) ‘red’ population has a mean color that is 0.4 mag redder than that of the ‘blue’ sub-population. The mean colors of each subpopulation seem constant throughout the sampled range of luminosities, taking the color uncertainties as a function of brightness into account. There is no obvious evidence for the ‘red slant’ effect seen among ‘blue’ GCs in brightest cluster ellipticals, i.e., the effect that the mean color of ‘blue’ GCs gets progressively redder (indicating a higher metallicity) with increasing GC luminosity (Harris et al., 2006; Strader et al., 2006). The vs. CMD looks quite similar to the corresponding diagram in W02 (i.e., their Figure 3), except that the color bimodality seems more obvious in the current CMD.
The and color distributions of the GC candidates are shown in the bottom panels of Figure 4, for two brightness cuts. Prior to plotting, the color histograms of candidate GCs were corrected for contamination by compact background objects. This correction was derived from the compact objects detected beyond a projected radius of 100′′ from the galaxy center. The color histogram of the outer compact objects was smoothed with a five-bin kernel to diminish small-number noise and scaled to the area of the full ACS image prior to subtraction from the color histogram of the full ACS image. The effect of this correction is shown in Figure 4. While the surface number density of GC candidates beyond 100′′ from the galaxy center seems to be close to an asymptotic background value (see Sect. 4.3 below), there may still be a (small) number of true halo GCs included in the number density estimate of compact background galaxies. Hence the correction for compact background galaxies may be slightly overestimated, and the true color distribution of GCs in NGC 3610 may lie slightly above (but most likely very close to) the solid lines in the bottom panels of Figure 4.
The unbiased probability of a bimodal color distribution (as opposed to a unimodal one) was estimated using the Kaye’s Mixture Model (KMM) test (McLachlan & Basford, 1988; Ashman, Bird, & Zepf, 1994), by comparing fits of one Gaussian vs. two Gaussians to the color distribution using the “expectation-maximization” (EM) method. To gain leverage in the presence of noisy data, we consider the homoscedastic case of the KMM test where the standard deviation is the same for both Gaussians. Using the KMM test on various artificial color distributions, we determine that a two-Gaussian fit is a better fit to the data than a one-Gaussian fit if the -value of the two-Gaussian fit is less than 0.05. We ran the KMM test on several subsets of the color distributions of GC candidates, using two magnitude limits and two upper limits of the projected galactocentric radius. Table 2 lists the results of the KMM tests. In all cases the distributions are judged to be bimodal at the 96 – 100% probability level. The mean colors of the blue peak are = and = , and those of the red peak are = and = .
| Magnitude | aaOuter galactocentric radius of GC sample under consideration. | NobsbbNumber of GCs in sample. | ccStandard deviation of Gaussian fit by KMM test. | ddFraction of red GCs in color distribution indicated by KMM test. | |||||
|---|---|---|---|---|---|---|---|---|---|
| Limit | (′′) | (mag) | (mag) | (mag) | (mag) | (mag) | value | ||
| 50 | 92 | 0.10 | 1.61 | 1.91 | 0.70 | 0.010 | |||
| 100 | 135 | 0.10 | 1.60 | 1.91 | 0.64 | 0.000 | |||
| 50 | 153 | 0.12 | 1.63 | 1.94 | 0.71 | 0.007 | |||
| 100 | 241 | 0.12 | 1.61 | 1.93 | 0.64 | 0.000 | |||
| 50 | 111 | 0.06 | 0.92 | 1.08 | 0.80 | 0.023 | |||
| 100 | 157 | 0.06 | 0.92 | 1.09 | 0.72 | 0.000 | |||
| 50 | 210 | 0.08 | 0.93 | 1.09 | 0.80 | 0.043 | |||
| 100 | 369 | 0.07 | 0.93 | 1.09 | 0.69 | 0.001 |
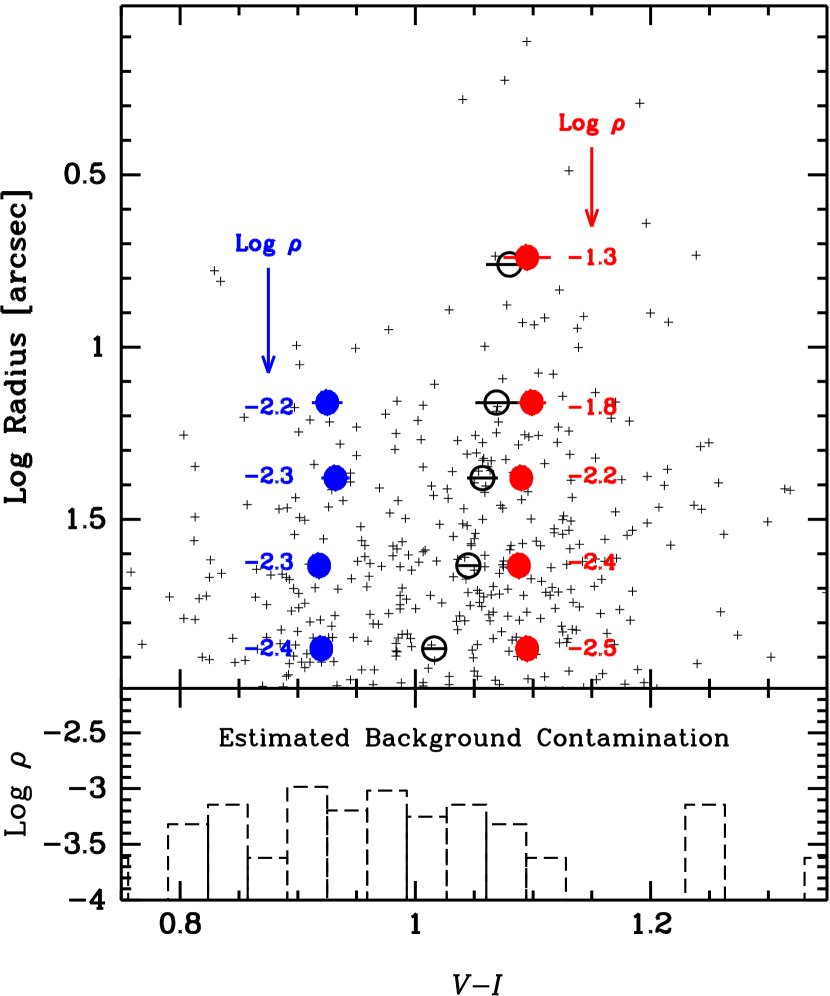
The dependence of the color distribution of GC candidates on galactocentric radius is illustrated in Figure 5, which shows color vs. projected galactocentric radius for all GC candidates with . In addition, Figure 5 shows average colors of GC candidates in bins of log (radius) for three samples: (i) all GC candidates, (ii) GC candidates in the ‘blue’ subpopulation (), and (iii) GC candidates in the ‘red’ subpopulation (). The average color of the full sample of GC candidates gets bluer with increasing projected radius, as found before for many ‘normal’ ellipticals (e.g., Ashman & Zepf, 1998, and references therein). Fig. 5 also shows that the average colors of the blue and red subpopulations stay constant with increasing radius (see Fig. 5), and that these results are not affected by contamination by compact background galaxies. Hence, the overall radial color gradient is due to a more centrally concentrated radial distribution of the red GCs with respect to their blue counterparts. This effect (which is quantified for NGC 3610 in Section 4.3 below) was predicted by the ‘formation by dissipative merger’ scenario of Ashman & Zepf (1992), and confirmed by recent studies of giant ellipticals hosting populous GC systems with bimodal color distributions (e.g., Geisler et al., 1996; Goudfrooij et al., 2001b; Sikkema et al., 2006).
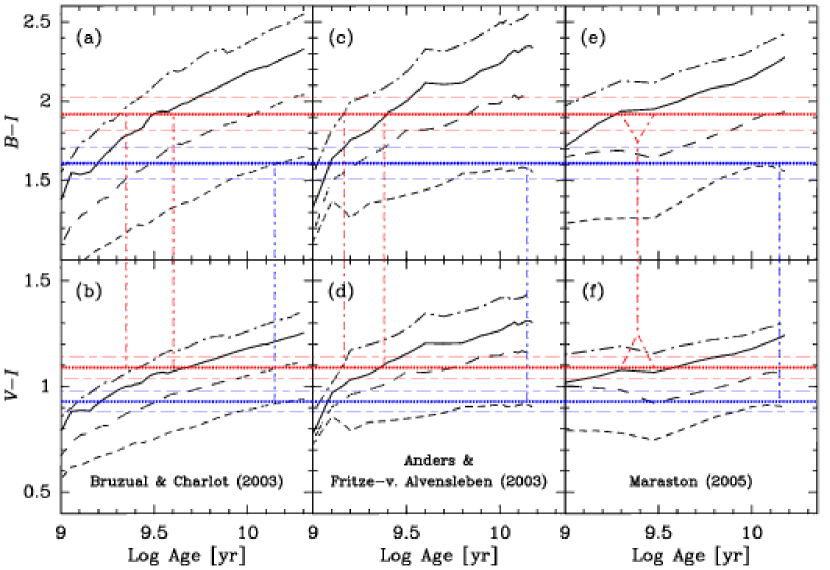
The peak colors of the blue and red subpopulations mentioned above are compared with popular SSP models in Figure 6. We considered the models of Anders & Fritze-v. Alvensleben (2003, using the Salpeter initial mass function (IMF)), Bruzual & Charlot (2003, using the Chabrier IMF), and Maraston (2005, using the Kroupa IMF) for this purpose. As to the observed peak and colors of the blue GCs, Figure 6 shows that all three models fit these quite well at an age of 14 Gyr and [/H] = 1.7, which is consistent with the mean [/H] of old Galactic halo GCs (e.g., Harris, 1996). Given that the luminosity function of the blue GC subsystem is also consistent with that of the Galactic halo GCs (see below), we consider the blue GC subsystem to consist of old, metal-poor GCs for all intents and purposes. As to the red GC subsystem, Figure 6 shows that its peak and colors are consistent with various age/metallicity combinations. These are discussed in turn below.
One option to explain the colors of the red GCs is that they are ‘old’ (age 10 Gyr) GCs with (the exact best-fit value for [/H] depending on the preferred SSP model), i.e., GCs with properties similar to those of bulge GCs in our Galaxy (e.g., Puzia et al., 2002; Maraston et al., 2003), which may have been introduced into NGC 3610 if (at least) one of the merger progenitor spiral galaxies hosted a significant bulge component. The existence of old GCs among the ‘red’ GC subsystem in NGC 3610 was shown by Strader et al. (2004), who determined ages and metallicities of 11 GCs in NGC 3610 from spectra obtained with the Keck I telescope, using spectroscopic Lick indices. Based on SSP model fits to the Lick indices, Strader et al. argued that 7 out of the 9 ‘red’ GCs in their sample were best fit by old ages ( 10 Gyr) and metallicities similar to those of GCs in the Galactic bulge. This option will be considered further in interpreting the LF of red GCs in Section 4.2 below.
Another option that is consistent with the colors of the red GCs is that they are of intermediate age ( 1 – 4 Gyr) and metal rich ([/H] 0.0). Support for this option is provided by several empirical results. First of all, the LF of the red GC population in NGC 3610 is known to be well-fit by a power law down to well beyond the turnover magnitude of known ‘old’ GC systems in giant ellipticals (W02; see also Sect. 4.2.2 below). Second, the peak color of the red GCs in NGC 3610 is significantly bluer than that of red GCs in ‘normal’ elliptical galaxies at the luminosity of NGC 3610. This is illustrated in Figure 7 which shows the relation between the peak colors of the red GC subpopulation in nearby elliptical galaxies with clear bimodal color distributions versus the galaxies’ absolute -band magnitude from the study of Larsen et al. (2001). Figure 7 clearly shows that these two properties correlate strongly with each other, which has been generally interpreted as a galaxy luminosity-metallicity relation similar to that among elliptical galaxies themselves, suggesting a close connection between the physical processes responsible for the formation of the red GCs and that of their parent galaxies (e.g., Brodie & Strader, 2006, and references therein). Assuming the same physical relation holds for NGC 3610 (and for the 3-Gyr-old merger remnant NGC 1316: Goudfrooij et al., 2001b, 2004), the fact that the peak color of their red GCs are clearly offset to the blue from this relation (see Figure 7) must be due to a younger age rather than a lower metallicity. Finally, the Lick indices of the 2 innermost red GCs in the spectroscopic sample of Strader et al. (2004) were best fit by an age of 1.6 Gyr and metallicity [/H] +0.3, consistent with Lick-system analysis of spectra of the diffuse light of the galaxy out to beyond its effective radius (Howell et al., 2004). Figure 6 shows that this age/metallicity combination fits the observed and colors quite well.

4.2. Cluster Luminosity Functions
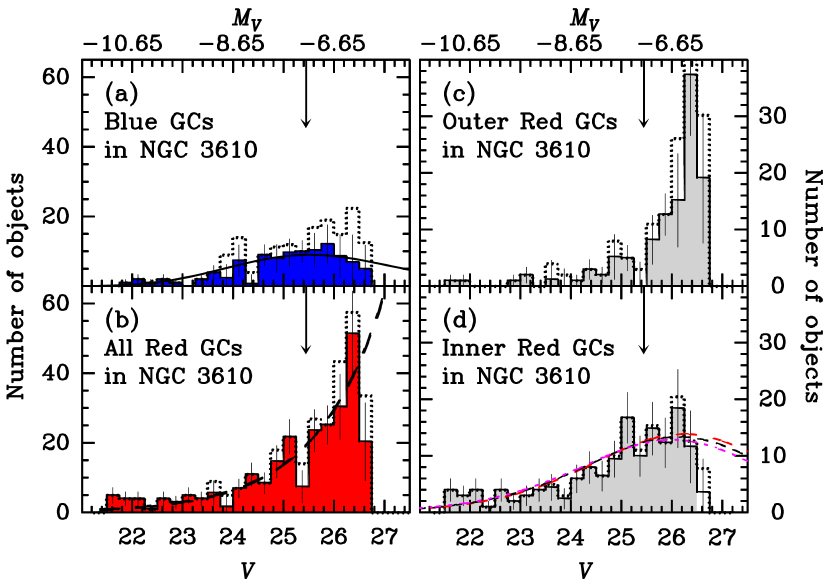
The LFs of the blue and red GC subpopulations are shown in Figure 8, and were determined as follows. We first separated the GC candidates into ‘blue’ () and ‘red’ () subsamples. Note that in this case, we avoided the overlapping region () to minimize the mixing of the two subsamples. A completeness correction was then applied to each GC by dividing its count (of 1) by the completeness fraction corresponding to its brightness and background level. The latter fraction was calculated from the functions shown in Figure 2, using bilinear interpolation in log(background) space. The LFs were further corrected for contamination by foreground stars and compact background objects using the smoothed and scaled LF of the objects detected at galactocentric distances with the same color and size criteria as the GC candidates at . The LFs of those outer objects were smoothed by a five-bin median filter to avoid noise due to small-number statistics and scaled to the area of the region prior to subtraction. The observed LFs corrected for completeness are shown as dotted lines in Figure 8, whereas the solid lines show the LFs after correction for contamination by compact background objects.
As already reported by W02, the LFs of the (full) blue and red GC subsystems in NGC 3610 differ significantly from each other. We discuss the LFs of the two subpopulations separately below.
4.2.1 The Blue Subpopulation
The shape of the LF of the blue GC subsystem is similar to that typically reported for GCs in ‘normal’ giant ellipticals, i.e., approximately Gaussian with a turnover magnitude (e.g., the compilation of Whitmore [1997] found ). A Gaussian fit to the LF of the blue GC subsystem of NGC 3610 results in a peak of and a standard deviation . While the latter is consistent with that found among ‘normal’ giant early-type galaxies (e.g., Kundu & Whitmore [2001] found values between 1.1 – 1.5 mag), it is significantly larger than that found for NGC 3610 by W02, who found . We ascribe this difference to a larger field of view and a larger sample of GC candidates in the current study relative to W02.
4.2.2 The Red Subpopulation
The LF for the full red GC system is consistent with a power law down to the 50% completeness limit of the data. A weighted least-squares fit of to the LF yields an exponent , consistent with the value found by W02 (). While this confirms the nature of the bulk of the red GC population of NGC 3610 as having formed during a recent star-forming event, it does not provide significant evidence to suggest an evolution of the LF from a power law to a Gaussian.
However, disruption timescales of the main dynamical effects thought to be responsible for the Gaussian shape of the GC LFs of ‘normal’, old galaxies through preferential depletion of low-mass GCs (Vesperini, 2001; Fall & Zhang, 2001; Baumgardt & Makino, 2003) depend on galactocentric distance. The stronger tidal field in the central regions yields stronger tidal shocks than in the outskirts, while also imposing a more stringent zero-energy surface on the GCs so that stars can be more easily removed from the GCs through two-body relaxation (see also Gnedin & Ostriker, 1997; Gnedin, 1997). Hence, the appearance of a turnover in the GC LF can be expected to first occur in the inner parts of the GC system. This was first shown to be the case by Goudfrooij et al. (2004) for the 3-Gyr-old merger remnant NGC 1316, where the inner half of the red GC system showed a significant flattening of the GC LF beyond the turnover expected (and found) for the blue, metal-poor GC system. In contrast, the outer half of the red GC system still rose strongly all the way to the detection limit. With the 580 GC candidates in our ACS images of NGC 3610, we are now in a position to test this finding for this intermediate-age merger remnant with high enough statistical significance as well. To do so, we divide the red GC system into two equal-size parts sorted by projected galactocentric radius. For our sample, this division ends up at 467, or 4.8 kpc from the galaxy center. The resulting LFs are shown in panels (c) and (d) of Figure 8. The LF of the outer half of the red GC system still rises all the way to the detection limit, whereas the LF of the inner half of the red GC system shows a clear flattening consistent with a turnover at 1.0 mag fainter than that of the blue GC system. These properties are quite similar to those found for the red GC system in NGC 1316 (Goudfrooij et al., 2004).
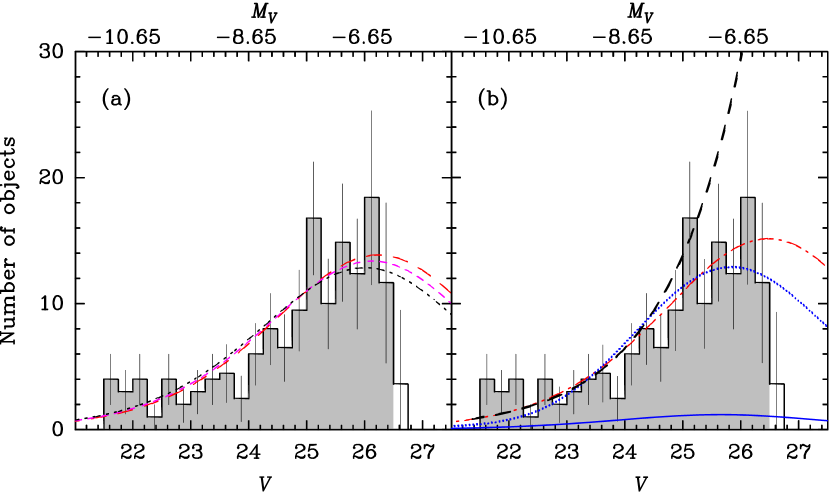
We compare these results with predictions of GC disruption models by Fall & Zhang (2001, hereafter FZ01) in Figure 8. The FZ01 models, whose initial GC velocity distribution involves a radial anisotropy distribution that is consistent with kinematics of halo stars in the solar neighborhood, showed that an initial power law or Schechter mass function evolves in 12 Gyr to a peaked mass distribution similar to that observed for the Milky Way GC system. To predict the shapes of luminosity functions as a function of age, we use the FZ01 model that uses a power-law initial mass function in combination with the SSP models of Maraston (2005). We assume [/H] = 1.7 for the 12 Gyr old population (similar to the median metallicity of halo GCs in our Galaxy), while we use [/H] = 0.0 for populations of ages 1.5, 3, and 6 Gyr. Prior to plotting, the amplitude of all resulting model LFs were normalized to the observed data down to the 50% completeness limit by weighted least-square minimization. The individual RMS values of these fits to the histograms are listed in Table 3. The peak magnitudes of the 1.5, 3, and 6 Gyr model LFs of solar metallicity span a range of only 0.3 mag in , due to the counteracting effects of disruption of (preferentially low-mass) GCs and luminosity fading of the surviving GCs (see also W02). Hence the LF shapes of these three models are quite similar to one another. However, as discussed in Sect. 4.1, recent spectroscopic investigations indicated that the intermediate-age GC population is of age 1.5 Gyr and has [/H] , as found for two bright, inner red GCs as well as the integrated galaxy light (Strader et al., 2004; Howell et al., 2004). This possibility is illustrated in Figure 9, which compares the models shown in Figure 8d with the combination of the 1.5 Gyr FZ01 model and the Maraston (2005) model of 1.5 Gyr and [/H] = +0.3. Formally, the least-squares fit of this model to the LF indeed yields the lowest RMS residuals of all models for intermediate ages considered here. For reference, Figure 9 also shows a fit of a 12 Gyr FZ01 model with a metallicity similar to that of an average Galactic bulge GC ([/H] = , see Puzia et al., 2002; Maraston et al., 2003) to the LF of the inner 50% of the red GCs. As Table 3 shows, this model does not fit the data nearly as well as any of the intermediate-age models. Furthermore, if the majority of the red GCs would be 12 Gyr old and of moderate metallicity, one would expect this model to fit the red GC LF independent of galactocentric radius, as it does for the metal-rich GCs associated with the Galactic bulge as well as for red GCs in “normal” giant ellipticals. In contrast, the LF of the 50% outermost red GCs is consistent with a power law as shown in Figure 8c.
| AgebbAssumed age of red GCs. | [/H]ccAssumed [/H] of red GCs. | rms |
| (Gyr) | (dex) | error |
| 1.5 | +0.3 | 2.38 |
| 1.5 | 0.0 | 2.43 |
| 3.0 | 0.0 | 2.48 |
| 6.0 | 0.0 | 2.57 |
| 12.0 | 0.7 | 3.12 |
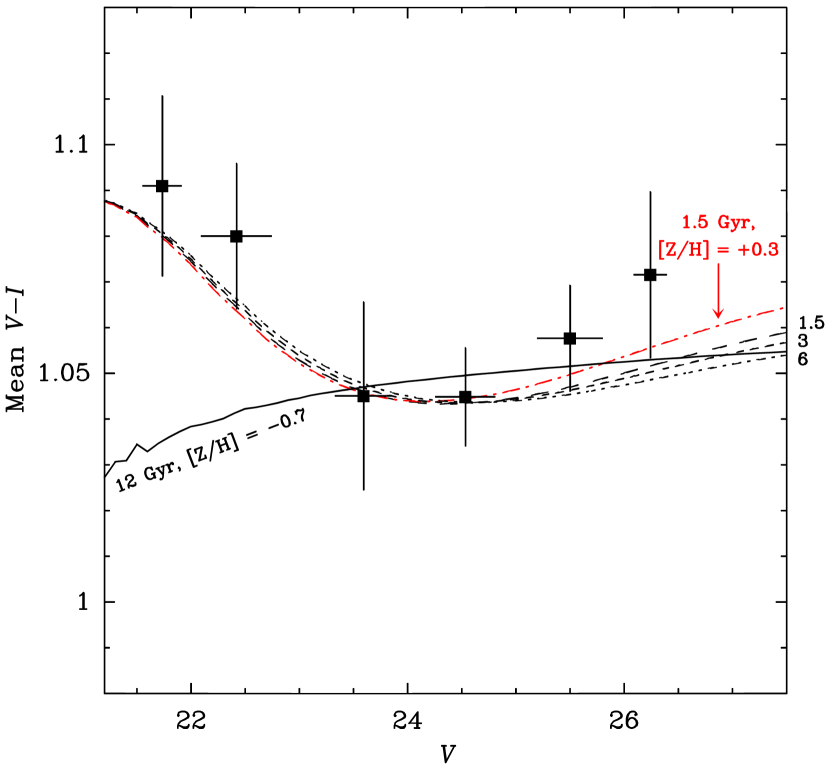
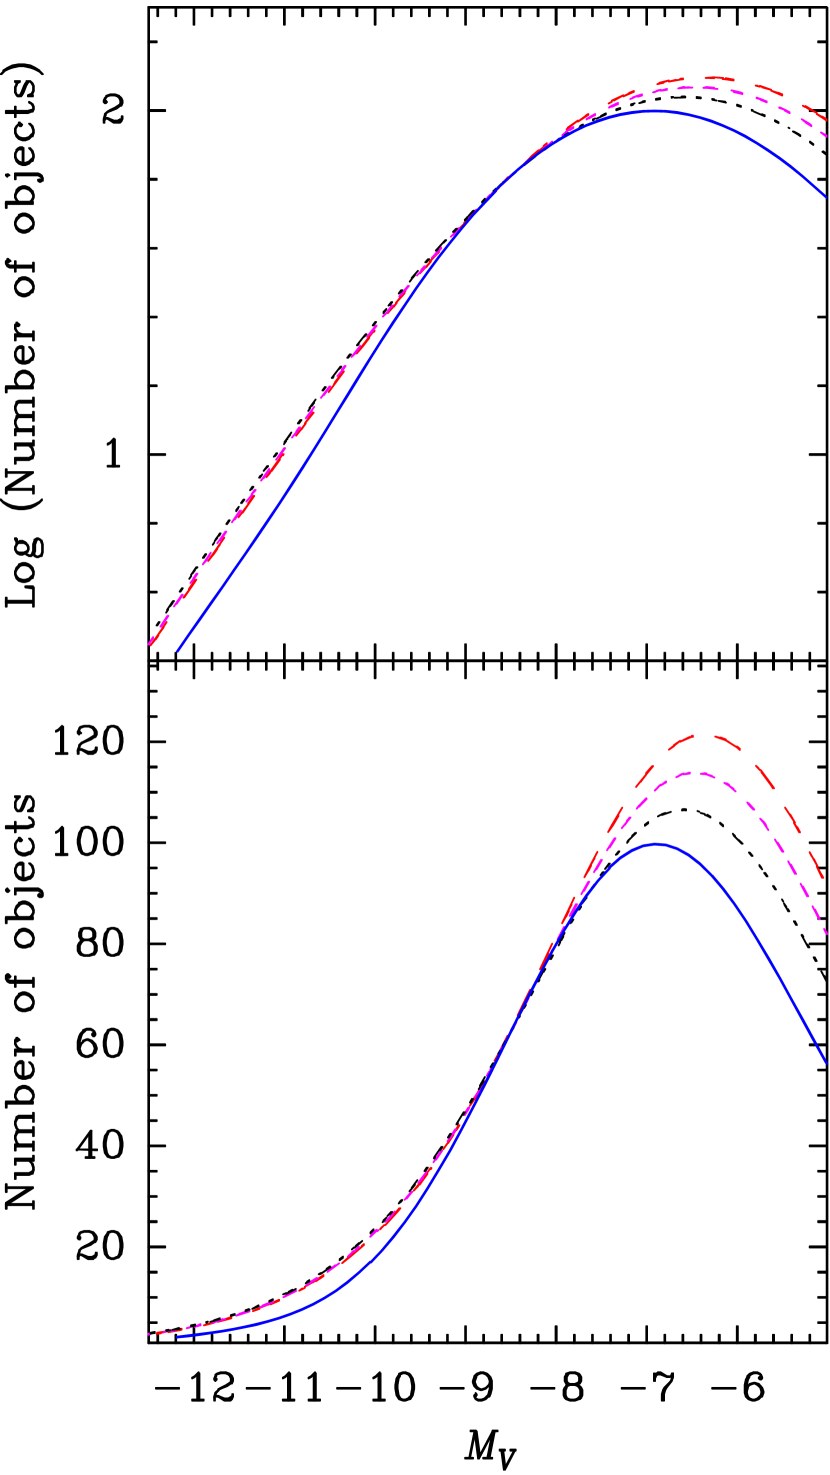
Another way to test whether the red GC subpopulation is more likely to be dominated by an intermediate-age population with [/H] or by an old bulge-like population with [/H] is by comparing the observed mean colors of GCs as a function of their luminosity with the predictions of the cluster disruption models fit to the LFs of the blue and red GCs (i.e., the curves in Figures 8a and 9). This comparison is shown in Figure 10 for the inner half of the GC population ( 467), for which we showed that the FZ01 models fit the LFs of both the blue and the red GC subpopulations quite well. To calculate mean colors as predicted by the models, we assume = 0.93 and = 1.09 for the blue and red subpopulations, respectively (cf. Table 2). The observed mean colors are calculated for GC candidates with . Figure 10 shows that the observed behavior of the mean GC color as function of magnitude (the red clusters dominating at both the bright and faint ends of the LF) is clearly better fit by metal-rich intermediate-age models than by the old model with bulge-GC-like metallicity ([/H] = ). (Incidentally, the 1.5 Gyr model with [/H] yields the best fit to the observed mean colors, just as it does to the LF of the red GCs.) This result is mainly due to the lack of high-luminosity red GCs in the 12 Gyr FZ01 model with [/H] = 0.7 relative to the situation for the models of younger age. The underlying reason is that at high GC masses and old ages, age fading from one luminosity bin to the next (lower) one is somewhat faster than the disruption rate of GCs in that lower luminosity (or mass) bin. This is demonstrated in Figure 11 in which we plot the same model LFs, normalized to each other at (in the steep part of the high-luminosity wing of the LF), both on logarithmic and linear scales. The bright end of the LF moves to lower luminosities between 6 and 12 Gyr.
From the above considerations, it seems most likely that the red GC subpopulation in NGC 3610 is dominated by an intermediate-age population with [/H] rather than an old population with [/H]. As Figure 9 shows, the location of the turnover found for the inner half of the red GC system is in rather good agreement with those of the FZ01 models for intermediate ages and solar metallicity. It thus seems reasonable to suggest that the LF of this second-generation GC system will evolve further to become consistent with the LFs of red GCs in ‘normal’ giant ellipticals.
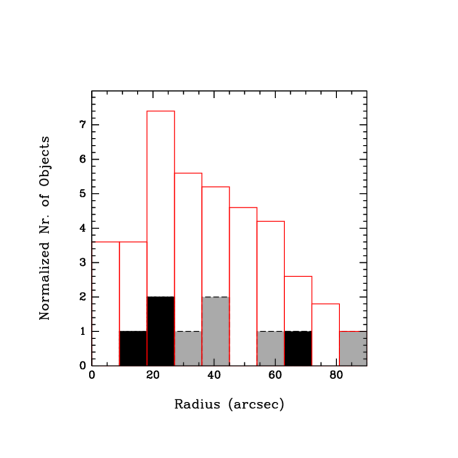
Our results seem to differ from those of Strader et al. (2004) who argued (based on spectra taken using the Keck I telescope) that 7 out of their 9 red GCs in NGC 3610 are old ( Gyr) rather than of intermediate age. To address this apparent discrepancy, we offer the following insights. (i) Most red GCs targeted by Strader et al. (2004) were located in the outer regions of NGC 3610, whereas the majority of the bright red GCs is centrally located, as might be expected for GCs formed in a relatively recent starburst event associated with a dissipative galaxy merger. This is illustrated in Figure 12 which compares a histogram of the projected radii of the red GCs targeted by Strader et al. (2004) with that of the red GC system from the current study. (ii) The faintness of the sources and the relatively high galaxy background caused many of Strader et al.’s GC spectra to be of marginal quality. Applying a commonly assumed absolute minimum requirement on the signal-to-noise (S/N) ratio to allow a useful age/metallicity analysis (S/N 10 per Å, see e.g. Kuntschner et al., 2002; Larsen et al., 2003; Beasley et al., 2004; Puzia et al., 2002, 2005, 2006), Strader et al.’s results amount to four red GCs with spectra of adequate S/N of which two are old and two are of intermediate age. (This excludes clusters W22 and W28 [i.e., # 20 and # 26 in the current study, respectively], which are clearly blue GCs as judged from the ACS data, cf. Table 1.) While we believe a small sample of 4 GCs with adequate spectral data does not allow one to draw strong conclusions regarding the fraction of red GCs being old vs. of intermediate age, it is clear from the Strader et al. (2004) study that old GCs do exist among the red GC subsample in NGC 3610. As these old, red GCs presumably stem from the progenitor galaxies that merged to form NGC 3610, it seems likely that at least one of those galaxies possessed a significant bulge. For example, the Milky Way (a giant Sbc galaxy) hosts about 20 – 30 old, metal-rich GCs associated with its bulge (e.g., Minniti, 1995). The LF expected for a population of 50 such GCs according to the FZ01 model for an age of 12 Gyr is illustrated in Figure 9b as a solid curve. Note that the contribution of such a population is negligible relative to the observed numbers of red GCs, especially since Figure 9c only refers to the inner 50% of the red GC subsystem.
4.3. Radial Distributions and Specific Frequencies
The specific frequency of GCs,
(Harris & van den Bergh, 1981), i.e., the number of star clusters per galaxy luminosity in units of = 15, is an important parameter of GC systems in galaxies. is known to increase along the Hubble sequence, with mean values ranging from for Sc spirals (Goudfrooij et al., 2003; Chandar et al., 2004) to for ‘normal’ giant ellipticals outside galaxy clusters, albeit with considerable galaxy-to-galaxy scatter (e.g., Ashman & Zepf, 1998; Brodie & Strader, 2006).
The intermediate-age merger remnant NGC 3610 is a well-suited probe to test whether the difference in specific frequency between spirals and (giant) ellipticals can be accounted for by secondary populations of clusters created during (gas-rich) mergers. We know that its body has already settled down to a typical surface brightness law, we have a relatively good estimate of the age of the major merger during which the secondary population of GCs were created (both from the properties of the GCs themselves and from deep spectra of the diffuse galaxy light; Howell et al., 2004), and it occurred long enough ago for dynamical evolution of the system to have already had a significant impact. Hence, estimates of evolutionary effects ought to be less uncertain than for younger mergers. In the remainder of this section, we derive the current value of for NGC 3610 and estimate its future evolution.
4.3.1 Radial Number Density Distribution of Blue and Red Clusters
The radial distribution of the surface number density of blue and red GCs in NGC 3610 was derived from the ACS data as follows. To avoid incompleteness-related issues, we only considered GCs brighter than the 50% completeness limit in the central regions () for this exercise. We calculated the completeness-corrected number of blue and red GCs in four annuli, logarithmically spaced in projected galactocentric radius. Next, we divided the number of clusters in each annulus by the appropriate area coverage to yield a surface density (taking into account the limited azimuthal sky coverage of the data at large radii). Finally, we subtracted the surface number density of foreground stars and compact background galaxies for both blue and red GCs, measured as detailed in Sect. 4.1 above.
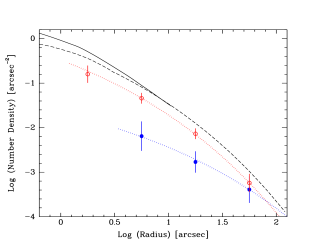
Figure 13 shows the derived number density distributions of the blue and red GCs, along with the surface brightness profile of the galaxy light for comparison purposes. The surface number density profile of the red GCs is largely consistent with the galaxy light profile (the innermost surface number density value is slightly below the latter), whereas that of the blue GCs is significantly flatter than the galaxy light profile. Quantitatively, least-square de Vaucouleurs’ (1948) profile fits to the GC number density profiles yield arcsec (or kpc) for the blue GCs and arcsec (or kpc) for the red GCs. While radial number density profiles of red GCs in giant ellipticals are typically found to be steeper than those of blue GCs (e.g., Ashman & Zepf, 1998), the difference in slope is typically smaller than that found here for NGC 3610. In particular, the number density profile of the red GCs is significantly closer to that of the galaxy light in NGC 3610 than it is in ‘normal’ giant elliptical galaxies (Forbes et al., 1998, 2006; Dirsch et al., 2003, 2005; Bassino et al., 2006), where the red GCs are more depleted towards the center than the galaxy light. This difference is likely due to the cumulative effects of two-body relaxation and tidal shocking of GCs (both of which are most effective in the central regions as discussed in Sect. 4.2.2 above) and dynamical friction (the latter only for the most massive GCs, Vesperini, 2001). The more moderate flattening of the number density of the red GC system of NGC 3610 towards the center relative to that of ‘normal’ giant ellipticals is consistent with the intermediate-age nature of NGC 3610.
4.3.2 Specific Frequencies of Blue and Red Clusters
The number of GCs in the formula for the specific frequency was originally defined for ‘old’ GC systems which show LFs consistent with a Gaussian, namely as twice the number of GCs brighter than the GCLF turn-over magnitude (Harris & van den Bergh, 1981). This is the procedure we follow for the blue GCs, for which the turnover magnitude corresponds to a mass of M⊙ according to the Maraston (2005) SSP model for an age of 14 Gyr and . As the red GCs in NGC 3610 are most likely predominantly of intermediate age rather than old, we use an alternative definition of for the red GCs: We calculate twice the number of red GCs more massive than the mass associated with the turnover magnitude of the Galactic GC system, taking into account the uncertainties of the assumed age and metallicity for the red GCs. To this end, we use the SSP tables of Maraston (2005) and age/metallicity combinations ranging from Age = 1.5 Gyr and to Age = 4 Gyr and (cf. Figure 6).
Using the profile fits to the GC number density profiles mentioned above, we calculate the total number of blue and red GCs more massive than M⊙. For the purpose of calculations, we separate blue and red GCs at = 1.00 and we assume a distance uncertainty of 15%. Results are listed in Table 4.
| AgeaaAssumed age of red GCs in Gyr. | [/H]bbAssumed [/H] of red GCs in dex. | NblueccTotal number of blue GCs around NGC 3610. | NredddTotal number of red GCs around NGC 3610. | eePresent-day specific frequency of blue GCs. | ffPresent-day specific frequency of red GCs. | ggTotal present-day specific frequency of GCs. | Nred,oldhhNumber of red GCs at age of 10 Gyr, corrected for disruption. | iiSpecific frequency of blue GCs at age of 10 Gyr. | jjSpecific frequency of red GCs at age of 10 Gyr. | kkTotal specific frequency of GCs at age of 10 Gyr. |
|---|---|---|---|---|---|---|---|---|---|---|
| 1.5 | +0.3 | |||||||||
| 2.0 | 0.0 | |||||||||
| 3.0 | 0.0 | |||||||||
| 4.0 | 0.0 |
Using a total -band magnitude of 10.84 for NGC 3610 (de Vaucouleurs et al., 1991) and hence at the assumed distance of NGC 3610, the total present-day . To allow a proper comparison of this estimate with those of ‘normal’, old ellipticals, this value still needs to be corrected for two evolutionary effects:
-
1.
Luminosity fading of the diffuse light of NGC 3610. Treating the diffuse light of NGC 3610 as a SSP, we assume an age of 3 1 Gyr for NGC 3610 and an age of 10 Gyr for a ‘normal’ elliptical. This luminosity fading amounts to 1.17 0.31 mag in the band. An alternative option is that the diffuse light of NGC 3610 is produced by a combination of an old and a young population. Using the Maraston (2005) models at solar metallicity, we find that the color of the diffuse light ( = 1.92 and = 1.11, see Goudfrooij et al. 1994a) can be modeled as a combination of a 10-Gyr-old component (73% by luminosity) plus a 1-Gyr-old component (27% by luminosity). In this case, the luminosity fading of the young component to an age of 10 Gyr would amount to 0.80 mag, which is near the low end of the range of fading values calculated for the SSP age of 3 1 Gyr mentioned above.
-
2.
The fraction of red GCs more massive than M⊙ that will be disrupted during this period. To estimate this fraction, we use the FZ01 model mass functions that involve a power-law initial mass function and find that the number of GCs more massive than M⊙ decreases by 12.0% between ages of 1.5 and 12 Gyr, and by 9.8% between ages of 3 and 12 Gyr. For the current estimate, we adopt a value of 10%.
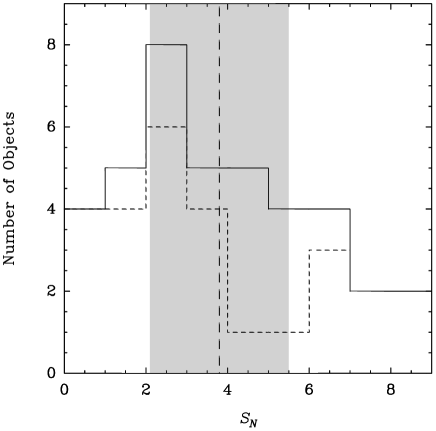
Taking the corrections mentioned above into account, our final estimate of the total specific frequency of GCs in NGC 3610 at an age of 10 Gyr is . The fraction of red GCs contributing to this value is . While these values should be checked using a future deep wide-field imaging study of NGC 3610 (e.g., the study of NGC 7814 by Rhode & Zepf [2003] showed that one can overestimate by 20–30% when extrapolating results from HST images to large radii), we do note that this value of is consistent with typical values found for giant ellipticals in loose groups333NGC 3610 is the brightest galaxy of a loose group of galaxies (LGG 234, 5 members; Garcia, 1993).. This is illustrated by Figure 14 which compares the value for NGC 3610 found here with a histogram of values for ‘normal’ ellipticals (taken from the compilation of Ashman & Zepf, 1998, which does not include NGC 3610). Quantitatively, the mean and standard deviation of specific frequencies of ellipticals outside galaxy clusters in the latter compilation is .
5. Summary and Conclusions
We have presented a study of globular cluster candidates in NGC 3610, a giant elliptical galaxy that is very likely an intermediate-age merger remnant, using deep BVI images taken with the ACS camera on board the Hubble Space Telescope. Our main results are as follows.
-
1.
The globular clusters show a clear bimodal color distribution, both in and in . The peak colors of the blue subpopulation are = 1.61 0.01and = 0.93 0.01, and those of the red subpopulation are = 1.92 0.01 and = 1.09 0.01. The colors of the blue clusters are consistent with those of blue clusters in other elliptical galaxies as well as of halo clusters in our Galaxy, while the colors of the red clusters are significantly bluer than the colors indicated by the relation of red cluster color with galaxy luminosity among ‘normal’ elliptical galaxies. Given the additional fact that the brightest red clusters are up to 0.5 mag brighter than the brightest blue clusters in NGC 3610, we interpret this as evidence for a younger age of the red clusters in NGC 3610 relative to normal giant ellipticals rather than a significantly lower metallicity.
-
2.
The luminosity function of the blue, metal-poor subpopulation of clusters in NGC 3610 is similar to a Gaussian with and , consistent with values typical for old blue cluster populations in normal elliptical galaxies.
-
3.
The luminosity function of the full red subpopulation of clusters in NGC 3610 is consistent with a power law with , which is consistent with the result of W02 using earlier WFPC2 data. However, the luminosity function of the inner half of the red cluster subsystem shows a clear flattening consistent with a turnover at . A comparison with predictions of GC disruption models in conjunction with simple stellar population models at various ages and metallicities shows that both the luminosity function of the inner half of the red cluster subsystem and the relation of mean cluster color with luminosity are best fit by a population of metal-rich clusters of intermediate age ( Gyr). As similar results were found for the red GCs in the 3-Gyr-old merger remnant NGC 1316 (Goudfrooij et al., 2004), this result supports the assertion that dynamical evolution of metal-rich GC populations formed in gas-rich galaxy mergers indeed changes their LF properties to become consistent with those of the red, metal-rich GC subsystems that are ubiquitous in ‘normal’ giant ellipticals.
-
4.
The surface number density profile of the blue GC subpopulation is much more radially extended than the surface brightness profile of the galaxy light, similar to the situation in ‘normal’, old elliptical galaxies. In contrast, the radial profile of the red GC subpopulation follows that of the galaxy light almost all the way into the galaxy center. The difference in steepness between the radial profile of the red GC population and that of the galaxy light is smaller than reported for ‘normal’, old elliptical galaxies. The combination of this result with the finding that the red GCs and the galaxy light appear to have ages and metallicities consistent with each other suggests that most of the red GCs were formed during the same event as the bulk of the field stars in NGC 3610 and that they have suffered little disruption after violent relaxation with respect to the situation in ‘normal’ ellipticals.
-
5.
We determine the specific frequency of clusters in NGC 3610 and find a present-day value of . Using published age estimates for the diffuse light of NGC 3610 as well as cluster disruption models, we estimate that this value will increase to at an age of 10 Gyr, which is consistent with typical values of ‘normal’ elliptical galaxies in loose groups.
Our results support a picture in which the formation process of giant ellipticals with significant populations of metal-rich GCs was similar to that of gas-rich galaxy mergers observed today.
Acknowledgments.
We acknowledge useful interactions with Enrico Vesperini, Rupali Chandar, and Thomas Puzia. We thank the anonymous referee for insightful comments which improved the paper. Support for HST Program GO-9409 was provided by NASA through a grant from the Space Telescope Science Institute, which is operated by the Association of Universities for Research in Astronomy, Inc., under NASA contract NAS5–26555.
References
- Anders & Fritze-v. Alvensleben (2003) Anders, P., & Fritze-v. Alvensleben, U., 2003, A&A, 401, 1063
- Ashman & Zepf (1992) Ashman, K. M., & Zepf, S. E., 1992, ApJ, 384, 50
- Ashman & Zepf (1998) Ashman, K. M., & Zepf, S. E., 1998, “Globular Cluster Systems” (Cambridge: Cambridge University Press)
- Ashman et al. (1994) Ashman, K. M., Bird, C. M., & Zepf, S. E., 1994, AJ, 108, 2348
- Barnes (2002) Barnes, J. E., 2002, MNRAS, 333, 481
- Bassino et al. (2006) Bassino, L. P., Richtler, T., & Dirsch, B., 2006, MNRAS, 367, 156
- Bastian et al. (2006) Bastian, N., Saglia, R. P., Goudfrooij, P., Kissler-Patig, M., Maraston, C., Schweizer, F., & Zoccali, M., 2006, A&A, 448, 881
- Baumgardt (1998) Baumgardt, H., 1998, A&A, 330, 480
- Baumgardt & Makino (2003) Baumgardt, H., & Makino, J., 2003, MNRAS, 340, 227
- Beasley et al. (2004) Beasley, M. A., Brodie, J. P., Strader, J., Forbes, D. A., Proctor, R. N., Barmby, P., & Huchra, J. P., 2004, AJ, 128, 1623
- Brodie & Strader (2006) Brodie, J. P., & Strader, J., 2006, ARA&A, 44, 193
- Bruzual & Charlot (1993) Bruzual, G. A., & Charlot, S., 1993, ApJ, 405, 538
- Bruzual & Charlot (2003) Bruzual, G. A., & Charlot, S., 2003, MNRAS, 344, 1000
- Burstein & Heiles (1984) Burstein, D., & Heiles, C. 1984, ApJS, 54, 33
- Burstein et al. (1987) Burstein, D., Davies, R. L., Dressler, A., Faber, S. M., Stone, R. P. S., Lynden-Bell, D., Terlevich, R., & Wegner, G., 1987, ApJS, 64, 601
- Chandar et al. (2004) Chandar, R., Whitmore, B. C., & Lee, M. G., 2004, ApJ, 611, 220
- Cohen et al. (2003) Cohen, J. G., Blakeslee, J. P., & Côté, P., 2003, ApJ, 592, 866
- de Vaucouleurs (1948) de Vaucouleurs, G., 1948, Ann. d’Astrophys., 11, 247
- de Vaucouleurs et al. (1991) de Vaucouleurs, G., de Vaucouleurs, A., Corbin, H. G., Buta, R. J., Paturel, G., & Fouque, P., 1991, “Third Reference Catalogue of Bright Galaxies” (New York: Springer)
- Dirsch et al. (2003) Dirsch, B., Richtler, T., Geisler, D., Forte, J. C., Bassino, L. P., & Gieren, W. P., 2003, AJ, 125, 1908
- Dirsch et al. (2005) Dirsch, B., Schuberth, Y., & Richtler, T., 2005, A&A, 433, 43
- Fall & Zhang (2001) Fall, S. M., & Zhang, Q., 2001, ApJ, 561, 751 (FZ01)
- Forbes et al. (1997) Forbes, D. A., Brodie, J. P., & Grillmair, C. J., 1997, AJ, 113, 1652
- Forbes et al. (1998) Forbes, D. A., Grillmair, C. J., Williger, G. M.., Elson, R. A. W., & Brodie, J. P., 1998, MNRAS, 293, 325
- Forbes et al. (2001) Forbes, D. A., Beasley, M. A., Brodie, J. P., & Kissler-Patig, M., 2001, ApJ, 563, L143
- Forbes et al. (2006) Forbes, D. A., Sánchez-Blázquez, P., Phan, A. T. T., Brodie, J. P., Strader, J., & Spitler, L., 2006, MNRAS, 366, 1230
- Garcia (1993) Garcia, A. M., 1993, A&AS, 100, 47
- Geisler et al. (1996) Geisler, D., Lee, M. G., & Kim, E., 1996, AJ, 111, 1529
- Gnedin (1997) Gnedin, O. Y., 1997, ApJ, 487, 663
- Gnedin & Ostriker (1997) Gnedin, O. Y., & Ostriker, J. P., 1997, ApJ, 474, 223
- Goudfrooij et al. (1994a) Goudfrooij, P., Nørgaard-Nielsen, H. U., Hansen, L., Jørgensen, H. E., de Jong, T., & van den Hoek, L. B., 1994a, A&AS, 104, 179
- Goudfrooij et al. (1994b) Goudfrooij, P., Nørgaard-Nielsen, H. U., Hansen, L., & Jørgensen, H. E., 1994b, A&AS, 105, 341
- Goudfrooij et al. (2001a) Goudfrooij, P., Mack, J., Kissler-Patig, M., Meylan, G., & Minniti, D., 2001a, MNRAS, 322, 643
- Goudfrooij et al. (2001b) Goudfrooij, P., Alonso, M. V., Maraston, C., & Minniti, D., 2001b, MNRAS, 328, 237
- Goudfrooij et al. (2003) Goudfrooij, P., Strader, J. M., Brenneman, L., Kissler-Patig, M., & Huizinga, E. J., 2003, MNRAS, 343, 665
- Goudfrooij et al. (2004) Goudfrooij, P., Gilmore, D., Schweizer, F., & Whitmore, B. C., 2004, ApJ, 613, L121
- Harris (1996) Harris, W. E., 1996, AJ, 112, 1487
- Harris & van den Bergh (1981) Harris, W. E., & van den Bergh, S., 1981, AJ, 86, 1627
- Harris et al. (2006) Harris, W. E., Whitmore, B. C., Karakla, D., Okoń, W., Baum, W. A., Hanes, D. A., & Kavelaars, J. J., 2006, ApJ, 636, 90
- Holtzman et al. (1992) Holtzman, J. A., Faber, S. M., Shaya, E. J., et al. 1992, AJ, 103, 691
- Howell et al. (2004) Howell, J. H., Brodie, J. P., Strader, J., Forbes, D. A., & Proctor, R., 2004, AJ, 128, 2749
- Idiart et al. (2002) Idiart, T. P., Michard, R., & de Freitas Pacheco, J. A., 2002, A&A, 383, 30
- Knapp et al. (1989) Knapp, G. R., Guhathakurta, P., Kim, D. W., & Jura, M. A., 1989, ApJS, 70, 329
- Kundu & Whitmore (2001) Kundu, A., & Whitmore, B. C., 2001, AJ, 121, 1888
- Kuntschner et al. (2002) Kuntschner, H., Ziegler, B. L., Sharples, R. M., Woorthey, G., & Fricke, K. J., 2002, A&A, 395, 761
- Larsen et al. (2001) Larsen, S. S., Brodie, J. P., Huchra, J. P., Forbes, D. A., & Grillmair, C. J., 2001, AJ, 121, 2974
- Larsen et al. (2003) Larsen, S. S., Brodie, J. P., Beasley, M. A., Forbes, D. A., Kissler-Patig, M., Kuntschner, H., & Puzia, T. H., 2003, ApJ, 589, L81
- Maraston (2005) Maraston, C., 2005, MNRAS, 362, 799
- Maraston et al. (2001) Maraston, C., Kissler-Patig, M., Brodie, J. P., Barmby, P., & Huchra, J. P., 2001, A&A, 370, 176
- Maraston et al. (2003) Maraston, C., Greggio, L., Renzini, A., Ortolani, S., Saglia, R. P., Puzia, T. H., & Kissler-Patig, M., 2003, A&A, 400, 823
- Maraston et al. (2004) Maraston, C., Bastian, N., Saglia, R. P., Kissler-Patig, M., Schweizer, F., & Goudfrooij, P., 2004, A&A, 416, 467
- McLachlan & Basford (1988) McLachlan, G. J., & Basford, K. E., 1998, Mixture Models: Inference and Application to Clustering (New York: M. Dekker)
- Michard (2005) Michard, R., 2005, A&A, 429, 819
- Minniti (1995) Minniti, D., 1995, AJ, 109, 1663
- Peng et al. (2006) Peng, E. W., Jordán, A., Côté, P., et al., 2006, ApJ, 639, 95
- Prieto & Gnedin (2006) Prieto, J. L., & Gnedin, O. Y., 2006, submitted to ApJ (astro-ph/0608069)
- Puzia et al. (2002) Puzia, T. H., Saglia, R. P., Kissler-Patig, M., Maraston, C., Greggio, L., Renzini, A., & Ortolani, S., 2002, A&A, 395, 45
- Puzia et al. (2005) Puzia, T. H., Kissler-Patig, M., Thomas, D., Maraston, C., Saglia, R. P., Bender, R., Goudfrooij, P., & Hempel, M., 2005, A&A, 439, 997
- Puzia et al. (2006) Puzia, T. H., Kissler-Patig, M., & Goudfrooij, P., 2006, ApJ, 648, 383
- Rhode & Zepf (2003) Rhode, K. L., & Zepf, S. E., 2003, AJ, 126, 2307
- Riess & Mack (2004) Riess, A., & Mack, J., 2004, Instrument Science Report ACS 2004-06 (Baltimore: STScI)
- Salpeter (1955) Salpeter, E. E., 1955, ApJ, 121, 161
- Schlegel et al. (1998) Schlegel, D. J., Finkbeiner, D. P., & Davis, M. 1998, ApJ, 500, 525
- Schweizer (1987) Schweizer, F., 1987, in: “Nearly Normal Galaxies”, ed. S. M. Faber (Springer: New York), 18
- Schweizer (2002) Schweizer, F., 2002, in: “Extragalactic Star Clusters”, eds. D. Geisler, E. K. Grebel, & D. Minniti (ASP: San Francisco), 630
- Schweizer & Seitzer (1992) Schweizer, F., & Seitzer, P., 1992, AJ, 104, 1039
- Schweizer & Seitzer (1998) Schweizer, F., & Seitzer, P., 1998, AJ, 116, 2206
- Seitzer & Schweizer (1990) Seitzer, P., & Schweizer, F., 1990, in: “Dynamics and Interactions of Galaxies”, ed. S. M. Faber (Springer: New York), 18
- Scorza & Bender (1990) Scorza, C., & Bender, R., 1990, A&A, 235, 49
- Sikkema et al. (2006) Sikkema, G., Peletier, R. F., Carter, D., Valentijn, E. A., & Balcells, M., 2006, A&A, 458, 53
- Sirianni et al. (2005) Sirianni, M., Jee, M. J., Benítez, N., et al. 2005, PASP, 117, 1049
- Stetson (1987) Stetson, P. B., 1987, PASP, 99, 191
- Strader et al. (2004) Strader, J., Brodie, J. P., & Forbes, D. A., 2004, AJ, 127, 295
- Strader et al. (2006) Strader, J., Brodie, J. P., Spitler, L., & Beasley, M. A., 2006, AJ, 132, 2333
- Tonry et al. (2001) Tonry, J. L., Dressler, A., Blakeslee, J. P., et al., 2001, ApJ, 546, 681
- van den Bergh (1995) van den Bergh, S., 1995, ApJ, 450, 27
- Vesperini (1998) Vesperini, E., 1998, MNRAS, 299, 1019
- Vesperini (2001) Vesperini, E., 2001, MNRAS, 322, 247
- Vesperini & Zepf (2003) Vesperini, E., & Zepf, S. E., 2003, ApJ, 587, L97
- Whitmore (1997) Whitmore, B. C., 1997, in: “The Extragalactic Distance Scale”, eds. M. Livio, M. Donahue, & N. Panagia (Baltimore: STScI), 254
- Whitmore et al. (1997) Whitmore, B. C., Miller, B. W., Schweizer, F., & Fall, S. M., 1997, AJ, 114, 1797
- Whitmore et al. (1999) Whitmore, B. C., Zhang, Q., Leitherer, C., Fall, S. M., Schweizer, F., & Miller, B. W., 1999, AJ, 118, 1551
- Whitmore et al. (2002) Whitmore, B. C., Schweizer, F., Kundu, A., & Miller, B. W., 2002, AJ, 124, 147
- Zepf & Ashman (1993) Zepf, S. E., Ashman, K. M., 1993, MNRAS, 264, 611