350m Observations of Local Luminous Infrared Galaxies and the Temperature Dependence of the Emissivity Index
Abstract
We report 350m observations of 18 nearby luminous infrared galaxies (LIRGs), using the Submillimeter High Angular Resolution Camera II (SHARC-II) mounted on the Caltech Submillimeter Observatory (CSO) 10.4 m telescope. Combining our 350m flux measurements with the existing far-infrared (far-IR) and submillimeter (submm) data, we fit a single-temperature model to the spectral energy distributions (SEDs), and find the dust temperatures, emissivity indices and far-IR luminosities having sample medians of , and . An empirical inverse - correlation, best described by , is established for the local LIRG sample, which we argue can be explained by the intrinsic interdependence between the dust temperature and grain emissivity index as physical parameters, as well as variations in grain properties in the the interstellar medium (ISM).
1 Introduction
Interstellar dust grains are small particles () that sparsely populate the ISM. Although interstellar dust accounts for only a very small fraction of the total mass in a galaxy, it plays critical roles in galaxy formation and evolution. Dust grains absorb strongly in the ultraviolet (UV) and optical, leading to a significant fraction of stellar radiation within a galaxy being absorbed. The warm grains subsequently emit strongly in the far-IR/submm, effectively down-converting the electromagnetic energy in various astrophysical environments. Observations of dust emission at far-IR and submm wavelengths are crucial in probing physical conditions and star formation activity.
Emission and absorption line features are generally weak in the far-IR/submm (Blain et al. 2003), leading to smooth far-IR/submm SEDs dominated by dust thermal continuum emission. However, modeling of the far-IR/submm SEDs observed in astronomical objects is far from trivial, as the observed emission spectrum is a complex function of radiative transfer as well as distributions in grain properties, such as composition, size and shape, that affect the way dust absorbs and emits radiation. In the simple case of a uniform grain population, dust thermal emission is well-approximated by a graybody (modified blackbody) function (Hildebrand 1983)
| (1) |
where is the dust temperature and is the absorption coefficient. Eq. (1) implicitly incorporates Kirchhoff’s law, which ensures the equality between the emissivity and the absorption coefficient at all frequencies. In the far-IR/submm, , where is the absorption coefficient normalized at some reference frequency and is the emissivity index 111A blackbody has absorption coefficient and emissivity index = 0 at all frequencies.. There are more elaborate far-IR/submm SED models that attempt to account for multiple dust components and general optical depths. However, the applications of such complex models are impractical when the frequency sampling of the SED is limited. More importantly, Blain et al. (2003) show that the added complexity, even if feasible, generally does not lead to appreciable differences in constraining the observed far-IR/submm SEDs. Note that the SED parameters estimated by adopting the single-temperature SED model are effective, brightness-weighted average values from complex mixtures of dust grains with different temperatures, properties and optical depths in the ISM.
Dust temperature profiles vary significantly for grain populations with distinctly different radii (i.e., a few submicrons versus tens of angstroms). The very small grains () undergo large temperature fluctuations on absorption of a photon (Sellgren et al. 1985), while the larger “standard” grains reach equilibrium temperatures, as determined by thermal equilibrium between absorption of UV/optical photons and emission of far-IR/submm photons (Greenberg 1978), i.e.,
| (2) |
where is the energy density of the incident radiation field. To derive the exact solution to Eq. (2), one would need to have accurate knowledge about the actual values at all frequencies - information that is lacking at present. At optical wavelengths, we know is relatively constant and near unity, and it is generally assumed that on average = 0.5 in the UV/optical in the numerical integration of the LHS of Eq. (2) (Martin 1978). While on the RHS of Eq. (2), (by the definition of the emissivity index ) at far-IR/submm wavelengths. For a uniform grain population, we thus have the approximate relation
| (3) |
where is the integrated incident flux, defined as , characterizing the strength of the incident radiation field 222 , where and are the Gamma and Riemann functions respectively. This formula is equivalent to that given by De Breuck et al. (2003)..
Accurate knowledge of the emissivity index, which characterizes the frequency dependence of the absorption coefficient of interstellar dust, is crucial for determining important large-scale characteristics of dusty galaxies, such as dust temperature, dust mass, and the existence of multiple dust components. Given that the emissivity index is a complex function of various grain properties, its estimate also offers insights into grain properties, particularly grain structure (Seki & Yamamoto 1980; Yang 2006) and formation of ice mantles (Aannestad 1975). While theory predicts values of 1 or 2 for interstellar dust in the long-wavelength limit, observations of astronomical objects in the far-IR/submm have revealed a wide range of values. Lower emissivity indices have been observed in active galactic environments, such as circumstellar disks and warm molecular clouds, as well as large-scale dust distributions in infrared luminous dusty galaxies (Knapp et al. 1993; Blake et al. 1996; Dunne et al. 2000). Far-IR emissivity that has a frequency dependence steeper than quadratic has also been observed in some galactic sources (Schwartz 1982; Lis et al. 1998). In particular, Dupac et al. (2003) reported a wide range in values, as well as a negative temperature dependence of , as observed in a large sample of Galactic molecular clouds.
2 Sample and Observations
Sources in this sample are mostly selected from the LIRG sample presented by Wynn-William & Becklin (WWB, 1993). The WWB sample, not being a strictly defined complete sample, includes 19 sources that were selected from the IRAS Point Source Catalog for their high luminosities and high flux densities at 12 and 25m. 16 sources here are selected from the WWB sample by requiring . In addition, two ULIRGs - UGC 5101 and Mrk 231 - are added to the list to better understand nearby infrared galaxies at the high luminosity end. In total, our sample includes 18 nearby LIRGs in the redshift range of . This sample, with its selection based on high luminosity and high flux densities at the IRAS wavebands, is likely to have an enhanced fraction of galaxies that are more active and contain warmer dust as compared to the bulk of the submm population at similar redshifts. A wealth of photometry data at far-IR/submm/mm wavelengths is available from the literature for a majority of the sources, which enables us to estimate both dust temperature and emissivity index in the SED fitting. Table 1 and Table 350m Observations of Local Luminous Infrared Galaxies and the Temperature Dependence of the Emissivity Index list the sample and the existing far-IR/submm/mm photometric data.
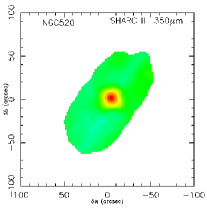
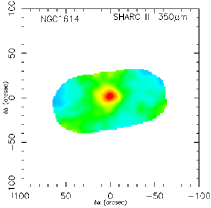
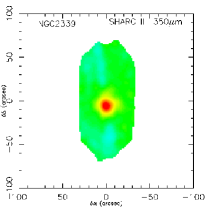
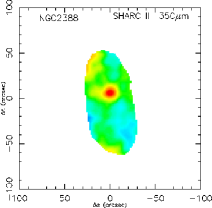
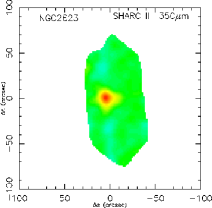
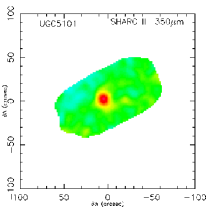
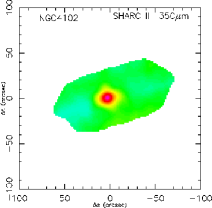
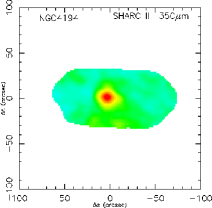
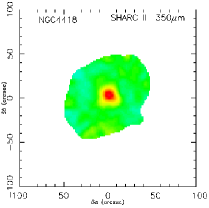
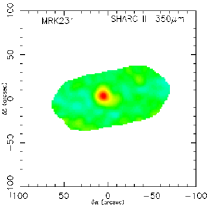
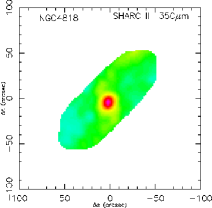
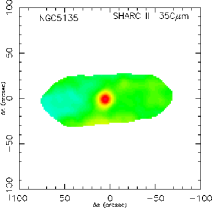
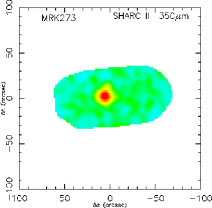
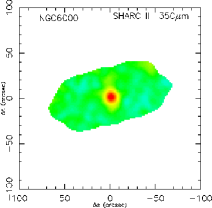
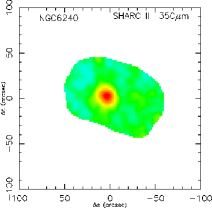
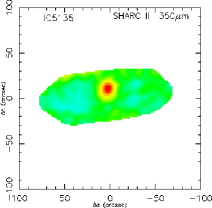
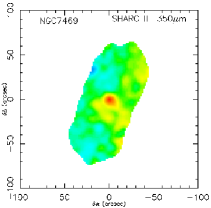
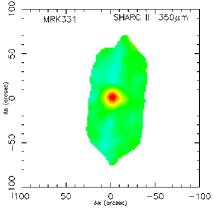
The observations were made during a series of SHARC-II (Dowell et al. 2003) observing runs from January 2003 to September 2004 at the CSO under moderate weather conditions (). Integration time varied from source to source, depending on the brightness of each source at 350m, and the atmospheric opacity and sky variability. On average, 0.5 hours of integration time was spent on each source. All measurements were made by scanning the bolometer array in a Lissajous pattern centered on each source; scans were taken without chopping the secondary mirror. Pointing and calibration scans were taken on an hourly basis on strong submillimeter sources. The absolute calibration was found to be accurate within 20% error margin. Raw data were reduced using the software package CRUSH (Kovács 2006), to obtain a 350m map and flux density for each source. All of the 18 sources were clearly detected at levels of , and Fig. 1 shows the SHARC-II 350m maps clipped to have at least half of the maximum exposure. Table 3 lists the 350m flux densities and flux errors.
3 Spectral Fits and Derived Quantities
We adopt the single-temperature, optically-thin far-IR/submm SED model, as given by Eq. (1). A flux error at a uniform 20% is assumed at each data point, hence each flux measurement is weighted equally in the nonlinear least squares fit. All but four galaxies (NGC 2388, NGC 4194, NGC 4818 and NGC 5135) in the sample have photometry data at far-IR/summ/mm wavelengths in addition to 60, 100 and 350m, thus the dust temperature and emissivity index can both be treated as free parameters. However, the SED fitting procedure introduces a significant degeneracy between the estimated values of and (Blain et al. 2003) - a problem that persists even when the frequency sampling of the far-IR/submm SED is highly redundant. To achieve redundancy in the cases of NGC 2388, NGC 4194, NGC 4818 and NGC 5135, where the sampling of the SED is limited to three wavelengths, we assume - a value most commonly assumed and observed.
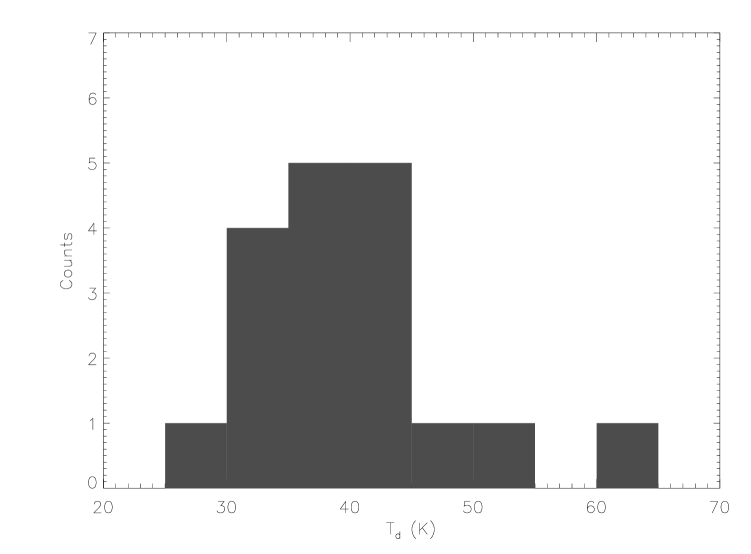
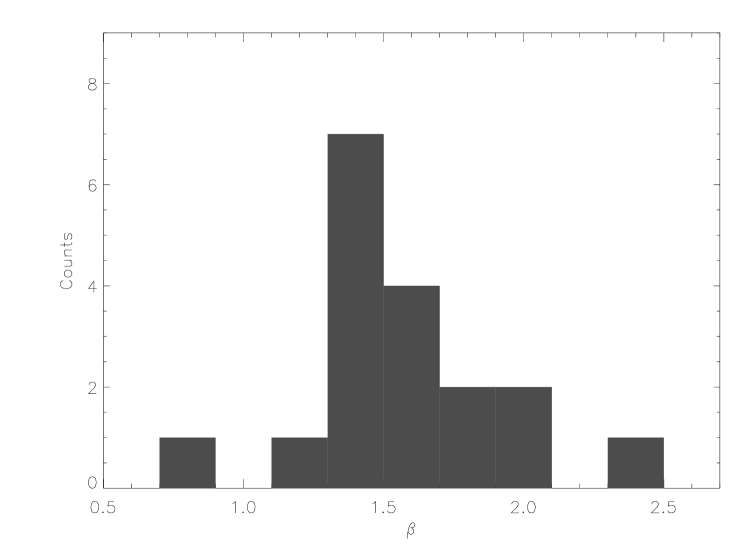
The best-fitting dust temperature has a sample median and standard deviation of and ranges within , with two galaxies (NGC 4418 and Mrk 231) showing . The emissivity index ranges within , and has a sample median of . The far-IR/submm SED fits of our local LIRG sample are shown in Fig. 2; the distributions of and are shown in Fig. 3.
The global far-IR luminosity () and dust mass () are calculated from
| (4) | |||||
| (5) |
where is the luminosity distance, and is the dust mass absorption coefficient, varying as . We adopt dust parameters given by Hildebrand (1983): , and , which implies . While there is significant uncertainty associated with , due to the lack of accurate knowledge of interstellar dust properties, is tightly constrained when a satisfactory SED fitting is achieved. The and values inferred for our local LIRG sample range within and , and have sample medians of and . Thus, our sample spans more than two orders of magnitude in both far-IR luminosity and dust mass. Table 3 lists the fitted values of and , along with the and estimates for our local LIRG sample.
4 - Relation
4.1 Correlation Coefficient & Simulations
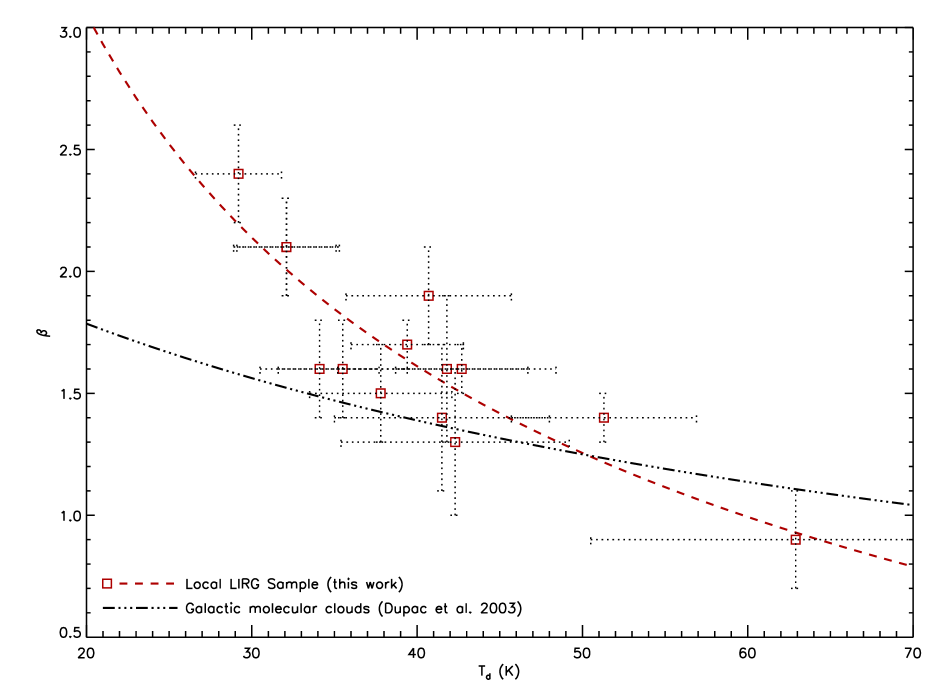
A negative correlation between the dust temperature and emissivity index clearly emerges from the - scatter plot for our local LIRG sample (Fig. 4). Note that, in the investigation of the - relation, we only include the 14 sources for which the frequency sampling is sufficient () to allow simultaneous estimates of and . The non-parametric correlation coefficient 333Without prior knowledge of the true distributions of dust temperature and emissivity index, the non-parametric (rank) correlation coefficient between these two variables provides a more robust correlation test than the parametric correlation coefficient (Press 1999). between the dust temperature and emissivity index estimated for our 14 local LIRGs is calculated to have a value of , and it is non-zero at the significance level of , where (Yang 2006). We thus conclude the inverse - correlation observed in our local LIRG sample is statistically significant.
However, we note that fitted values of and are simultaneously obtained from the SED fitting, in which a strong and negative - degeneracy is present and could potentially introduce an artificial inverse - correlation. We address this problem by repeatedly performing SED fittings on simulated photometric data. Our simulation method, described as follows, is a modification and extension of the simulation procedure performed by Dupac et al. (2002). First, we are primarily concerned with the non-parametric - correlation coefficient; second, the effects of the - degeneracy on the observed - correlation can be accurately quantified.
Two sets of independent, uniformly distributed random numbers are generated within the ranges of and , and they are taken to be the simulated values of and respectively for each of the 14 local LIRGs. Furthermore, we assume flux errors to be normally distributed and at a constant level of 20% at all wavelengths. Using the simulated values of , and measurement errors, simulated photometric data are calculated at all far-IR/submm wavelengths where observed data are available for each of the 14 sources in our local LIRG sample. SED fitting of the simulated photometric data for each source follows, yielding fitted values of and . We calculate non-parametric correlation coefficients between the “real” (simulated) as well as the fitted values of and in the sample.
The above steps are repeated many times (), and the probability distribution function of the non-parametric correlation coefficient between the dust temperature and emissivity index is thereby established. As shown in Fig. 5, of the simulated -show a distribution well approximated by a Gaussian function , as can be expected from the central limit theorem given that the simulated and are independent random variables. By contrast, of the fitted -roughly follows a Gaussian distribution , suggesting the SED fitting procedure typically introduces a non-parametric - correlation coefficient at the level of when and are in fact uncorrelated, given the SED frequency samplings of our 14 local LIRGs in the far-IR/submm/mm. Under the normal distribution , the observed - correlation coefficient, , is significant at the level of , where . Hence, we deem the negative - degeneracy in the SED fitting insufficient to explain the inverse - correlation observed in the local LIRG sample and conclude that the observed inverse - correlation is real.
4.2 Functional Fitting
Based on physical considerations, particularly Eq. (3), we fit the inverse - correlation observed in our local LIRG sample using the function
| (6) |
The best fit to Eq. (6) is
| (7) |
which provides a good fit to the dust temperatures and emissivity indices estimated for our 14 local LIRGs, as shown in Fig. 4. We also try two alternative functional forms in which the dust emissivity index is a power or hyperbolic function of the dust temperature, i.e.
| (8) | |||||
| (9) |
The best fits to Eqs. (8) and (9) are and respectively, and yield - curves nearly identical to Eq. (7). Thus, we consider Eq. (7) as the best description of the - relation observed in the local LIRG sample. This - relation is also tested in the SED fittings of a ULIRG sample at intermediate redshifts (, Yang 2006), for which the incorporation of the - relation (Eq. 7) leads to reasonable SED fits for the vast majority of the sources. This provides strong support for an extension of the - relation, as derived for our local LIRG sample, to dusty galaxies in the more distant Universe.
For comparative purpose, we also plot the - relation given by Dupac et al. (2003), as derived from multiband submm observations of a large sample of molecular clouds in the Galaxy (Fig. 4). These authors reported a wide range of and values estimated from SED fittings and found an inverse - correlation best fitted by a hyperbolic function . Clearly, the - correlation seen in the Galactic molecular clouds is significantly different from, in fact much flatter than, that observed in our local LIRG sample, despite the agreement in qualitative trend. We note that the and estimates for the molecular clouds are sometimes given by SED fittings without flux measurements at wavelengths shortward of the SED peaks, which would otherwise have greatly improved the accuracy of the estimates. The difference in the shape of the observed - correlations, as derived for astronomical samples of differing nature, scales and environments, is intriguing. We argue that variations in the - relation are not unreasonable, given that various physical characteristics, such as the radiation field, grain properties and grain distributions, could all impact the large-scale dust temperature and emissivity index, and thus the way in which and relate to each other. There is considerable observational challenge currently facing us in the task of achieving sufficient far-IR/submm/mm SED samplings, for a large number of dusty objects over a wide range in redshift, physical scale and environment. Dedicated observational efforts in the future would allow us to more precisely quantify the - relation, discover its full range and investigate its evolution.
4.3 Laboratory Results
Laboratory measurements of the absorption coefficients of interstellar grain analogs at submm/mm wavelengths have revealed an intrinsic temperature dependence of grain absorption coefficient and emissivity index (Agladze et al. 1996; Mennella et al. 1998). Agladze et al. (1996) measured absorption spectra of crystalline and amorphous grains at wavelengths ranging between 700m and 2.9 mm at temperatures between 1.2 and 30. The emissivity index was found to range between 1.2 and 2.5, and show a negative temperature dependence for amorphous grains at temperatures above 10. Mennella et al. (1998) measured absorption coefficients of crystalline and amorphous dust analog grains between 20m and 2 mm over the temperature range 24295. The temperature and wavelength domains covered in this set of laboratory experiments are probably more relevant for understanding astronomical observations at far-IR/submm wavelengths. The emissivity index, as well as its temperature dependence, was found to be sensitive to grain material and grain structure, and variations in the absorption coefficient and emissivity index were found to be more prominent in amorphous grains than in crystalline grains. These authors found a monotonic increase of the absorption coefficient with dust temperature, while the emissivity index was found to range from 0.5 to 2.3 and decrease as the dust temperature increases.
4.4 Explanations
We conclude the inverse - correlation observed in our local LIRG sample is statistically significant and physically real, and offer three possible explanations.
First, Eq. (3) tells us that the equilibrium dust temperature displays a negative dependence on the emissivity index, for a given radiation field and grain material.
Second, the grain emissivity index has intrinsic negative temperature dependence, as evidenced by laboratory measurements (§ 4.3). This effect can be understood by considering the Schlömann (1964) model which treats an amorphous solid as an ionic crystal with a random charge distribution. Within this framework, the absorption spectrum is dominated by photon-to-phonon coupling at all frequencies. We argue that the observed negative temperature dependence of grain emissivity index is attributed to the decreasing grain dimension () at higher temperatures (i.e., grain structure becomes more “open”) 444Here we adopt the concept of fractal dimension (Hausdorff dimension), defined as , where P/p is the size ratio of self-similar fractal objects and N is the number of smaller units that can fit into the larger unit. Structures with lower fractal dimension are more “open”., which results in a flatter frequency dependence of the phonon mode density and consequently lower emissivity indices at higher dust temperatures (Yang 2006).
Third, an inverse - relation can be caused by mixtures of non-uniform grain populations, particularly those involving very small grains or grains covered with ice mantles. values as high as 3.5 have been predicted for dust grains covered with ice mantles (Aannestad 1975), whereas very small grains are expected to have (Seki & Yamamoto 1980). At the same time, low dust temperatures favor formation of ice mantles and lead to strong emission at longer wavelengths, while high dust temperatures (or temperature fluctuations) in very small grains prohibit accretion of ice mantles and give rise to strong emission at shorter wavelengths. As a result, the dust temperature and emissivity index observed in the large-scale tend to move in the direction of low--high-when the overall dust emission is dominated by that of cold dust possibly covered with ice mantles, while and shift in the direction of high--low-when very small grains dominate the overall emission.
4.5 Applications
A - relation, if established over a wide range of dusty galaxies, would be extremely useful for modeling their observed far-IR/submm SEDs, as it effectively reduces the number of variables (therefore the number of required flux measurements) by one in the SED fitting. This effect is especially desirable for studying faint, distant submm sources and interpreting results from single submm wavelength imaging and deep field surveys, given the considerable observational challenge typically faced by deep submm observations. For a given photometric dataset, a - relation either allows the estimate of one more parameter in the SED fitting, or improves the uncertainties associated with the fitted variables, as exemplified by the SED modeling of a sample of intermediate-redshift ULIRGs (Yang 2006), for which the sampling of the far-IR/submm SED is limited to three wavelengths. By using the - relation, both the dust temperature and emissivity index can be fitted, which represents a major advance over the more conventional and commonly utilized SED modeling method, which, without the application of a - relation, would only fit for one of the two very important parameters.
5 Conclusion
We have observed and detected 18 local LIRGs () at 350m, using the SHARC-II camera at the CSO. The acquired 350m data, in combination with pre-existing far-IR/submm/mm photometric data, lead to accurate estimates of SED properties of these galaxies. We find sample medians of dust temperature (), emissivity index (), far-IR luminosity () and dust mass (). An inverse - correlation, best described by , is established for our local LIRG sample. This effect is most likely caused by intrinsic interdependence between the dust temperature and emissivity index as physical parameters, as revealed by laboratory measurements (§ 4.3), as as well as variations in grain properties in the ISM. The establishment of a - relation is extremely useful in the far-IR/submm SED fittings of dusty galaxies, as it serves to effectively reduce the number of free parameters by one in the SED function.
References
- Aannestad (1975) Aannestad P., 1975, ApJ, 200, 30
- Agladze et al. (1996) Agladze N., Sievers A., Jones S., Burlitch J., Beckwith S., 1996, ApJ, 462, 1026
- Benford (1999) Benford D., 1999, Caltech Ph.D. Thesis
- Blain et al. (2003) Blain A., Barnard V., Chapman S., 2003, MNRAS, 338, 733
- Blake et al. (1996) Blake G., Mundy L., Carlstrom J., Padin S., Scott S., Scoville N., Woody D., 1996, ApJ, 472, L49
- Bohren & Huffman (1983) Bohren C., Huffman D., 1983, Absorption and Scattering of Light by Small Particles
- Dowell et al. (2003) Dowell C., Allen C., Babu R., Freund M., Gardner M., Groseth J., Jhabvala M., Kovács A., Lis D., Moseley S., Phillips T., Silverberg R., Voellmer G., Yoshida H., 2003, SPIE, 4855, 73
- Dunne et al. (2000) Dunne L., Eales S., Edmunds M., Ivison R., Alexander P., Clements D., 2000, MNRAS, 315, 115
- Dupac et al. (2003) Dupac X., Bernard J., Boudet N., Giard M., Lamarre J., Mény C., Pajot F., Ristorcelli I., Serra G., Stepnik B., Torre J., 2003, A&A, 404, L11
- Greenberg (1978) Greenberg J., 1978, in McDonnell J. (ed.), Cosmic Dust
- Hildebrand (1983) Hildebrand R., 1983, QJRAS, 24, 267
- Kittel (1976) Kittel C., 1976, Introduction to Solid State Physics
- Knapp et al. (1993) Knapp G., Sandell G., Robson E., 1993, ApJS, 88, 173
- Kovács (2006) Kovács A., 2006, Caltech Ph.D. Thesis
- Lis et al. (1998) Lis D., Serabyn E., Keene J., Dowell C., Benford D., Phillips T., Hunter T., Wang N., 1998, ApJ, 509, 299
- Mennella et al. (1998) Mennella V., Brucato J., Colangeli L., Palumbo P., Rotundi A., Bussoletti E., 1998, ApJ, 496, 1058
- Press (1999) Press W., 1999, Numerical Recipes
- Roche & Chandler (1993) Roche P., Chandler C., 1993, MNRAS, 265, 486
- Schwartz (1982) Schwartz P., 1982, ApJ, 252, 589
- Schlömann (1964) Schlömann E., 1964, PhRvA, 135, 413
- Seki & Yamamoto (1980) Seki J., Yamamoto T., 1980, Ap&SS, 72, 79
- Wynn-William & Becklin (1993) Wynn-William C., Becklin E., 1993, ApJ, 412, 535
- Yang (2006) Yang M., 2006, Caltech Ph.D. Thesis
| Source Name | RA | Dec | |||
|---|---|---|---|---|---|
| J2000 | J2000 | Jy | Jy | ||
| NGC 520 | 01h24m35.1s | +03d47m33s | 0.007609 | 30.37 | 46.15 |
| NGC 1614 | 04h33m59.8s | -08d34m44s | 0.015938 | 33.02 | 34.35 |
| NGC 2339 | 07h08m20.5s | +18d46m49s | 0.007358 | 18.45 | 31.46 |
| NGC 2388 | 07h28m53.4s | +33d49m09s | 0.013790 | 17.03 | 25.33 |
| NGC 2623 | 08h38m24.1s | +25d45m17s | 0.018463 | 23.80 | 26.66 |
| UGC 5101 | 09h35m51.6s | +61d21m11s | 0.039390 | 12.24 | 20.25 |
| NGC 4102 | 12h06m23.1s | +52d42m39s | 0.002823 | 47.04 | 73.84 |
| NGC 4194 | 12h14m09.6s | +54d31m36s | 0.008359 | 24.09 | 26.06 |
| NGC 4418 | 12h26m54.6s | -00d52m39s | 0.007268 | 45.58 | 31.99 |
| Mrk 231 | 12h56m14.2s | +56d52m25s | 0.042170 | 33.28 | 30.29 |
| NGC 4818 | 12h56m48.9s | -08d31m31s | 0.003552 | 20.32 | 26.72 |
| NGC 5135 | 13h25m44.0s | -29d50m01s | 0.013716 | 16.93 | 30.72 |
| Mrk 273 | 13h44m42.1s | +55d53m13s | 0.037780 | 23.09 | 21.97 |
| NGC 6000 | 15h49m49.5s | -29d23m13s | 0.007315 | 36.48 | 51.76 |
| NGC 6240 | 16h52m58.9s | +02d24m03s | 0.024480 | 22.87 | 27.21 |
| IC 5135 | 21h48m19.5s | -34d57m05s | 0.016151 | 16.36 | 26.19 |
| NGC 7469 | 23h03m15.6s | +08d52m26s | 0.016317 | 26.49 | 36.15 |
| Mrk 331 | 23h51m26.8s | +20d35m10s | 0.018483 | 18.30 | 23.44 |
Note. — Given by NASA Extragalactic Database (NED).
| Source Name | far-IR/submm/mm Photometric Data |
|---|---|
| Jy | |
| NGC 520 | |
| NGC 1614 | |
| NGC 2339 | |
| NGC 2388 | |
| NGC 2623 | |
| UGC 5101 | |
| NGC 4102 | |
| NGC 4194 | |
| NGC 4418 | |
| Mrk 231 | |
| NGC 4818 | |
| NGC 5135 | |
| Mrk 273 | |
| NGC 6000 | |
| NGC 6240 | |
| IC 5135 | |
| NGC 7469 | |
| Mrk 331 |
Note. — Given by NED unless noted otherwise.
References. — (a) Benford 1999; (b) Roche & Chandler 1993.
| Source Name | log | log | ||||||
|---|---|---|---|---|---|---|---|---|
| Jy | Jy | |||||||
| NGC 520 | 3.01 | 0.02 | 37.8 | 4.3 | 1.5 | 0.2 | 10.76 | 6.94 |
| NGC 1614 | 1.18 | 0.05 | 40.7 | 5.0 | 1.9 | 0.2 | 11.37 | 7.30 |
| NGC 2339 | 1.78 | 0.04 | 32.1 | 3.2 | 2.1 | 0.2 | 10.54 | 7.01 |
| NGC 2388 | 1.87 | 0.10 | 37.9 | 3.2 | 1.5 | - | 11.03 | 7.21 |
| NGC 2623 | 1.43 | 0.05 | 41.8 | 6.6 | 1.6 | 0.3 | 11.38 | 7.32 |
| UGC 5101 | 2.20 | 0.10 | 34.1 | 3.6 | 1.6 | 0.2 | 11.86 | 8.27 |
| NGC 4102 | 4.38 | 0.04 | 32.1 | 3.0 | 2.1 | 0.2 | 10.10 | 6.56 |
| NGC 4194 | 1.19 | 0.03 | 45.3 | 4.7 | 1.5 | - | 10.68 | 6.47 |
| NGC 4418 | 2.03 | 0.07 | 62.9 | 12.4 | 0.9 | 0.2 | 10.81 | 6.14 |
| Mrk 231 | 1.73 | 0.07 | 51.3 | 5.6 | 1.4 | 0.1 | 12.24 | 7.79 |
| NGC 4818 | 2.73 | 0.05 | 36.0 | 3.2 | 1.5 | - | 9.91 | 6.20 |
| NGC 5135 | 3.80 | 0.07 | 33.0 | 2.6 | 1.5 | - | 11.10 | 7.59 |
| Mrk 273 | 1.34 | 0.08 | 42.7 | 4.0 | 1.6 | 0.1 | 11.98 | 7.88 |
| NGC 6000 | 4.26 | 0.20 | 29.2 | 2.6 | 2.4 | 0.2 | 10.81 | 7.48 |
| NGC 6240 | 1.10 | 0.05 | 39.4 | 3.4 | 1.7 | 0.1 | 11.64 | 7.69 |
| IC 5135 | 2.16 | 0.10 | 35.5 | 3.9 | 1.6 | 0.2 | 11.17 | 7.49 |
| NGC 7469 | 2.23 | 0.20 | 42.3 | 6.9 | 1.3 | 0.3 | 11.35 | 7.31 |
| Mrk 331 | 1.69 | 0.04 | 41.5 | 6.5 | 1.4 | 0.3 | 11.29 | 7.30 |
Note. — =1.5 is assumed in the SED fitting for NGC 2388, NGC 4194, NGC 4818 and NGC 5135. The luminosity distance used in the calculation of the far-IR luminosity is derived from the redshift, by assuming a flat cosmology with , and .
 |
 |
 |
 |
 |
 |
 |
 |
 |
 |
 |
 |
 |
 |
 |
 |
 |
 |
 |
 |
 |
 |
 |
 |
 |
 |
 |
 |
 |
 |
 |
 |
 |
 |
 |
 |