350m Observations of Ultraluminous Infrared Galaxies at Intermediate Redshifts
Abstract
We present 350m observations of 36 ultraluminous infrared galaxies (ULIRGs) at intermediate redshifts () using the Submillimeter High Angular Resolution Camera II (SHARC-II) on the Caltech Submillimeter Observatory (CSO). In total, 28 sources are detected at , providing the first flux measurements longward of 100m for a statistically significant sample of ULIRGs in the redshift range of . Combining our 350m flux measurements with the existing IRAS 60 and 100m data, we fit a single-temperature model to the spectral energy distribution (SED), and thereby estimate dust temperatures and far-IR luminosities. Assuming an emissivity index of = 1.5, we find a median dust temperature and far-IR luminosity of = 42.87.1and log (/) = 12.20.5, respectively. The far-IR/radio correlation observed in local star-forming galaxies is found to hold for ULIRGs in the redshift range , suggesting that the dust in these sources is predominantly heated by starbursts. We compare the far-IR luminosities and dust temperatures derived for dusty galaxy samples at low and high redshifts with our sample of ULIRGs at intermediate redshift. A general - relation is observed, albeit with significant scatter, due to differing selection effects and variations in dust mass and grain properties. The relatively high dust temperatures observed for our sample compared to that of high- submillimeter-selected starbursts with similar far-IR luminosities suggest that the dominant star formation in ULIRGs at moderate redshifts takes place on smaller spatial scales than at higher redshifts.
1 Introduction
Dust grains in the interstellar medium (ISM) of galaxies are heated by various energy sources in vastly different physical environments: the diffuse interstellar radiation field, active star formation and active galactic nuclei (AGN). The bulk of the emission from heated dust grains occurs at far-IR and submillimeter (submm) wavelengths, and can account for a significant, if not dominant, fraction of the total energy output from dust-enshrouded galaxies where extinction and re-radiation by dust lead to high IR-to-optical flux ratios.
In the latter category we find the population of ULIRGs (), which were first discovered in large numbers in the local Universe by IRAS (Soifer et al. 1986). These galaxies harbor vast amounts of dust, responsible for obscuring most of the intense star formation and AGN activity that are taking place. Observations in the optical/near-IR as well as of rotational CO line emission revealed that ULIRGs tend to be associated with interacting or merging gas-rich disks, with the more luminous being the more disturbed and morphologically complex systems (Sanders & Mirabel 1996), thus suggesting that ULIRGs are driven by mergers in which gas is funneled towards the central regions, fueling an intense starburst and/or a black hole. While local () ULIRGs are believed to re-enact some of the processes relevant for galaxy formation at high redshifts, it is essential that studies of ULIRGs over a wide redshift range are carried out, in order to get a complete picture of how the most massive galaxies formed as a function of redshift. At high redshifts (), the population of optically faint radio sources – which includes (sub)mm-selected galaxies (SMGs) uncovered by scuba and mambo (Smail et al. 1997; Hughes et al. 1998; Bertoldi et al. 2000; Carilli et al. 2001) as well as the population of optically faint 24m sources selected with Spitzer (Papovich et al. 2004) – is thought to represent the high- analogues of local ULIRGs.
In contrast to the populations of local and distant ULIRGs, the population at intermediate redshifts () remains virtually unexplored at far-IR/submm wavelengths. This intermediate redshift interval is of particular interest as it bridges the gap between the distant and local ULIRG populations, and broadly marks the transition period where ULIRGs cede their position to the less extreme luminous infrared galaxies (LIRGs – ) as the dominating contributor to the co-moving IR luminosity density (Le Floc’h et al. 2005). In addition, the cosmic infrared background (CIRB – Hauser et al. 1998; Schlegel et al. 1998), which peaks at 150m and constitutes about half of the total energy density in the Universe, is dominated by emission from (U)LIRGs in the above intermediate redshifts range (Lagache et al. 2005).
In this paper we present 350m observations of a statistically significant sample of 36 ULIRGs in the intermediate redshift range . Throughout this paper we adopt a flat cosmology with , and .
2 The Sample
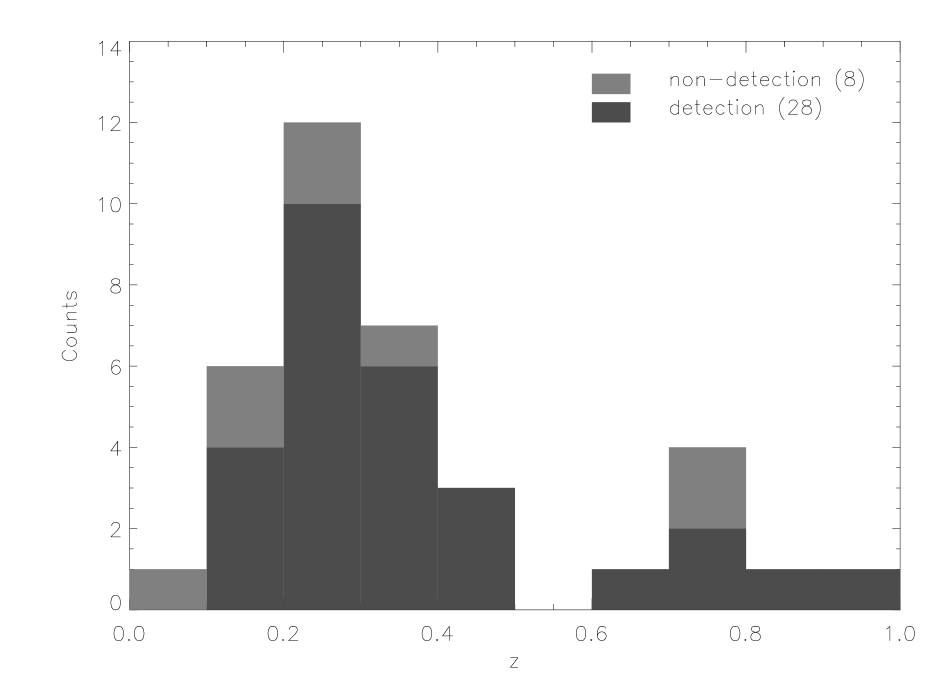
Our sample is a subset of the FSC-FIRST (FF) catalog (Stanford et al. 2000), which was compiled by cross-correlation between the IRAS Faint Source Catalog (FSC – Moshir et al. 1992) and the Faint Images of the Radio Sky at Twenty (FIRST – Becker et al. 1995), and consists of 108 ULIRGs for which spectroscopic redshift information and -band imaging were successfully obtained. Situated in the redshift range of , the FF sources constitute a well defined and statistically significant sample of ULIRGs at intermediate redshifts. Only sources with secure IRAS detections at both 60 and 100 m were considered for 350 m observations, with no flux cutoff employed at either waveband. The fact that virtually no other far-IR/submm continuum data points exist longward of 100 m for the FF sources, makes our 350m flux measurements extremely valuable for attaining meaningful estimates of the SEDs. Furthermore, the availability of the spectroscopic redshift information allows accurate estimates of dust temperatures and far-IR luminosities. Finally, we note that targeted observations at 350m were made possible due to the positional accuracy provided by the existing radio observations. This is highly desirable for far-IR/submm observations given the limited angular resolution currently available to telescopes working in this wavelength range. In total, we observed 36 sources in the FF catalog at 350m, which are listed in Table 1, along with their redshifts and flux densities at 60 m, 100m and 1.4 GHz. The redshift distribution of our sample, having a sample median of 0.366, is shown in Fig. 1.
There are a few selection biases possibly present in the FF catalog. First, high-redshift galaxies are potentially underrepresented due to the adverse -correction at 60m and 1.4 GHz. Second, since the FSC is a flux-limited sample (the 60 m cutoff flux density is Jy – Moshir et al. 1992), the selection function is sensitive to dust temperature and biased against galaxies with low dust temperatures. Third, galaxies with enhanced AGN activity are probably overrepresented in the sample, since such sources are expected to be more luminous (Genzel et al. 2000).
3 Observations
The observations were made during a series of SHARC-II (Dowell et al. 2003) observing runs from January 2003 to September 2004 at the CSO under excellent weather conditions ( 0.06). Integration time varied from source to source, depending on the brightness of each source at 350m, atmospheric opacity and sky variability. On average, 1.5 hours of integration time was spent on each source. All measurements were made by scanning the bolometer array in a Lissajous pattern centered on each source. With the exception of FF 07382856, FF 07582851, and FF 08043919, scans were taken without chopping the secondary mirror. Pointing and calibration scans were taken on an hourly basis on strong, point-like submillimeter sources. SHARC-II raw data - taken on both calibration and science sources - were reduced by using the software package CRUSH (Kovács 2006), with the same “crush” option “-deep”. Every single calibration scan was reduced individually, to obtain a 350m map and flux density. The instrument flux was compared to the true flux111Available from http://www.submm.caltech.edu/sharc/, and a calibration factor, defined as , was calculated. We also applied the built-in CRUSH utility “calibrate” to the 350m calibrator map, to have a measure of the actual beam size (FWHM). All X factors and FWHM values thereby estimated were complied for each evening, from which calibration scans that yielded and were deemed reliable, and thus selected to form a subset. Finally, the sample median of the factor subset is taken as the factor appropriate for use to reduce science scans taken on the same evening. The calibration accuracy, as measured by the standard deviation of the factor subset, was found to be generally within 20%. Consistent calibrated flux measurements were also found between the chopped and unchopped observations.
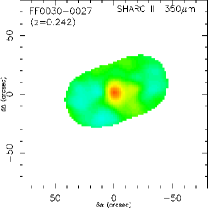
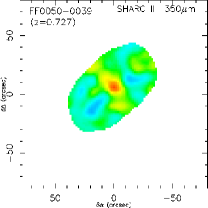
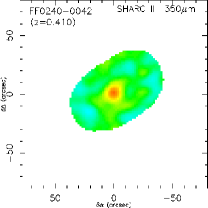
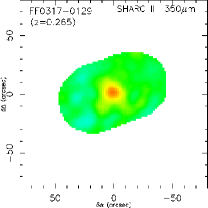
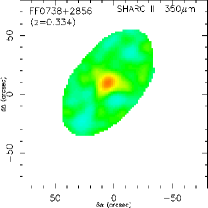
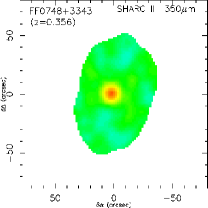
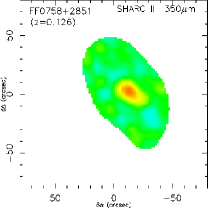
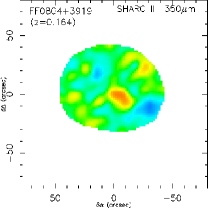
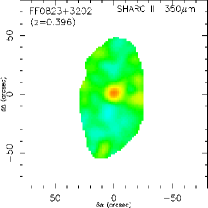
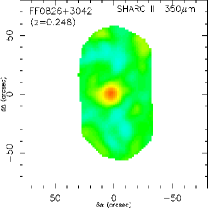
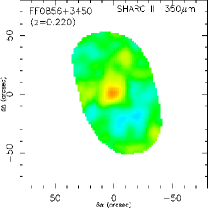
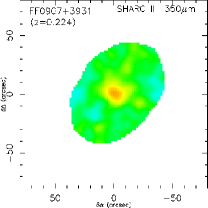
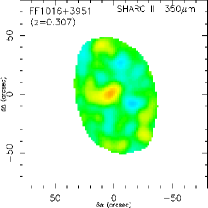
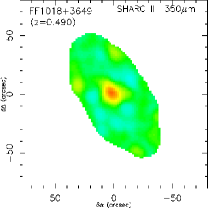
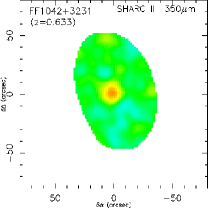
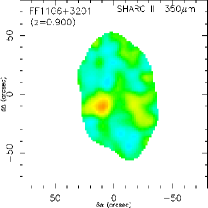
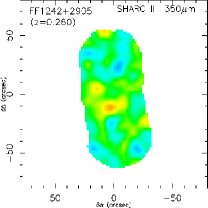
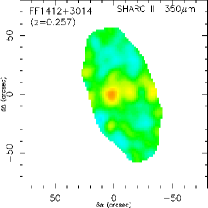
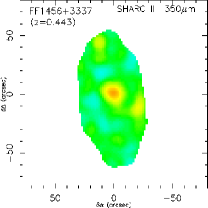
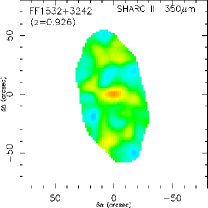
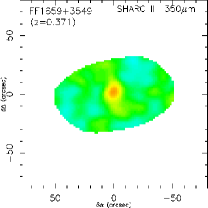
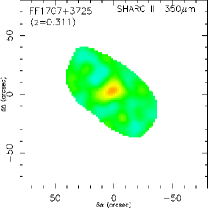
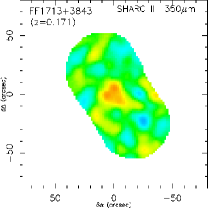
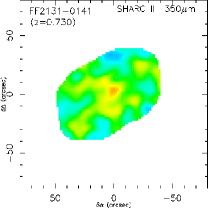
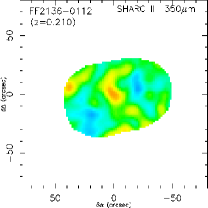
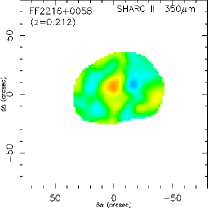
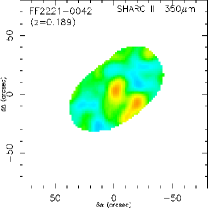
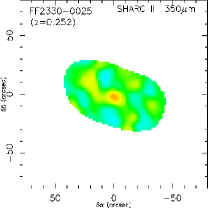
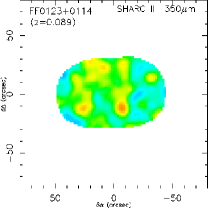
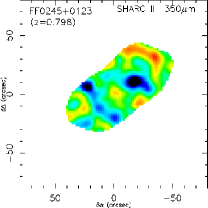
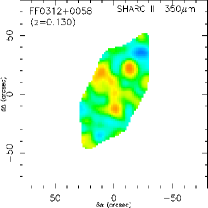
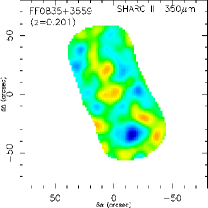
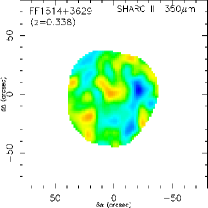
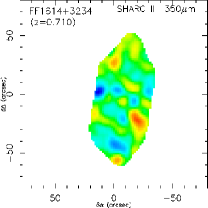
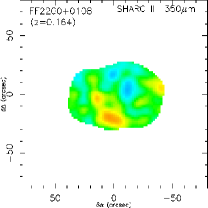
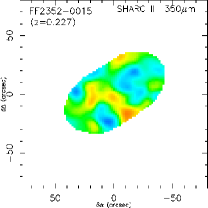
In total, 28 out of the 36 sources in our sample were detected with signal-to-noise ratios . This high detection rate (78%) demonstrates the effectiveness of SHARC-II for studying faint 350m sources at the mJy level. Other than the IRAS data, the present results at 350m are the first reported detections of FF sources at submm wavelengths longward of 100m, except for FF 15323242 and FF 16143234 which were previously observed at 90 and 180m by Verma et al. (2002), and at 850m by Farrah et al. (2002) respectively. Table 1 lists the 350m flux measurements of the FF sources selected for SHARC-II observations. The final 350 m signal maps smoothed with a 9FWHM beam are shown in Figs. 2 and 3.
4 Spectral Fits and Derived Quantities
We adopt the single-temperature, optically-thin far-IR/submm SED model (Hildebrand 1983)
| (1) |
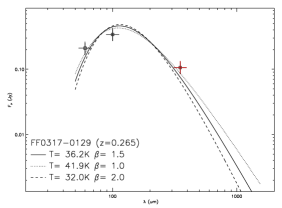
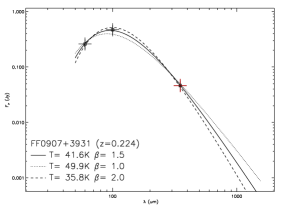
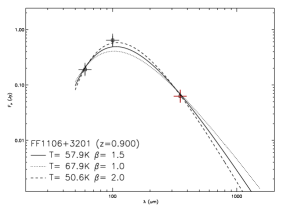
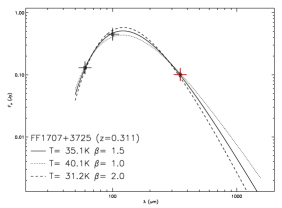
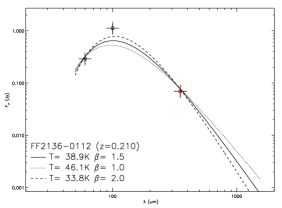
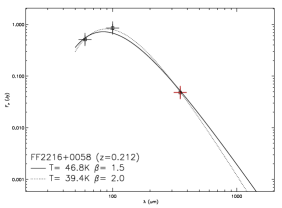
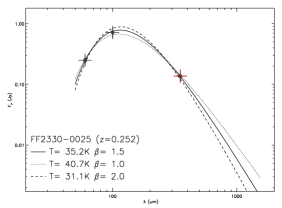
where is the dust temperature, is the absorption coefficient and is the emissivity index. A flux error at a uniform 20% level is assumed at each data point 222Although the IRAS 100 m measurement are probably less reliable than the 60 and 350 m data points., hence each flux measurement is weighted equally in the nonlinear least squares fit. It is not possible to fit both and as free parameters due to the paucity of available data points. Additionally, the negative - degeneracy in the SED fitting procedures (Blain et al. 2003) often renders simultaneous estimates of and problematic. To achieve redundancy, we fit three SED curves for each source in our sample with fixed to 1.0, 1.5 and 2.0. The fitted SEDs for each source are overplotted (Fig. 4) whenever convergence can be achieved by the fitting procedure. values favored by the observed photometric data points differ from source to source, suggesting real differences in emissivity index among the galaxies. The negative - degeneracy is also clearly manifested in Fig. 4, which shows that higher estimates of are always associated with lower values assumed for . We assume - a value most commonly assumed and observed - to estimate effective dust temperature and derive physical quantities in later analysis and discussion (Table 1).
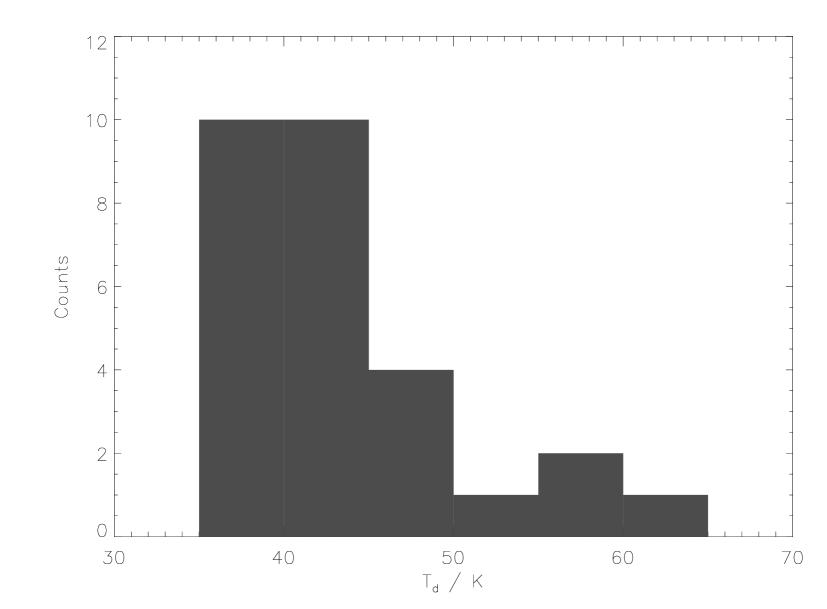
The best-fitting dust temperatures in the SHARC-II detected FF sample, with assumed to be 1.5, are found to range within a wide band of , with a sample median and standard deviation . A histogram of is shown in Fig. 5. All SHARC-II detected FF galaxies have values in the range of 35 to 50, except for four sources - FF 00500039 (=0.727), FF 10423231 (=0.633), FF 11063201 (=0.900), FF 15323242 (=0.926) - that have . The apparent absence of low--high- galaxies within the sample could at least in part be caused by the selection effects inherent to the FF catalog, while the lack of high--low- (effectively high--low-) galaxies in the sample most likely reflects real properties of the ULIRG population.
The global far-IR luminosities () and dust masses () are calculated using
| (2) | |||||
| (3) |
where is the luminosity distance, and is the dust mass absorption coefficient, varying as . We adopt dust parameters given by Hildebrand (1983): , and , which implies . While there are significant uncertainties associated with , due to the lack of accurate knowledge of interstellar dust properties, the inferred far-IR luminosities are tightly constrained as long as a satisfactory SED fit is achieved. The and values derived for our sample lie in the ranges and , respectively, with sample medians of and . Thus, our sample spans nearly two orders of magnitude in far-IR luminosity, and more than an order of magnitude in dust mass.
If the far-IR luminosity originates from warm dust heated by massive, short-lived stars, which we argue in §5.1 is the case for majority of our sources, it provides a measure of the instantaneous star formation rate (SFR) in these galaxies. Adopting the calibration factor given by Kennicutt (1998), we have
| (4) |
where is integrated over the wavelength range of m, characterizes the percentage energy contribution to far-IR luminosity by massive young stars (), and accounts for integrated flux shortward of 40m (). Using the estimated value of (from Eqs. 7 and 8), we find the median star formation rate of our sample is . The implied star formation rates are thus orders of magnitude higher than what is typically observed in in normal quiescent galaxies (Kennicutt 1998), but comparable to that of the local ULIRG Arp 220 ( – Dopita et al. 2005). Such intense starbursts can be induced by strong tidal interactions, a scenario consistent with high-resolution radio and near-IR observations of the FF catalog that reveal morphological features typical of strong interacting/merging systems for the majority of the sources (Stanford et al. 2000).
5 Discussion
5.1 Far-IR/Radio Correlation
A tight far-IR/radio correlation is known to hold for a wide range of star-forming galaxies in the local Universe (Condon 1992). This is explained by the fact that radio emission at is thought to arise mainly from nonthermal synchrotron emission of cosmic electrons that are released by supernovae explosions of massive young stars, thus radio emission is expected to be proportional to the present star formation rate, as is far-IR emission. Whether and how this far-IR/radio correlation might evolve with galaxy characteristics and redshift remains an open question at the present, partly due to the substantial observational efforts involved to compile the relevant information (i.e., multiband far-IR/submm fluxes, 1.4 GHz radio flux, and precise spectroscopic redshifts) for a large number of galaxies at intermediate and high redshifts. Our sample of SHARC-II detected FF sources, having the complete information mentioned above, constitutes a statistically significant sample that is suitable for a meaningful investigation of the far-IR/radio correlation at moderate redshifts .
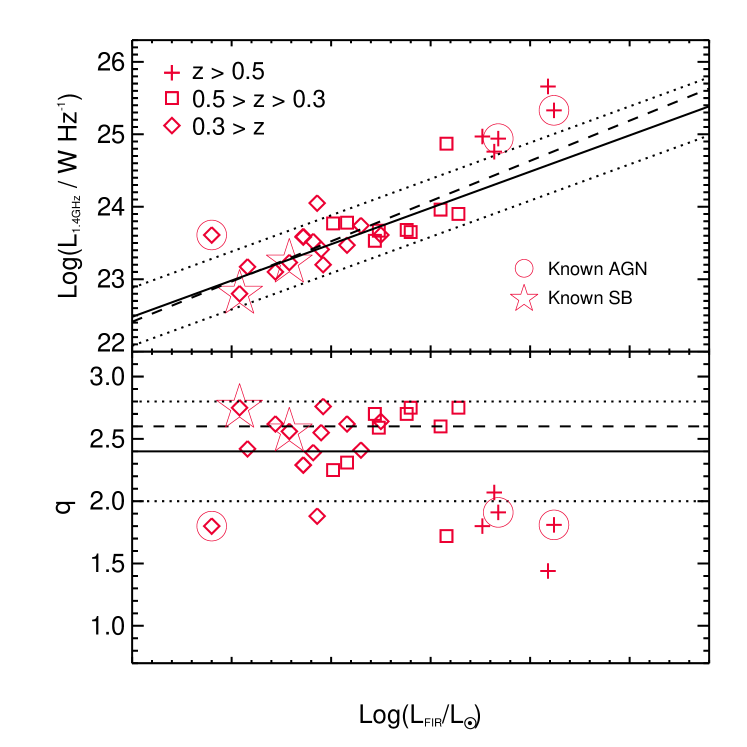
The far-IR/radio correlation for our sample is plotted in Fig. 6a. Note that the correlation is investigated over the full far-IR/submm wavelength range of m. The far-IR/radio correlation is often expressed in terms of the logarithmic far-IR/radio flux ratio (Helou et al. 1985), defined as
| (5) |
where is the 1.4 GHz (rest-frame) radio luminosity. Accounting for both the -correction, through , and the bandwidth compression by a factor of , we have
| (6) |
where , defined by , is the radio spectral index. Realistic constraints on are not currently available for the FF sample due to the lack of multi-wavelength radio measurements. We therefore assume a constant value of in the spectral domain near 1.4 GHz - a value that is appropriate when synchrotron emission is dominant (Condon 1992). Following Eqs. (5) and (6), and using rest-frame , we have derived for each source in our sample of SHARC-II detected ULIRGs (Table 1). A broad range in values are found (), with a sample median of . The distribution of values for our sample is shown in Fig. 6b. Of the entire sample, 21 sources (75%) have values within of the median value, while the seven remaining outliers all have , suggesting that they might be radio-loud AGNs. We note that four of the seven outliers are at and five have , which is most likely caused by the selection biases in our sample that favor radio-loud, luminous objects with enhanced AGN activity at high redshifts (§2). The suspected AGN fraction of 25% is also roughtly consistent with the 10% found for the entire FF sample, and with the trend of an increasing AGN fraction with FIR-luminosity as noted by Stanford et al. (2000). We therefore exclude the seven sources in the investigation of the far-IR/radio correlation by setting a lower bound of . To check this approach we have searched the literature for independent AGN/starburst classification for our sources. In total, classifications are found for six sources (Stanford et al. 2000; Zakamska et al. 2004; Best et al. 2005; Best private communications), of which three are classified as AGNs (FF 00500039, FF 08043919 and FF 15323242) and three as starbursts (FF 00300027, FF 09073931 and FF 22210042). The three known AGNs have , while the three known starbursts are within of our median value, in agreement with our lower cut in . However, we wish to note that a systematic change in the radio slope would have a direct impact on the estimated values. For instance, Ivison et al. (private communications) have suggested that SMGs might have shallower synchrotron slopes than ”non-SMG” radio sources. In this scenario, values estimated by assuming would be underestimated, with the underestimates in being more severe at higher redshifts. As such, the very low values () characteristic of the high- () sources in our sample could also be caused by actual radio slopes that are flatter than the assumed value of 0.7 in these sources.
The remaining 21 sources with show a very tight far-IR/radio correlation (Fig. 6b), with a sample median of . We wish to compare the far-IR/radio correlation observed at intermediate redshifts to that in the local Universe, for which values are found to be bound within a narrow range , with the far-IR luminosity defined to cover the wavelength range of m (Condon et al. 1991). To account for the difference in the wavelength integration range, we adopt estimates given by Soifer & Neugebauer (1991)
| (7) | |||||
| (8) |
from which we derive
| (9) |
The local far-IR/radio correlation as given by Condon et al. (1991) can thus be recast into values with a median and scatter , in excellent agreement with the values calculated for our sample of intermediate redshift ULIRGs. Furthermore, a fit to log () and log () inferred for our sample yields a slope of , which is also consistent with that of the local correlation ( - Condon et al. 1991).
Thus, we conclude that our derived far-IR/radio correlation in the redshift range matches very well with that of the present day, suggesting that the correlation does not evolve significantly from to . This supports the notion that dust heating in the intermediate-redshift ULIRGs originates predominantly from star formation, with modest contribution to the far-IR luminosity from old stellar populations and AGNs. Unfortunately, we cannot confidently extend this conclusion to , since four out of the five sources in our sample at were discarded on suspicion of being radio-loud AGNs, albeit the possibility of flatter radio slopes in the high- sources. Second, we find no evidence of an increase in the scatter of the correlation with redshift. Our study validates the approach by Appleton et al. (2004), in which Spitzer m data are -corrected in a model-dependent manner to derive the full far-IR luminosities for sources out to . Such confirmation is important, allowing further speculation with a single flux density measurement.
5.2 Luminosity-Temperature Relation
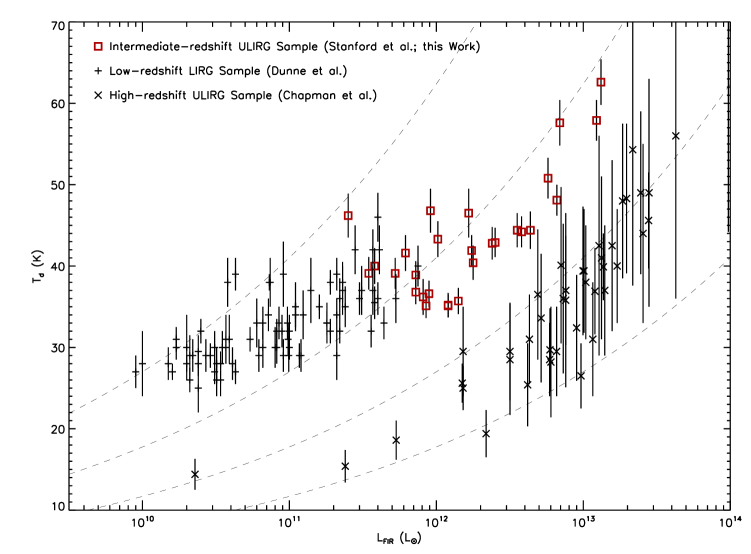
The far-IR luminosities and dust temperatures inferred for our sample are plotted against each other in Fig. 7. For comparison, we have also plotted and values compiled by Blain et al. (2004) for samples of luminous infrared galaxies at low and high redshifts. In the case of the low- sample, 60, 100 and 850m data are available and utilized in the SED fitting (Dunne et al. 2000). By contrast, and values of the high-redshift sample are derived by assuming the far-IR/radio correlation (Chapman et al. 2003; Chapman et al. 2005), which has been subsequently confirmed by Kovács et al. (2006).
Taken at face value, each sample exhibits an overall trend between and , where sources with large far-IR luminosities having, in general, higher dust temperatures. This trend can be understood in terms of the approximate relation
| (10) |
where is the dust mass absorption coefficient normalized at some reference frequency 333 , where and are the Gamma and Riemann functions respectively. This formula is equivalent to that given by De Breuck et al. (2003). With the normal range of , is nearly flat while varies rapidly. Therefore the approximation as stated in Eq. (10) is valid when variations in are negligible.. However, there is significant scatter in the - relation, due to variations in the dust emissivity, as well as in the amount of dust in each galaxy.
Although significant scatter in for a given exists for galaxies within each sample, Fig. 7 reveals systematic shifts between the three samples shown. In terms of dust temperature, the low- sample spans a fairly narrow range ( K) with a median temperature of K (Dunne et al. 2000). The latter is consistent with the median temperatures found for our sample (K) and the SMGs (K – Chapman et al. 2005), although the latter two span a larger range of temperatures. In particular, we notice that all sources in our sample have K, whereas 30% of the SMGs have dust temperatures below K. Furthermore, there are four sources in our sample for which we can confidently say they have dust temperatures above K, while all SMGs are consistent with having K given their large error bars. Thus, it seems that our sample overall consists of sources with somewhat warmer dust than both the local and high- sample. Assuming the dust emissivity properties in starburst galaxies do not change substantially as a function of redshift, and by Eq. (10), SMGs thus appear to contain cooler but considerably larger amounts of dust than (U)LIRGs at low and moderate redshifts (Fig. 7). This is consistent with observations of CO rotational line emission in bright SMGs, which have revealed that they are very massive systems, having at least four time more molecular gas than that in local ULIRGs (Neri et al. 2003; Greve et al. 2005). We argue the observed difference can be explained as the combined effects of selection effects and intrinsic evolution in the ULIRG population as a function of redshift.
First, the very high far-IR luminosities characteristic of the high- SMG sample can be caused by the flux cut-offs of present-day submm and radio surveys, which limit the detections of high- sources with . Second, by virtue of their selection at submm wavelengths, the SMGs are naturally biased in favor of cooler dust temperatures. This has been confirmed by recent Spitzer imaging, which shows that the vast majority (%) of the Spitzer detected SMGs have near-IR/mid-IR properties typical of cold, starburst-like ULIRGs (Egami et al. 2004). However, it has been suggested that a significant population of optically faint radio galaxies (OFRGs), which so far have remained undetected by current 850 m surveys due to their warmer dust (K), might exist and constitute an extension of SMGs to warmer temperatures (Chapman et al. 2004b). OFRGs are luminous in the radio and the 24 m wavebands, and it seems our intermediate redshift sample, being select by IRAS, might be more representative of OFRGs than SMGs. Finally, the existence of low-to-intermediate redshift (U)LIRGs with cool dust temperatures cannot be ruled out, since such sources are unlikely to have made it into the 60 and 100m IRAS-selected samples of local (U)LIRGs. The selection biases are more severe for the intermediate-redshift sample than for the local sample, as predicted by the shape of the -correction at these wavebands. Unbiased wide surveys with SCUBA-II and Herschel at m are expected to uncover cool sources at if they exist, thus allowing for a more direct comparison with the high- population.
While at least part of the observed differences in dust masses and temperatures between the various samples can be attributed to the selection effects specific to each sample, real cosmological evolution of the ULIRG population with redshift appears to play a significant role. This is strongly evidenced by the lack of very luminous () sources in the low- sample, which reflects the well-known decrease in the abundance of such extreme systems by about three orders of magnitude from to the present day. At moderate redshifts, such systems are more common as suggested by the overlap in far-IR luminosity between our sample and the high- SMGs.
5.3 Dust Temperature and Physical Scale of Star Formation
Finally, we wish to argue that the higher dust temperatures observed in our sample of ULIRGs at moderate redshifts, as compared to those of the high- SMGs, may be linked to variations in the characteristic physical scale on which star formation dominates at these two different epochs. Eq. (10) suggests that the observed , characterizing the large-scale SED of a galaxy, is determined by the total dust heating (and by implication the global star formation rate) per unit dust mass within the galaxy. The dust temperature is therefore linked to the global star formation efficiency, subject to uncertainties in dust emissivity, additional dust heating, and gas-to-dust ratio. At the same time, the star formation efficiency is known to be primarily regulated by gas density in star-forming regions (Schmidt law) across enormous ranges spanning orders of magnitude in gas densities and star formation rates (Kennicutt 1998). Calculations by Yang (2006) have shown that a general relationship can be expected to exist between the observed and the spatial extent of star formation, suggesting higher observed are generally indicative of star formation that occurs over more concentrated regions. This proposed link is in good agreement with observational evidence; high-resolution radio observations of (cooler) high-redshift SMGs show spatially extended starbursts on scales of 10 kpc (Chapman et al. 2004a), while the few local ULIRGs with far-IR luminosities comparable to that of SMGs in general have higher dust temperatures with the dust and molecular gas being concentrated in compact regions with scales on the order of 0.11 kpc (Young & Scoville 1991; Sanders & Mirabel 1996). Today’s mm interferometers such as the IRAM Plateau de Bure Interferometer (PdBI) have just about the sufficient sensitivity as well as spatial resolution (FWHM at 1.3mm for PdBI in its extended B and A configuration) to allow us to detect and marginally resolve the dust emission in sources such as the ones in our sample. However, such observations are extremely challenging and time consuming, and will at best provide us with only a rough gauge, or even perhaps only an upper limit, of the physical extent of the dust. Of course, once ALMA comes on-line the situation will improve dramatically, resulting in detailed maps of the dust emission that will not only pinpoint the hot dust, which presumably originates from compact regions of intense star formation and/or AGN-activity, but also outline the morphology and scale of any underlying, cooler dust reservoir that may exist.
6 Conclusion
This paper reports 350m observations of 36 intermediate-redshift ULIRGs (), out of which 28 are detected. The newly acquired 350m data are the first reported flux measurements longward of 100m for these galaxies, and lead to meaningful estimates of their dust temperatures () and far-IR luminosities (). These intermediate-redshift ULIRGs appear to host large amount of warm dust () and are experiencing intense starburst activity (). The far-IR/radio correlation observed in star-forming galaxies in the local Universe remains valid for ULIRGs in the more distant Universe over the redshift range of , where dust heating seems predominantly powered by ongoing star formation, with modest contribution to the far-IR luminosity from older stars and AGNs. Far-IR luminosities and dust temperatures derived for dusty galaxies over a wide range of redshifts reveal a general positive relation between theses two quantities. However, there is significant scatter in the - relation, due to differing selection biases as well as variations in dust mass and grain properties. We argue that the somewhat higher dust temperatures of our sample compared to the high- SMGs are possibly tied to the more compact spatial scales of the ongoing star formation.
References
- Appleton et al. (2004) Appleton P., Fadda D., Marleau F., Frayer D., Helou G., Condon J., Choi P., Yan L., Lacy M., and 12 co-authors, ApJS, 154, 147
- Becker et al. (1995) Becker R., White R., Helfand D., 1995, ApJ, 450, 559
- Bertoldi et al. (2000) Bertoldi F., Menten K., Kreysa E., Carilli C., Owen F., 2000, 24th meeting of the IAU, Joint Discussion 9, Manchester, England
- Best et al. (2005) Best P., Kauffmann G., Heckman T., Ivezic Z., 2005, MNRAS, 362, 9
- Blain et al. (2003) Blain A., Barnard V., Chapman S., 2003, MNRAS, 338, 733
- Blain et al. (2004) Blain A., Chapman S., Smail I., Ivison R., 2004, ApJ, 611, 52
- Carilli et al. (2001) Carilli C., Owen F., Yun M., Bertoldi F., Bertarini A., Menten K., Kreysa E., Zylka R. 2001, ”Deep millimeter surveys: implications for galaxy formation and evolution”, Proc. of the UMass/INAOE conference, Univ. of Massachusetts, USA. Eds, J.D. Lowenthal & D. Hughes, World Scientific Publishing.
- Chapman et al. (2003) Chapman S., Blain A., Ivison R., Smail I., 2003, Nature, 422, 695
- Chapman et al. (2004a) Chapman S., Smail I., Windhorst R., Muxlow T., Ivison R., 2004a, ApJ, 611, 732
- Chapman et al. (2004b) Chapman S., Smail I., Blain A.W., Ivison R., 2004b, ApJ, 614, 671
- Chapman et al. (2005) Chapman S., Blain A., Smail I., Ivison R., 2005, ApJ, 622, 772
- Condon (1992) Condon J., 1992, ARA&A, 30, 575
- De Breuck et al. (2003) De Breuck C., Neri R., Morganti R., Omont A., Rocca-Volmerange B., Stern D., Reuland M., van Breugel W., Röttgering H., and 4 co-authors, 2003, A&A, 401, 911
- Dopita et al. (2005) Dopita M., Groves B., Fischera J., Sutherland R., Tuffs R., Popescu C., Kewley L., Brandl B., Reuland M., and 2 co-authors, ApJ, 619, 755
- Dowell et al. (2003) Dowell C., Allen C., Babu R., Freund M., Gardner M., Groseth J., Jhabvala M., Kovács A., Lis D., and 5 co-authors, 2003, SPIE, 4855, 73
- Dunne et al. (2000) Dunne L., Eales S., Edmunds M., Ivison R., Alexander P., Clements D., 2000, MNRAS, 315, 115
- Egami et al. (2004) Egami E., Dole H., Huang J., Pérez-Gonzalez P., Le Floc’h E., Papovich C., Barmby P., Ivison R., Serjeant S., Mortier A., and 17 co-authors, 2004, ApJS, 154, 130
- Farrah et al. (2002) Farrah D., Serjeant S., Efstathiou A., Rowan-Robinson M., Verma A., 2002, MNRAS, 335, 1163
- Genzel et al. (2000) Genzel R., Lutz D., Moorwood A., Rigopoulou D., Spoon H., Sternberg A., Sturm E., Tran D., 2000, LNP, 548, 199
- Greve et al. (2005) Greve T., Bertoldi F., Smail I., Neri R., Chapman S., Blain A., Ivison R., Genzel R., Omont A., and 3 coauthors, 2005, MNRAS, 359, 1165
- Hauser et al. (1998) Hauser M., Arendt R., Kelsall T., Dwek E., Odegard N., Weiland J., Freudenreich H., Reach W., Silverberg R., and 9 coauthors, 1998, ApJ, 508, 25
- Helou et al. (1985) Helou G., Soifer B., Rowan-Robinson M., 1985, ApJ, 298, L7
- Hildebrand (1983) Hildebrand R., 1983, QJRAS, 24, 267
- Hughes et al. (1998) Hughes D., Serjeant S., Dunlop J., Rowan-Robinson M., Blain A., Mann R., Ivison R., Peacock J., Efstathiou A., and 6 co-authors, 1998, Nature, 394, 241
- Kennicutt (1998) Kennicutt R., 1998, ARA&A, 36, 189
- Kovács et al. (2006) Kovács A., Chapman S., Dowell C., Blain A., Ivison R., Smail I., Phillips T., 2006, astro-ph/0604591
- Kovács (2006) Kovács A., 2006, Caltech Ph.D. Thesis
- Lagache et al. (2005) Lagache G., Puget J., Dole H., 2005, ARA&A, 43, 727
- Le Floc’h et al. (2005) Le Floc’h E., Papovich C., Dole H., Eric F., Lagache G., Rieke G., Egami E., Pérez-González P., Alonso-Herrero A., and 8 co-authors, ApJ, 632, L159
- Moshir et al. (1992) Moshir M., Kopman G., Conrow T., 1992, IRAS Faint Source Survey, Explanatory supplement version 2
- Neri et al. (2003) Neri R., Genzel R., Ivison R., Bertoldi F., Blain A., Chapman S., Cox P., Greve T., Omont A., Frayer D., 2003, ApJ, 597, L113
- Papovich et al. (2004) Papovich C., Dole H., Egami E., Le Floc’h E., Pérez-González P., Alonso-Herrero A, Bai L., Beichman C., Blaylock M., and 14 co-authors, 2004, ApJS, 154, 70
- Sanders & Mirabel (1996) Sanders D., Mirabel I., 1996, ARA&A, 34, 749
- Schlegel et al. (1998) Schlegel D., Finkbeiner D., Davis M., 1998, ApJ, 500, 525
- Smail et al. (1997) Smail I., Ivison R., Blain A., 1997, ApJ, 490, L5
- Soifer et al. (1986) Soifer B., Sanders D., Neugebauer G., Danielson G., Lonsdale C., Madore B., Persson S., 1986, ApJ, 303, L41
- Soifer & Neugebauer (1991) Soifer B., Neugebauer G., 1991, AJ, 101, 354
- Stanford et al. (2000) Stanford S., Stern D., van Breugel W., De Breuck C., 2000, ApJS, 131, 185
- Verma et al. (2002) Verma A., Rowan-Robinson M., McMahon R., Efstathiou A., 2002, MNRAS, 335, 574
- Young & Scoville (1991) Young J., Scoville N., 1991, ARA&A, 29, 581
- Zakamska et al. (2004) Zakamska N., Strauss M., Heckman T., Ivezic Z., Krolik J., 2004, AJ, 128, 1002
| Source Name | RA | Dec | aaThe template amplitude of the noise-weighted mean scan (1003), given by IRAS Scan Processing and Integration (SCANPI), Version 5.0. | bbThe template amplitude of the noise-weighted mean scan (1003), given by SCANPI, Version 5.0, except for FF 01230114 and FF 22000108, for which the 100m fluxes are not available from SCANPI and thus values in Stanford et al. (2000) are adopted. | log | log | |||||
|---|---|---|---|---|---|---|---|---|---|---|---|
| J2000 | J2000 | Jy | Jy | mJy | mJy | K | |||||
| FF 00300027 | 00 30 09.099 | 00 27 44.40 | 0.242 | 0.59 | 1.11 | 2.52 | 12.25 | 8.28 | 2.64 | ||
| FF 00500039 | 00 50 09.806 | 00 39 00.96 | 0.727 | 0.22 | 0.49 | 4.32 | 12.84 | 8.15 | 1.91 | ||
| FF 01230114 | 01 23 06.973 | 01 14 10.03 | 0.089 | 0.23 | 0.55 | ( ) | 1.78 | ||||
| FF 02400042 | 02 40 08.576 | 00 42 03.56 | 0.410 | 0.20 | 0.69 | 0.84 | 12.40 | 8.30 | 2.75 | ||
| FF 02450123 | 02 45 55.355 | 01 23 28.40 | 0.798 | 0.17 | 0.32 | () | 2.03 | ||||
| FF 03120058 | 03 12 38.445 | 00 58 33.86 | 0.130 | 0.26 | 0.61 | () | 3.84 | ||||
| FF 03170129 | 03 17 43.635 | 01 29 07.33 | 0.265 | 0.21 | 0.34 | 1.67 | 11.91 | 8.18 | 2.39 | ||
| FF 07382856 | 07 38 29.856 | 28 56 38.74 | 0.334 | 0.25 | 0.64 | 1.38 | 12.24 | 8.20 | 2.59 | ||
| FF 07483343 | 07 48 10.591 | 33 43 27.13 | 0.356 | 0.64 | 1.18 | 2.03 | 12.64 | 8.47 | 2.75 | ||
| FF 07582851 | 07 58 45.956 | 28 51 32.76 | 0.126 | 0.62 | 0.92 | 3.72 | 11.58 | 7.64 | 2.42 | ||
| FF 08043919 | 08 04 07.399 | 39 19 27.63 | 0.164 | 0.25 | 0.48 | 5.90 | 11.40 | 7.15 | 1.80 | ||
| FF 08233202 | 08 23 54.616 | 32 02 12.03 | 0.396 | 0.23 | 0.52 | 0.97 | 12.38 | 8.28 | 2.70 | ||
| FF 08263042 | 08 26 11.644 | 30 42 44.17 | 0.248 | 0.31 | 0.88 | 3.19 | 12.15 | 8.46 | 2.41 | ||
| FF 08353559 | 08 35 27.440 | 35 59 33.07 | 0.201 | 0.33 | 0.51 | () | 0.85 | ||||
| FF 08563450 | 08 56 24.852 | 34 50 24.82 | 0.220 | 0.24 | 0.75 | 8.51 | 11.93 | 8.28 | 1.88 | ||
| FF 09073931 | 09 07 42.264 | 39 31 49.47 | 0.224 | 0.26 | 0.47 | 1.24 | 11.79 | 7.76 | 2.56 | ||
| FF 10163951 | 10 16 08.616 | 39 51 20.46 | 0.307 | 0.21 | 0.39 | 2.10 | 12.01 | 7.90 | 2.25 | ||
| FF 10183649 | 10 18 34.539 | 36 49 51.75 | 0.490 | 0.20 | 0.56 | 9.18 | 12.58 | 8.42 | 1.72 | ||
| FF 10423231 | 10 42 40.815 | 32 31 30.99 | 0.633 | 0.21 | 0.44 | 6.34 | 12.76 | 8.31 | 1.80 | ||
| FF 11063201 | 11 06 35.716 | 32 01 46.39 | 0.900 | 0.19 | 0.64 | 13.7 | 13.09 | 8.40 | 1.44 | ||
| FF 12422905 | 12 42 32.497 | 29 05 14.75 | 0.260 | 0.19 | 0.50 | 1.34 | 11.95 | 8.21 | 2.55 | ||
| FF 14123014 | 14 12 24.952 | 30 14 09.78 | 0.257 | 0.15 | 0.53 | 2.06 | 11.86 | 8.11 | 2.29 | ||
| FF 14563337 | 14 56 58.427 | 33 37 09.98 | 0.443 | 0.27 | 0.60 | 1.43 | 12.55 | 8.38 | 2.60 | ||
| FF 15143629 | 15 14 33.118 | 36 29 42.36 | 0.338 | 0.24 | 0.54 | () | 0.82 | ||||
| FF 15323242 | 15 32 44.052 | 32 42 46.73 | 0.926 | 0.26 | 0.50 | 5.89 | 13.12 | 8.28 | 1.81 | ||
| FF 16143234 | 16 14 22.105 | 32 34 03.66 | 0.710 | 0.15 | 0.20 | () | 1.19 | ||||
| FF 16593549 | 16 59 24.669 | 35 49 01.74 | 0.371 | 0.29 | 0.33 | 0.79 | 12.22 | 7.95 | 2.70 | ||
| FF 17073725 | 17 07 11.795 | 37 25 55.32 | 0.311 | 0.13 | 0.45 | 2.11 | 12.08 | 8.44 | 2.31 | ||
| FF 17133843 | 17 13 46.085 | 38 43 04.77 | 0.171 | 0.37 | 0.79 | 1.66 | 11.72 | 7.82 | 2.62 | ||
| FF 21310141 | 21 31 53.490 | 01 41 43.35 | 0.730 | 0.11 | 0.47 | 2.79 | 12.82 | 8.48 | 2.07 | ||
| FF 21360112 | 21 36 34.229 | 01 12 08.38 | 0.210 | 0.29 | 1.11 | 3.20 | 11.86 | 7.98 | 2.29 | ||
| FF 22000108 | 22 00 51.859 | 01 08 27.08 | 0.164 | 0.20 | 0.72 | ( ) | 2.82 | ||||
| FF 22160058 | 22 16 02.721 | 00 58 10.65 | 0.212 | 0.51 | 0.85 | 1.31 | 11.96 | 7.68 | 2.76 | ||
| FF 22210042 | 22 21 26.066 | 00 42 39.08 | 0.189 | 0.20 | 0.37 | 0.66 | 11.54 | 7.65 | 2.75 | ||
| FF 23300025 | 23 30 34.920 | 00 25 03.98 | 0.252 | 0.25 | 0.72 | 1.65 | 12.08 | 8.42 | 2.62 | ||
| FF 23520015 | 23 52 53.171 | 00 15 24.69 | 0.227 | 0.19 | 0.61 | () | 0.59 |
Note. — Three additional far-IR/submm flux measurements are available from the literature - FF 15323242: = 478 mJy, = 397 mJy (Verma et al. 2002); FF 16143234: = 8.47 mJy (Farrah et al. 2002).
Note. — =1.5 is assumed in the SED fitting.
 |
 |
 |
 |
 |
 |
 |
 |
 |
 |
 |
 |
 |
 |
 |
 |
 |
 |
 |
 |
 |
 |
 |
 |
 |
 |
 |
 |
 |
 |
 |
 |
 |
 |
 |
 |
 |
 |
 |
 |
 |
 |
 |
 |
 |
 |
 |
 |
 |
 |
 |
 |
 |
 |
 |
 |
 |
 |
 |
 |
 |
 |
 |
 |