, and
GZK Photons in the Minimal Ultra High Energy Cosmic Rays Model
Abstract
In a recently proposed model the cosmic rays spectrum at energies above eV can be fitted with a minimal number of unknown parameters assuming that the extragalactic cosmic rays are only protons with a power law source spectrum and [1]. Within this minimal model, after fitting the observed HiRes spectrum with four parameters (proton injection spectrum power law index and maximum energy, minimum distance to sources and evolution parameter) we compute the flux of ultra-high energy photons due to photon-pion production, the GZK photons, for several radio background models and average extragalactic magnetic fields with amplitude between G and G. We find the photon fraction to be between and in cosmic rays at energies above eV. These small fluxes could only be detected in future experiments like Auger North plus South and EUSO.
PACS: 98.70.Sa
1 Introduction
The sources and the composition of the Ultra High Energy Cosmic Rays (UHECR), namely the cosmic rays with energy eV, are still unknown. The highest energy cosmic rays, above eV, are likely of extragalactic origin, since they could not be confined by the galactic magnetic fields. Low energy cosmic rays originate within our galaxy. Two different proposals have been made for the possible transition from galactic to extra-galactic cosmic rays in the spectrum. Historically the “ankle”, a feature close to eV, was interpreted as the transition from a rapidly falling galactic flux component to a flatter spectrum of extragalactic originsubdominant at lower energies. Alternatively, the “ankle” feature can be interpreted as an absorption “dip” at energies EeV [1], due to the propagation of extragalactic protons over large distances in the cosmic microwave background (CMB) [2]. The transition from a galactic to extragalactic cosmic rays would then happen at lower energies, eV or below. This would agree with the indication of a transition from heavy to light primary nuclei observed by the HiRes collaboration at energies close to 5 eV [3]. In this case the UHECR HiRes spectrum [4, 5], in which the GZK cutoff [6] is present, can be fitted with a minimal number of unknown parameters assuming the extragalactic cosmic rays are only protons with a power law source spectrum with [1]. This is the minimal UHECR model we study in this paper.
Let us mention that the Fermi acceleration process predicts lower values of power law index . which are compatible with the minimal UHECR model if a power law distribution of the maximum source energies is assumed [7]. Here we do not study this possibility.
The GZK process produces pions. From the decay of one obtains neutrinos, the “cosmogenic neutrinos” [8]. From the decay of we obtain photons, which we call “GZK photons”. Previously we studied in detail the GZK photon flux dependence on different unknown parameters of the assumed source spectrum and distribution and the intervening cosmological backgrounds [9]. Here we discuss the perspectives for photon detection in the minimal UHECR model. Our previous results of Ref. [9] show that because of the relatively hard source spectrum required, with , the GZK photons are subdominant at all energies.
The plan of the paper is the following. In the next section we explain our calculations. In Section 3 we study the range of parameters of the source spectrum and distribution that best fit the UHECR spectrum, which is dominated by proton primaries at all energies. In Section 4 we show the maximum and minimum expected level of GZK photons and comment briefly on cosmogenic neutrinos. Our conclusions follow in Section 5.
2 Propagation of protons and photons
We use a numerical code originally developed in Ref. [10] to compute the flux of GZK photons produced by a homogeneous distribution of sources emitting originally only protons. This is the same numerical code as in Ref. [9], with a few modifications. This code was compared at the individual reaction level with the code developed by G. Sigl and S. Lee [11] and was already used in several studies of cosmic ray and secondary gamma-ray and neutrino fluxes [12].
The code uses the kinematic equation approach and calculates the propagation of nuclei, nucleons, stable leptons and photons using the standard dominant processes. For nucleons, it takes into account single and multiple pion production and pair production on the CMB, infrared/optical and radio backgrounds, neutron -decays and the expansion of the Universe. The hadronic interactions of nucleons are now derived from the well established SOPHIA event generator [13], more accurate in the multi-pion regime than the old code in Ref. [10]. For photons, the code includes pair production, , double pair production , processes. For electrons and positrons, it takes into account inverse Compton scattering, , triple pair production, , and synchrotron energy loss on extra galactic magnetic fields (EGMF). All these reactions are discussed in detail for example in the Ph.D. thesis of S.Lee [11] and that of O.Kalashev [10]. The propagation of nucleons and electron-photon cascades is calculated self-consistently. Namely, secondary (and higher generation) particles arising in all reactions are propagated alongside the primaries.
As it is usual, we take the spectrum of an individual UHECR source to be of the form:
| (1) |
where provides the flux normalization, is spectral index and is the maximum energy to which protons can be accelerated at the source.
We assume a standard cosmological model with a Hubble constant km s-1 Mpc-1, a dark energy density (in units of the critical density) and a dark matter density . The total source density in this model can be defined by
| (2) |
where parameterizes the source density evolution, in such a way that corresponds to non-evolving sources with constant density per comoving volume, and and are respectively the redshifts of the closest and most distant sources. Sources in the range have a negligible contribution to the UHECR flux above eV. The value of is connected to the density of sources and influences strongly the shape of the “bump” produced by the pile-up of protons which loose energy in the GZK cutoff and the strength of the GZK suppression [14, 15, 16]. In the following we fix and consider three values for , namely 0, 0.005 and 0.01 in Eq. (2).
The main energy loss mechanism for photons with eV is pair production on the radio background (at lower energies pair production on the CMB is more important), possibly followed by synchrotron radiation of electrons and positrons. To take into account the effect of the intervening backgrounds, here we fit the UHECR data assuming either minimal intervening radio background (which we take to be the radio background of Clark et al. [17]) and extragalactic magnetic field EGMF G or a maximal intervening background (for which we take the largest radio background of Protheroe and Biermann [18]) and a EGMF G, with many different source models. A difference with respect to older versions of our code is in the infrared/optical background assumed. We use now the model of Ref. [19]. In any event, this background is not very important for the production and absorption of GZK photons at high energies.
We consider then many different spectra resulting from changing the slope and the maximum energy in Eq. 1 within the ranges and eV and the source evolution parameter in Eq.(2) within the range . Notice that cannot be smaller than the largest event energy, eV, observed by HiRes. We change these parameters in steps , with to 12, , with to 6. and with to 5.
For each one of the models so obtained we compute the predicted UHECR spectrum by summing up the contributions of protons plus GZK photons arriving to us from all sources. In general models we need to consider a larger range of spectral indeces [20]. In the minimal UHECR model we study here instead, one fits the observed spectrum UHECR down to energies EeV with extragalactic protons, which requires a steaply falling source proton spectra with . For such injected proton spectra the GZK photons reaching us are subdominant at all energies. So, fitting the observed HiRes data with the sum of protons and photons arriving to us from all sources is almost equivalent to using just the protons reaching us.
With the spectrum predicted for each combination of parameters we fit the UHECR data from 2 eV up to the end point of the HiRes spectrum (i.e. the 28 highest energy bins of the HiRes 1 and 2 combined monocular data) plus one extra bin at energies above the “end point” (the point in energy beyond which no events were observed) of the spectrum. This last additional bin with zero observed events, extends from the end point of the observed spectrum to the maximum energy assumed for the injected spectrum in Eq. 1. This extra bin takes into account the non-observation of events above the highest occupied energy bin in the data HiRes, i.e. at eV for the HiRes spectrum we used [5]). We compute the expected number of events in this last bin using an exposure that we derive from the HiRes data above 1020 eV, by comparing the published integrated fluxes with the number of events observed and assuming the exposure is energy independent (above 1020 eV).
To fit the UHECR data with each predicted spectrum we follow a procedure similar to that of Ref. [21] applied to the bins just mentioned. We reconstruct the measured number of events in each bin from the published data of HiRes (using the error bars [22]) and compare them with the number of events in each bin predicted by each of the models. We choose the value of the parameter in Eq. 1, i.e. the amplitude of the injected spectrum, by maximizing the Poisson likelihood function, which is equivalent to minimizing , (i.e. the negative of the log likelihood ratio) [23]. This procedure amounts to choosing the value of so that the mean total number of events predicted (i.e. the sum of the average predicted number of events in all fitted bins) is equal to the total number of events observed. We then compute using a Monte Carlo technique the goodness of the fit, or -value of the distribution, defined as the mean fraction of hypothetical experiments (observed spectra) with the same fixed total number of events, which would result in a worse, namely lower, Poisson likelihood than the one obtained (in the maximization procedure that fixed ). These hypothetical experiments are chosen at random according to a multinomial distribution. We have checked that this procedure when applied to bins with large number of events gives the same results as a Pearson’s fit, both for the value of the normalization parameter and for the goodness of fit. A higher value corresponds to a better fit, since more hypothetical experimental results would yield a worse fit than the one we obtained. We make one additional requirement on the fit that insures that the predicted flux does not exceed the observed flux at energies below 2 eV.
In the next section we present our results the for total UHECR flux, which is dominated by protons at all energies.
3 The proton flux
In this section we find the range of source proton spectrum and distribution parameters , , and , consistent with the HiRes observed spectrum [4] at energies EeV.
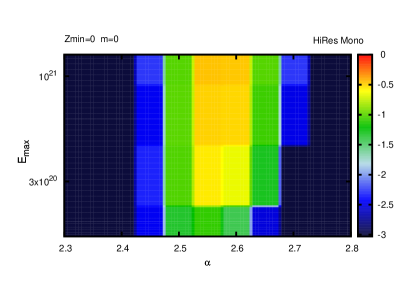
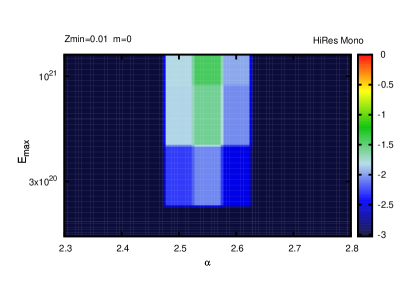
In Fig. 1 and Fig. 2 we show the logarithm of the -value in a color coded scale, from best () to worse ( close to zero), which measures the consistency level of the predicted UHECR proton flux with the HiRes data, for different parameter ranges.
The high energy part of the predicted spectrum depends mostly on the power law index , the maximum injected proton energy and the minimal distance to the sources . In Fig. 1 the -values are shown as function of and for and either (Fig. 1a, left panel), i.e. a continuous distribution of sources, or (Fig. 1b, right panel), i.e. with no sources within a 50 Mpc radius. We can see in the figure that fitting the UHECR data from EeV and above, the initial proton spectrum should be relatively hard, with in Eq.(1). Fig. 1a shows that this range does not depend strongly on for a continuous distribution of sources. If there are no sources within a distance of 50 Mpc distance, thus , as shown inFig. 1b, the HiRes observed spectrum is not fitted as well anymore, and a relatively high maximum energy eV is required for a reasonable fit, with, say, .
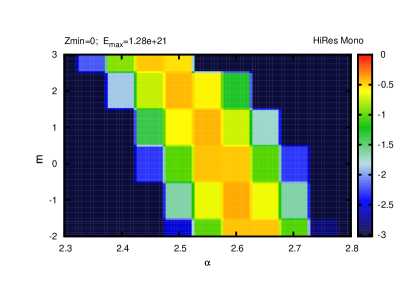
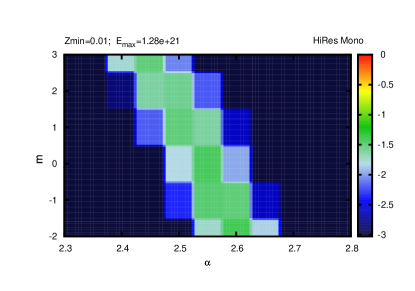
The low energy part of the predicted spectrum depends mostly on the power law index and source evolution index . In Fig. 2 we show the goodness of fit -value as function of and for eV and again for either (Fig. 2a, left panel) or (Fig. 2b, right panel). This figure cleary shows the degeneracy between the parameters and : as increases from to 3 the value of of the best fits decreases from to . Again the fit is worse for , in which case the -value is never higher than 0.04.
4 The GZK photon flux
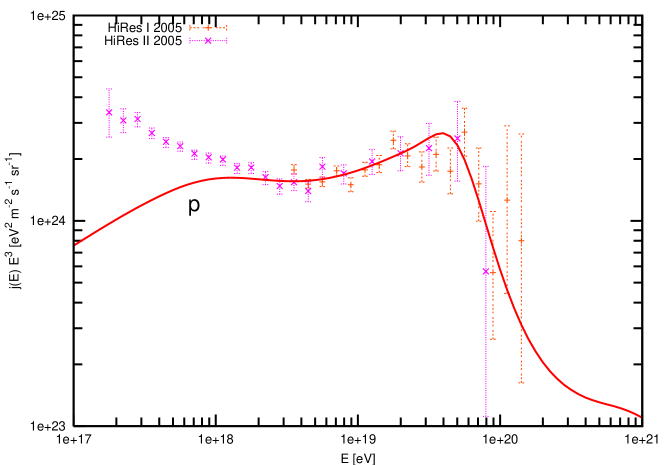
In this section we discuss the secondary photon fluxes. The main difference between the minimal model we are concentrating on here and other models (see Ref. [9]) is that in the minimal model one fits the UHECR data with extragalactic protons data starting from low energies EeV, what requires a hard spectrum with index (see Figs. 1 and 2). In this case the GZK photon flux is always sub-dominant, at all energies.
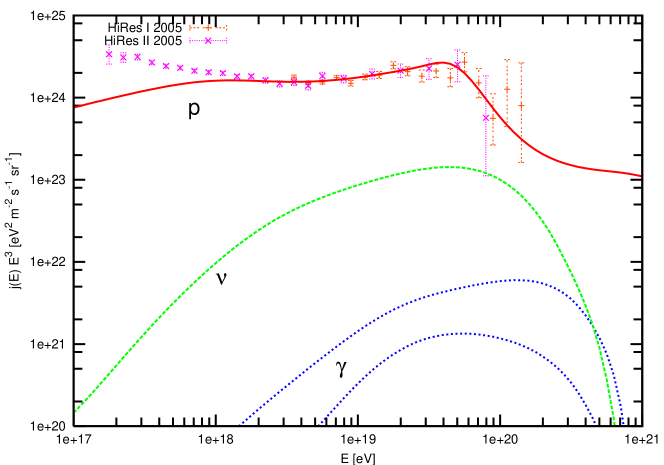
As an example, in Fig. 4 we show the possible range of GZK photon fluxes for the predicted proton spectrum of Fig. 3. The range of photon fluxes is between the upper photon (blue-dotted) line which was calculated with minimal radio background and G and the lower photon line corresponding to maximal radio background and G. (How the GZK photon flux depends on the radio background and extragalactic magnetic fields assumed can be seen in Ref. [9]).
Here we do not deal with neutrinos in any detail, but just to compare the photon and neutrino fluxes produced in the same GZK processes, in Fig. 4 we also plotted the cosmogenic neutrino flux per flavor for the same model. Even if the neutrino flux is much higher than the photon flux, its detection may be even more difficult due to the strongly reduced probability of neutrinos to produce air-showers.
In Fig. 4 one can see that the best energy range to find GZK photons is EeV. At higher energies, the small event statistics will not allow to find a 1% fraction of photons in the UHECR flux, while at lower energies the photon fraction is strongly reduced.
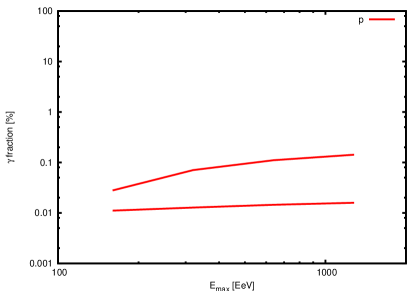
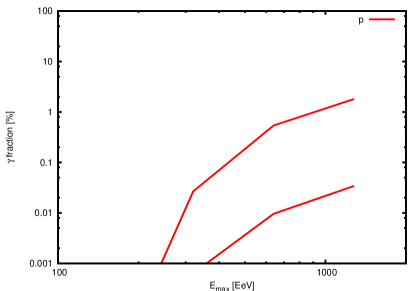
The dependence of the GZK photon fractions on , the maximum source proton energy, is shown in Fig. 5. The figure shows the maximum and minimum GZK photon fractions given in percentage of the integrated UHECR fluxes above the energy for eV (left panel) and eV (right panel). In order to define the range of possible photon fluxes we use only models with p-values (i.e. we eliminate those models which are inconsistent with the HiRes observed spectrum at the 95 % C.L.). Those shown are the maximum and minimum GZK photon fractions obtained for each value of by varying all the other parameters as specified above, and choosing either minimum or maximum intervening backgrounds. The important conclusion coming from this figure is the stability of the GZK photon fractions at eV as function of . Notice that the expected photon fractions are between 10-4 and 10-3 for the whole range we consider (see the left panel). This contrasts with the situation at eV (right panel), where the photon fractions depends strongly on .
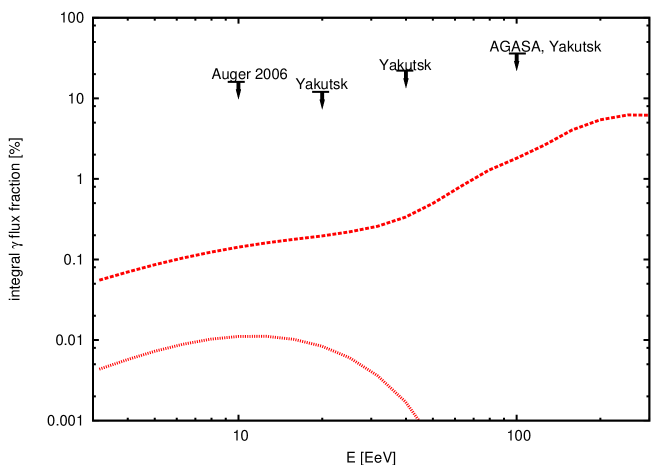
Finally, in Fig. 6 we show the GZK photon fraction given in percentage of the integrated UHECR flux above the energy as function of , for the whole parameter space we consider (i.e. maximum source proton energy eV, source evolution parameter , power law index and minimum redshift of the sources ). Present limits on the photon fraction from Auger [24], Yakutsk [25] and combined AGASA/Yakutsk [26] data are also shown in the figure. It is clear that, contrary to the case of top-down models (which are restricted already by present bounds on the GZK-photon fraction [9]) the present limits are well above the expected the GZK photon fraction in the minimal UHECR model by a factor of 10 to 100 depending on the energy (see Fig. 6). The detection of GZK photons in this model will remain as a task for the future.
We have also checked the dependence of the photon fractions in Fig. 6 on the lowest energy for which we fit the HiRes data by changing this energy in the interval EeV. We found no significant changes with respect to Fig. 6 at energies close to EeV, and small changes close to EeV. The highest photon fractions are always at the highest energies, but the best energies to observe photons are close to EeV due to the larger experimental statistics as well as the smaller dependence of our predictions on the unknown parameters at these energies.
Thus, the expected photon fraction of the integrated flux above EeV in the minimal UHECR models, is to independently of the unknown parameters we considered. Already Auger South after 5 years of data taking can reach a statistics of events at energies EeV. This would allow, in principle, to detect GZK photons, if they can be discriminated from the large background of proton cosmic rays.
5 Discussion and conclusions
The South site of the Pierre Auger Observatory after several years of data taking will probably be able to reach a photon fraction sensitivity of the order of in the integrated flux close to EeV. As can be seen in Fig. 6 this is the level of the largest GZK photon fraction expected in the minimal UHECR model. Larger future observatories like Auger North plus South [27] and EUSO [28] could probe lower photon fractions if they are able to collect statistics a factor of 5-10 larger than Auger South and have thresholds around eV (provided these experiments are sensitive to photon primaries).
We have assumed that the sources emit only protons, however our predictions for GZK photon fractions shown in Fig. 6 would not change too much if nuclei primaries were present too, as assumed in the so called “mixed models” [29]. The reason is that even in mixed models, primary protons dominate the UHECR flux at high energies EeV, i.e. in the energy region where the primary protons produce secondary GZK photons.
Let us also mention that the photon flux at high energies eV could be enhanced by the interaction of UHECR protons with energies eV with a large infrared background in our galaxy [30] due to the reaction . Only of the UHECR protons with energy 10-50 EeV would interact with the infrared background in our galaxy. Thus, the resulting photons, which would have an energy 1-5 EeV, would constitute a small fraction of the order of of the integrated UHECR flux at these energies. These are much smaller than the expected GZK photons at energies 1-5 EeV (as shown in Fig. 6).
As a final remark let us mention that even if the GZK photon fluxes considered here are very small, much larger fluxes are possible in more general models, which are not restricted by the condition that all the UHECR spectrum from energies eV to the largest is explained with extragalactic protons [9].
In conclusion, here we systematically study the possible GZK photon fluxes in the minimal UHECR model in the multi-dimentional parameter space of source proton spectrum power law index and maximum energy , minimal distance to the sources (which is directly connected to the source density), source evolution parameter , average magnetic field value and extragalactic radio background in the interval . We also consider the dependence of our results on the lowest energy of the HiRes spectrum we chose to fit, varying it in the interval eV. In each case we take into account only the models which are consistent with spectrum of cosmic rays observed by HiRes experiment at the 95 % C.L. Our results, presented in Fig. 6, show that future experiments have to reach a sensitivity of in the photon to proton fraction for energies eV in order to detect GZK photons in the minimal UHECR model.
Finally, we want to mention that after this work was finished we got the draft of a paper by G. Sigl in which the GZK photon flux in the minimal UHECR model is also studied. In this paper G. Sigl mainly investigates the effect on the photon fluxes of a three-dimentional magnetic field stucture, and gives only examples of possible photon fluxes in several cases. Here, instead, as mentioned above, we simplify the effect of extragalactic magnetic fields, considering only their average value to be in the interval , while we systematically study the possible photon fluxes in their multi-dimentional parameter space.
Acknowledgments
The work of G.G and O.K. was supported in part by NASA grant NAG5-13399. G.G was also supported in part by the US DOE grant DE-FG03-91ER40662 Task C.
References
- [1] V. Berezinsky, A. Z. Gazizov and S. I. Grigorieva, Phys. Rev. D 74, 043005 (2006) [arXiv:hep-ph/0204357]; astro-ph/0210095; Nucl. Phys. Proc. Suppl. 136, 147 (2004) [astro-ph/0410650]; Phys. Lett. B 612 (2005) 147 [astro-ph/0502550].
- [2] C. T. Hill and D. N. Schramm, Phys. Rev. D 31, 564 (1985); V. S. Berezinsky and S. I. Grigorieva, Astron. Astrophys. 199 (1988) 1.
- [3] R. U. Abbasi et al. [The High Resolution Fly’s Eye Collaboration], Astrophys. J. 622, 910 (2005) [arXiv:astro-ph/0407622]; D. R. Bergman et al., “UHECR composition measurements using the HiRes-II detector,” Proc. 29th ICRC (Pune), 2005 [astro-ph/0507483].
- [4] R. U. Abbasi et al., Phys. Rev. Lett. 92, 151101 (2004) [astro-ph/0208243]; D. R. Bergman [the HiRes Collaboration], astro-ph/0507484.
- [5] D. R. Bergman (HiRes Collaboration), 29th ICRC, Pune (2005) 00, 101-104.
- [6] K. Greisen, Phys. Rev. Lett. 16, 748 (1966); G. T. Zatsepin and V. A. Kuzmin, JETP Lett. 4, 78 (1966) [Pisma Zh. Eksp. Teor. Fiz. 4, 114 (1966)].
- [7] M. Kachelriess and D. V. Semikoz, Phys. Lett. B 634, 143 (2006) [arXiv:astro-ph/0510188].
- [8] V. S. Berezinsky and G. T. Zatsepin, Phys. Lett 28B, 423 (1969).
- [9] G. Gelmini, O. Kalashev and D. V. Semikoz, “GZK photons as ultra high energy cosmic rays,” arXiv:astro-ph/0506128.
- [10] O.E. Kalashev, V.A. Kuzmin and D.V. Semikoz, astro-ph/9911035; Mod. Phys. Lett. A 16, 2505 (2001) [astro-ph/0006349]. O.E. Kalashev Ph.D. Thesis, INR RAS, 2003.
- [11] S. Lee, Phys. Rev. D 58, 043004 (1998) [astro-ph/9604098]. G. Sigl, S. Lee and P. Coppi, arXiv:astro-ph/9604093.
- [12] O. E. Kalashev, V. A. Kuzmin, D. V. Semikoz and G. Sigl, Phys. Rev. D 65 (2002) 103003 [arXiv:hep-ph/0112351]; Phys. Rev. D 66, 063004 (2002) [hep-ph/0205050]; D. V. Semikoz and G. Sigl, JCAP 0404, 003 (2004).
- [13] A. Mucke, R. Engel, J. P. Rachen, R. J. Protheroe and T. Stanev, Comput. Phys. Commun. 124, 290 (2000) [arXiv:astro-ph/9903478].
- [14] M. Kachelriess, D. V. Semikoz and M. A. Tortola, Phys. Rev. D 68, 043005 (2003) [arXiv:hep-ph/0302161].
- [15] P. Blasi and D. De Marco, Astropart. Phys. 20 (2004) 559 [astro-ph/0307067].
- [16] M. Kachelriess and D. Semikoz, Astropart. Phys. 23, 486 (2005) [arXiv:astro-ph/0405258].
- [17] T. A. Clark, L. W. Brown, and J. K. Alexander, Nature 228, 847 (1970).
- [18] R. J. Protheroe and P. L. Biermann, Astropart. Phys. 6, 45 (1996) [Erratum-ibid. 7, 181 (1997)]
- [19] F. W. Stecker, M. A. Malkan and S. T. Scully, Astrophys. J. 648, 774 (2006) [arXiv:astro-ph/0510449].
- [20] G. Gelmini, O. Kalashev and D. V. Semikoz, application of the method presented here to the general case of UHECR models, in which protons dominate for energies eV (in preparation).
- [21] Z. Fodor, S. D. Katz and A. Ringwald, Phys. Rev. Lett. 88, 171101 (2002) [hep-ph/0105064]; JHEP 0206, 046 (2002) [hep-ph/0203198].
- [22] G. Cowan “Statistical data analysis”, Oxford University Press, 1998, Section 9.4.
- [23] S. Baker and R.D. Cousins, Nucl. Instrum. Methods 221, 437 (1984); Particle Data Group’s Statistics Review (2004).
- [24] J. Abraham et al. [Pierre Auger Collaboration], Astropart. Phys. 27, 155 (2007) [arXiv:astro-ph/0606619].
- [25] A. V. Glushkov et al. “Constraining the fraction of primary gamma rays at ultra-high energies from the muon data of the Yakutsk extensive-air-shower array,” arXiv:astro-ph/0701245.
- [26] G. I. Rubtsov et al., Phys. Rev. D 73, 063009 (2006) [astro-ph/0601449].
- [27] Auger North web-site can be found here: http://www.augernorth.org/.
- [28] Original EUSO project http://www.euso-mission.org was revived recently as “JEM/EUSO Project: To Study Extreme Universe by Wide-angle Telescope” Talk by Inoue, I.; Ebisuzaki, E. on 6th COSPAR Scientific Assembly. Held 16 - 23 July 2006, in Beijing, China., p.2902.
- [29] D. Allard, E. Parizot and A. V. Olinto, Astropart. Phys. 27, 61 (2007) [arXiv:astro-ph/0512345].
- [30] P. G. Tinyakov and I. I. Tkachev, “Is astronomy possible with neutral ultra-high energy cosmic ray particles existing in the standard model?,” arXiv:astro-ph/0612359.