Accreting X-ray millisecond pulsars observed with INTEGRAL
Abstract
I review the properties of three X-ray accreting millisecond pulsars observed with INTEGRAL. Out of seven recently discovered accretion-powered pulsars (one discovered by INTEGRAL), three were observed with the INTEGRAL satellite up to 300 keV. Detailed timing and spectral results will be presented, including data obtained during the most recent outburst of the pulsar HETE J1900.1-2455. Accreting X-ray millisecond pulsars are key systems to understand the spin and accretion history of neutron stars. They are also a good laboratory in which to study the source spectra, pulse profile, and phase shift between X-ray pulses in different energy ranges which give additional information of the X-ray production processes and emission environment.
keywords:
pulsars: individual (XTE J1807-294, IGR J00291+5934, HETE J1900.1-2455) – starts: neutron – X-ray: binaries1 Introduction
Many low-mass X-ray binaries (LMXB) consist of a neutron star accreting from a low mass companion star ( 1 ). Accreting matter may spin up the neutron star (NS); therefore, one of the possible endpoints of the evolution of a low-mass X-ray binary is expected to be a millisecond pulsar, i.e. a rapidly spinning NS with a rather weak, Gauss, surface magnetic field. Although evidence for rapidly spinning NS in LMXBs was inferred from the burst oscillations that were seen during type I X-ray bursts in several systems (see Strohmayer, 2001, for a review), the detection of millisecond pulsations in persistent emission remained elusive for many years until the discovery of the first accreting millisecond pulsar by Wijnands & van der Klis (1998). Since that time, a total of seven accreting MSPs have been detected.
All of the accreting MSPs are X-ray transients; they spend most of the time in a quiescent phase, with X-ray luminosities of order of erg s-1. They sometimes show X-ray outbursts reaching X-ray luminosities of erg s-1, during which coherent pulsations are observed with frequencies in the range between 180 and 435 Hz (see reviews by Wijnands, 2005; Poutanen, 2006). This frequency is interpreted as the NS rotation frequency given by a hot spot (or spots) in an atmospheric layer of the rotating NS (Chakrabarty et al., 20003). MSPs represent a new class of objects connecting accretion powered X-ray pulsars with rotation powered millisecond radio pulsars.
MSP energy spectra are successfully fitted by a two-component model consisting of a multicolor blackbody soft X-ray emission and a Comptonized spectrum for the hard X-ray emission. The soft thermal component could be associated with the radiation from the accretion disc and/or the heated NS surface around the shock (see e.g. Gierliński & Poutanen, 2005; Poutanen, 2006). The hard emission is likely to be produced by thermal Comptonization in the hot accretion shock on the NS surface (Gierliński et al., 2002; Poutanen & Gierliński, 2003) with the seed photons coming from the stellar surface. The observed hard spectra are similar to the spectra observed from atoll sources in their hard, low-luminosity state (Barret et al., 2000). A representative spectrum of the three observed MSP (XTE J1807-294 (Falanga et al., 2005a), IGR J00291+5934 (Falanga et al., 2005b), and HETE J1900.1-2455 (Falanga et al., 2006)) with INTEGRAL is shown in Figure 1, 2 and 3.
Recent years have shown INTEGRAL gave additional contributions to the study of MSPs. Our timing analysis of IGR J00291+5934 showed for the first time that INTEGRAL/ISGRI is capable of detecting the pulse profile of a 1.67 ms pulsar up to 150 keV. This allowed us to study the pulsed fraction up to this high energy. We confirmed for the first time the increase of the pulsed fraction with energy in an accretion powered MSP, explained by the action of the Doppler effect on the exponentially cutoff Comptonization spectrum from the hot spot or from a componization model where we account the pulsed fraction to be produced in a corona cloud. We also measured soft time lags with a complex energy dependence. Similarly to SAX J1808.4-3658 and XTE J1751-350, the time lags increase rapidly with energy until 10 keV. However, in IGR J00291+5934, the time lags first increase and then decrease slightly, saturating above 15 keV, and possibly reaching zero around 50 keV. This is a intriguing result, and if confirmed or observed in another object could be a serious challenge to any time-lag model. Additionally, with RXTE we measured an increase of the NS spin period during accretion for the first time. This provided a strong confirmation of the theory of ’recycled’ pulsars in which the old neutron stars in LMXBs become millisecond radio pulsars through spin-up by transfer of angular momentum by the accreting material (Falanga et al., 2005b).
Analysis of the recent ToO observation of HETE J1900.1-2455 is also discussed. We observe in this object Type I X-ray bursts showing, at high energy, evidence of photospheric radius expansion in the burst profile. Using JEM-X/ISGRI data at high energy, and assuming the bolometric burst peak luminosity during photospheric radius expansion to be saturated at the Eddington limit, we measure the source distance to be around 5 kpc. A very interesting result is that the pulsations at the spin frequency are not always observed in this source.
2 X-ray spectra


For the INTEGRAL observed MSP sources the high energy spectrum could be described with a photon index of 1.8–2.0 and a cut-off energy at 80–100 keV. However, the model does not describe the spectrum below 15 keV well, which requires a more complex description. MSP energy broad-band spectra are successfully fitted by a two-component model consisting of a multicolor blackbody soft X-ray emission and a Comptonized spectrum, for the hard X-ray emission. The soft thermal component could be associated with the radiation from the accretion disc and/or the heated NS surface around the shock. The hard emission is likely to be produced by thermal Comptonization in the hot accretion shock on the NS surface with the seed photons coming from the stellar surface. The spectra are best fitted with the thermal Comptonization model compps in the slab geometry (Poutanen & Svensson, 1996). The main model parameters are the Thomson optical depth across the slab, the electron temperature , the soft seed photon temperature , and the inclination angle between the slab normal and the line of sight. The seed photons are supposed to be injected from the bottom of the slab. The soft thermal emission is fitted by a simple blackbody, bb, or a multi-temperature disc blackbody, dbb, model (Mitsuda et al., 1984). The best fit parameters for the three observed MSP with INTEGRAL are reported in Table 1. In Fig. 1, 2, and 3, we show the unfolded spectrum and the residuals of the data to the bb or dbb plus compps model.
The spectra of XTE J1807-294, IGR J00291+5934, and HETE J1900.1-2455 are well described by a combination of thermal Comptonization and a disk black body or simple black body. The hard spectral component contributes most of the observed flux (70–80 per cent), even though a soft component (disk black body) is required by the data. If the accretion disk is truncated at the magnetosphere radius where the material can accrete along the magnetic field towards the pole of a NS, the matter over the pole is heated by a shock to a temperature of 30–50 keV. The hot spot at the surface with temperature 0.8–1.5 keV gives rise to the seed photons for Comptonization in the hot plasma. Since the hard X-ray emission is pulsed (see Sec. 3.1), a fraction of it must originate from the regions confined by the magnetic field. The most obvious source of hard X-rays is the place where material collimated by the magnetic fields impacts the surface.
For XTE J1807-294, if we consider the inclination of the system to be , this allows us to determine the inner disk radius which lies in the range 20–40 km (for the distance of 8 kpc). The apparent area of the seed photons is , which is also what expected from a hot spot on a NS surface. Many characteristics of the source are similar to those observed in other MSPs, SAX J1808.4–3658 (Gierliński et al., 2002; Poutanen & Gierliński, 2003) and XTE J1751–305 (Gierliński & Poutanen, 2005). For IGR J00291+5934 no additional thermal-like component (either blackbody or disk blackbody) was required by the fit, very likely because the bulk of its emission occurs below 3 keV, outside the covered energy range. However, the apparent area of the seed photons, which turns out to be km2, could correspond to a hot spot radius of km during the INTEGRAL ToO outburst phase.
Only HETE J1900.1-2455’s spectrum differs from other MSP in requiring thermal soft X-ray emission with nearly double the temperature. We could not distinguish between the multi-temperature blackbody and single blackbody models, as both gave comparable parameters and . However, for a distance of 5 kpc, the disk blackbody gives an inner disk radius, km, smaller than the expected NS radius. For the blackbody emission, the fit implies the apparent area of the emission region km2, which could be consistent with the heated NS surface around the accretion shock (Poutanen & Gierliński, 2003; Gierliński & Poutanen, 2005). From our spectral fits we infer that this emission is not likely produced in a multi-temperature accretion disk but more likely arises from thermal emission at the NS surface.
We note that the product is very close in the three sources. The spectral shape and the product are very stable during the outburst as is observed in other sources too (e.g. Gierliński & Poutanen, 2005). The constancy of the spectral slopes during the outbursts and their extreme similarity in different MSPs can be used as an argument that the emission region geometry does not depend on the accretion rate. If the energy dissipation takes place in a hot shock, while the cooling of the electrons (that emit X/-rays via thermal Comptonization) is determined by the reprocessing of the hard X-ray radiation at the neutron star surface (so called two-phase model, the spectral slope is determined by the energy balance in the hot phase and is a function of the geometry. At constant geometry (e.g. slab), the temperature depends on the optical depth, but is approximately constant.
| XTE J1708-294 | IGR J00291+5934 | HETE J1900.1-2455 | |
| (f) | (f) | (f) | |
| or (keV) | – | 0.43 | 0.8 |
| (km) | – | – | |
| (km) | – | – | |
| (keV) | |||
| (keV) | |||
| (km2) | |||
| cos | 0.59 | ||
| ( erg s-1) | 3.6 | 3.7 | 4.9 |
3 Timing
The timing analysis of IGR J00291+5934 showed for the first time that INTEGRAL/ISGRI is capable of detecting the pulse profile of a 1.67 ms pulsar up to 150 keV. This allowed us to study the pulsed fraction up to this high energy. We confirmed for the first time the increase of the pulsed fraction with energy in an accretion powered MSP. This can be explained by two models: the action of the Doppler effect on the exponentially cutoff Comptonization spectrum from the hot spot, or a componization model where the pulsed fraction is produced in a corona cloud. We also measured soft time lags with a complex energy dependence. Similarly to SAX J1808.4-3658 and XTE J1751-350, the time lags increase rapidly with energy until 10 keV. However, in IGR J00291+5934, the time lags first increase and then decrease slightly, saturating above 15 keV, and possibly reaching zero around 50 keV, see Fig. 6.
3.1 Pulsed fraction of X-rays
We found for IGR J00291+5934 using the RXTE and INTEGRAL/ISGRI data that the pulsed fraction gradually increases with energy from at 6 keV to near 100 keV. This is the first time such behaviour has been measured for any of the accretion-powered MSPs.
Since MSPs are rapidly rotating, a first interpretation is given through a Doppler boosting model which affects the fast rotating spot emitting pattern as a black body. When the spot moves towards the observer, the emission increases, while for a spot moving away, the flux drops. The Doppler factor reaches the maximum a quarter of a period before the peak of the projected area, shifting the emission peak towards an earlier phase. The observed flux due to the Doppler effect varies as the Doppler factor to the power (Poutanen & Gierliński, 2003; Viironen & Poutanen, 2004), where the photon index could be a function of energy. If the Doppler factor varies around 1 with 2% amplitude, we get 10% variability.
The Comptonized spectrum can be approximated as
| (1) |
where is the energy of the cutoff and parameter describes its sharpness. The local photon index is then
| (2) |
At low energies, , and rms (or pulsed fraction) is a very weak function of energy. Close to the cutoff, the spectral index rapidly increases and the pulsed fraction should grows with energy, as observed (see Fig. 5a). The Comptonization models predict softening of the total spectrum with simultaneous hardening of the pulsed spectrum at higher energies.
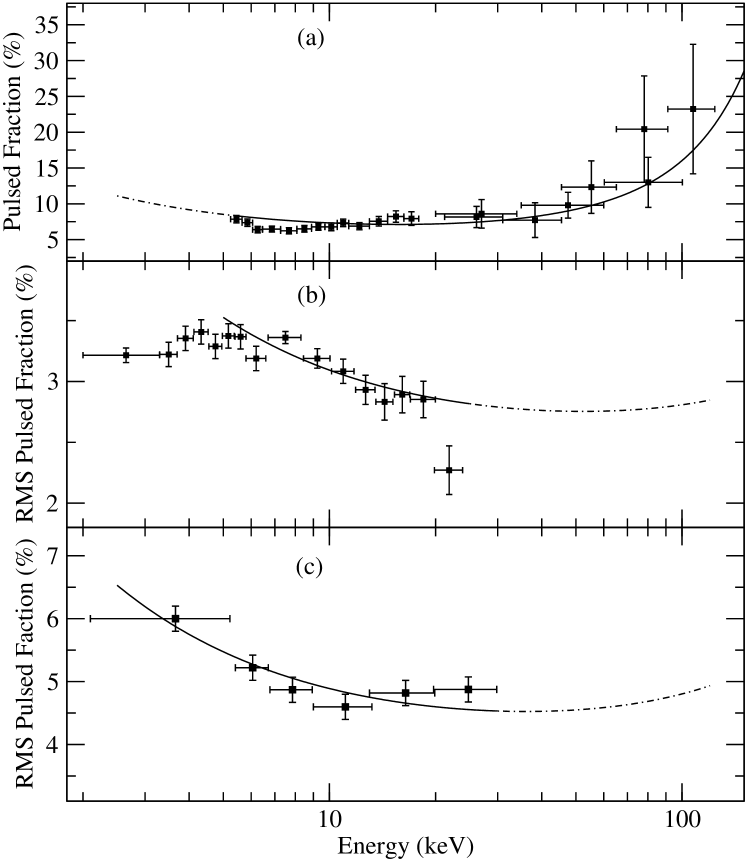
On the other hand, the pulsed fraction of IGR J00291+5934 vs energy can be also explained by the energy dependent electron cross-section and consequently by Compton cloud optical depth as a function energy
| (3) |
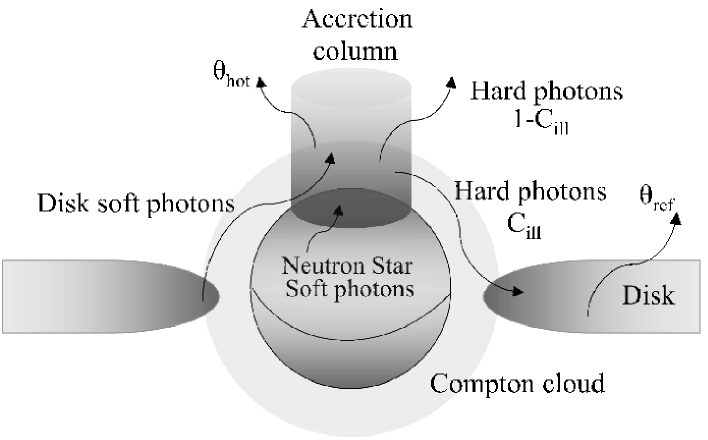
where is a dimensionless photon energy. In Figure 5 we show the energy dependent pulsed fraction of (a) IGR J00291+5934, (b) XTE J1751-305 and (c) SAX J1808.4-3658. In fact, we assume that the accretion column is embedded in Compton cloud as shown in Figure 4 (see also Titarchuk et al., 2002, for the geometry details). Because decreases with energy, at higher energies a larger fraction of the pulsed direct hard X-ray radiation
| (4) |
originating in the accretion column can escape to the observer.
A different scenario of the energy dependent amplitude formation would be if one can assume that there is no electron (Compton) cloud between the accretion column (where the Comptonization spectrum is formed) and the observer, but the energy dependence of the amplitude is formed as a result of upscattering. The soft photons upscattered off of hot electrons (of the accretion column) increase their energy with a number of scatterings. On the other hand, the amplitude of the pulsed radiation exponentially decreases with a number of scatterings , where is the inverse of an average number of scatterings (see e.g. Sunyaev & Titarchuk, 1980) and consequently with a energy of the upscattered photon
| (5) |
(where is approximately the energy index of the Comptonization spectrum). A characteristic seed (disk and NS) photon energy is keV and consequently, all photons at higher energies ( keV) are produced by upscattering. The amplitude of upscattered photons (in which the energy is higher 5 keV) should decrease with energy.
In the general case, some fraction of the pulsed soft photons, , upscatter off hot electrons in the accretion column on the way out as another fraction of the pulsed photons, , forming the hard X-ray tail escape to the observer passing through the Compton cloud. In this case a following combination of Eqs. (4 and 5)
| (6) |
leads us to the formula of the emergent pulsed amplitude.
In Figure 5 we present the best-fit model (see Eq. 6) along with data points. We fit only the data points which correspond to energies higher than the seed photon energy. We found for (a) IGR J00291+5934 the Compton cloud optical depth to be and %, %. For (b) and %, % and (c) and %, %, respectively. For all of the fits was .
3.2 Time lag
Additional information for the X-ray production processes and emission environment can be obtained by studying the pulse profile and phase shift between X-ray pulses at different energy ranges. For SAX J1808.4-3658 and later for XTE J1751-305 it was found that the low-energy pulses lag behind the high-energy pulses (soft phase/time lags) monotonically increasing with energy and saturating at about 10–20 keV (Cui et al., 1998; Ford, 2000; Gierliński & Poutanen, 2005).
First, this phase/time lag effect was interpreted as a result of the photon delay due to downscattering of hard X-ray photons in the relatively cold plasma of the disk or NS surface (Cui et al., 1998; Titarchuk et al., 2002). They argued that the photon time lags were an intrinsic signature of interaction of the Comptonized radiation with the NS and accretion disk plasma. Moreover, the absolute values of time lags (about hundreds s) are consistent with the electron scattering time scale . The effective Thomson optical depth of the cold reflector is about a few and typical sizes of the NS photosphere and half-width of the disk are of the order of cm. On the other hand, Poutanen & Gierliński (2003) suggested that the lags may be produced by a combination of different angular distribution of the radiation components and relativistic effects. The observed spectrum of IGR J00291+5934 consists of a black body from the neutron star surface and a component produced by Comptonization of these seed photons in the hot electron region, presumably a shock which can be represented as a plane-parallel slab. The angular distributions of the black body and Comptonized photons emitted by the slab are significantly different. The difference in the emission patterns causes the two components to show a different variability pattern as a function of the pulsar phase, with the hard Comptonized component leading the soft black body component. However, the soft lags found up to keV in the 1.67 ms accreting MSP IGR J00291+5934, show a more complex energy dependence (Falanga et al., 2005a).
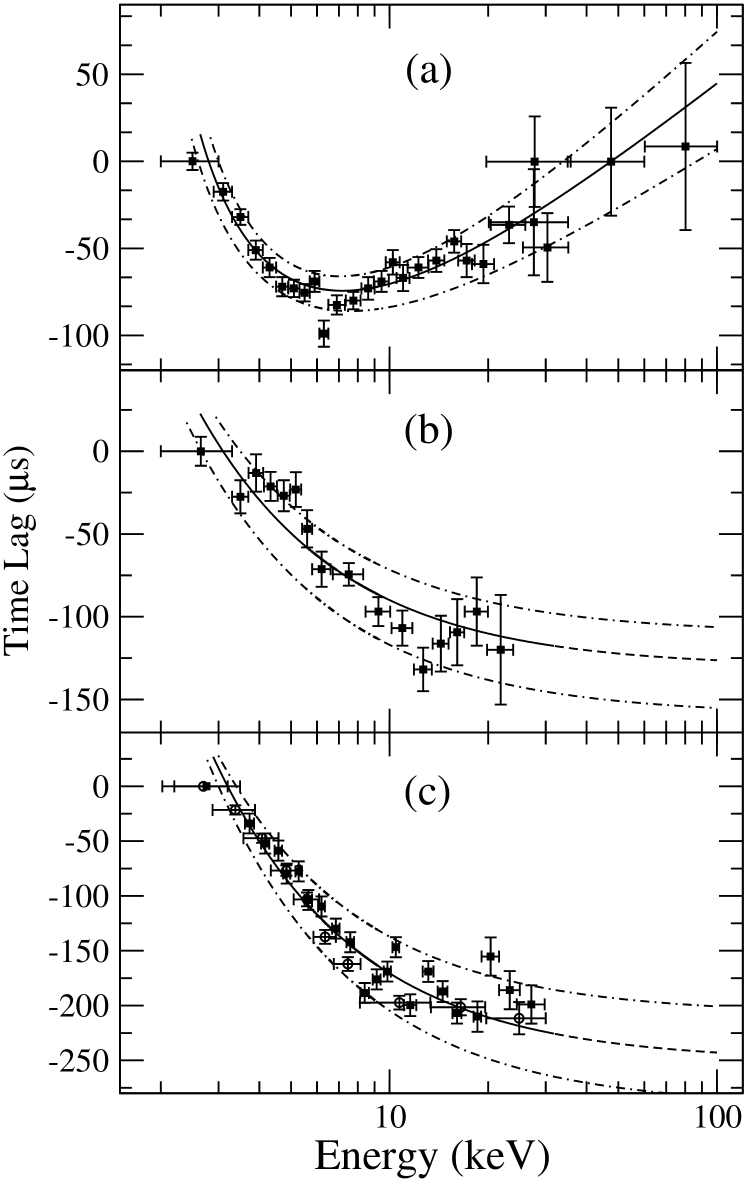
Recently, Falanga & Titarchuck (2007) derived a Comptonization model for the observed properties of the energy dependent soft/hard time lags. This accounts for the soft lag by downscattering of hard X-ray photons in the relatively cold plasma of the disk or neutron star surface. A fraction of soft X-ray photons coming from the disk or neutron star surface are upscattered off hot electrons of accretion column and this effect leads to the hard lags as a result of thermal Comptonization of the soft photons. The model allows the observed soft and hard lags to be reproduced by the downscattered and upscattered radiation as a function of the electron number densities of the reflector, , and the accretion column, . In the case of the accretion-powered millisecond pulsars IGR J00291+5934, XTE J1751-305, and SAX J1808.4-3658 the observed time lags agree very strongly with the model (see Fig. 6). The resulting time lags are seen as a linear combination of the positive (hard) time lags formed in the Comptonization emission area and the negative (soft) ones formed in accretion disk and NS photosphere as a result of reflection of the hard radiation (see Fig. 4):
| (7) |
where is the electron number density of the reflector, is the electron number density of the Comptonization emission area (accretion column) and is a dimensionless temperature of the reflector. We assume a typical value of keV/511 keV. and are the best-fit parameters for the hot plasma temperature and spectral index of the Comptonization spectrum, and .
We also assume that the seed photon energy is near the lowest energy of the downscattered photons, i.e. . An observational value of is about 3 keV, and we assume that the value of the illumination factor is about 0.1 (see for details Falanga & Titarchuck, 2007). To examine the predicted time lag using the Comptonization model Eq. (7), we use the observed pulse phase lag data and best-fit spectral parameters and of the accreting MSPs IGR J00291+5934, XTE J1751-305, and SAX J1808.4-3658. The SAX J1808.4-3658 data were taken from Cui et al. (1998); Ford (2000) and represented in Figure 6 by open circles and filled squares, respectively. The data for XTE J1751-305 and IGR J00291+5934 were taken by Gierliński & Poutanen (2005); Falanga et al. (2005a). For the reflector temperature we used keV for all fits. The model to fit the time lags in XTE J1751-305 and SAX J1808.4-3658 has only one free parameter (see (Falanga & Titarchuck, 2007)), the number density of the “cold” reflector . Presumably, in XTE J1751-305 and SAX J1808.4-3658 the density of the Comptonization region is much higher than that of the “cold” reflector, i.e. . It is not surprising that the seed photons are Comptonized (upscattered) in the very dense plasma of the accretion column (see e.g. Basko & Sunyaev, 1976; Becker & Wolff, 2006). The best-fit values are cm-3 and cm-3 for XTE J1751-305 and SAX J1808.4-3658, respectively. The fits of the time lag data for IGR J00291+5934 provide us the best-fit values of the “cold” and hot plasma densities. Both the positive (upscattering) and negative (downscattering) time lags contribute to the apparent time lags because cm-3 and cm-3 are of the same order of magnitude.
The time lag data of IGR J00291+5934, XTE J1751-305, and SAX J1808.4-3658 are collected in different time intervals lasting from hours to days (Cui et al., 1998; Ford, 2000; Gierliński & Poutanen, 2005; Falanga et al., 2005a). However, a hydrodynamical (density perturbation) time, , in the innermost part of X-ray NS source is on the order of the ratio of the NS radius to the sound speed, namely s. Thus, during the data collection periods the densities of the surrounding plasma can vary. As a result, the time lags also change because they are very sensitive to density variations (see Eq. 7). In fact, these density variations can be inferred from the time lag data. One can make a band between two curves of time lags vs energy which contain all of the time lag data points (see Fig. 6). This allows constraints to be put on and . The lower and upper curves in Figure 6 correspond (a) to cm-3 and cm-3, respectively. For the sources (b) XTE J1751-305 and (c) SAX J1808.4-3658 the density variations are cm-3 and cm-3. Thus, the plasma density of the “cold” reflector can change as much as 10 % during the entire data collection.
Soft lags are observed only if and thus the relative fraction of the dowscattering time lags in the total time lag sum is 100%. However, Comptonization in a non-uniform accretion medium might account for the observed time lag as a non-monotonic function of energy. Using this model, upper and lower limits of the atmosphere density (density variation) in the region of phase/time lag measurements were determined. Using the observed energy dependent pulsed amplitude one can find the variation of the Thomson optical depth of Compton cloud in which the accretion column is embedded.
4 Bursts
MSP are also known to exhibit Type-I X-ray bursts. These bursts were observed for SAX J1808.4-3658 and XTE J1814-338 (Galloway et al., 2006, 2006). Several X-ray bursts have also been observed for HETE J1900.1-2455 by various observatories (Galloway et al., 2006). One of these bursts was also observed during the INTEGRAL ToO observation (Falanga et al., 2006). In Figure 7 we show the JEM-X and ISGRI burst light curve (28 October 2005, 10:25:12 UTC) in different energy bands. The burst rise time was s. The double peak profile is clearly evident at high energy (lower panel) within the first 12 s, while during this time the intensity at lower energy (upper panel) remains constant. This can be interpreted as a consequence of a photospheric radius expansion (PRE) episode during the first part of the outburst (see e.g., Verbunt & van den Heuvel, 1995). When a burst undergoes a PRE episode, the luminosity remains nearly constant at the Eddington value, the atmosphere expands, and its temperature decreases resulting in a double-peak profile observed at high energies. The tail of the burst at high energy can be seen for about 5 s after the PRE episode.
A time-resolved analysis of the net burst spectrum based on the JEM-X/ISGRI 3-50 keV energy band data was well fit by a photoelectrically absorbed blackbody. During the first 12 s, the unabsorbed bolometric flux was almost constant at erg cm-2 s-1, while the blackbody temperature dropped in the middle, simultaneously with an increase by a factor of in blackbody radius. The observed temperature reached a peak at 2.5 keV, and then gradually decreased. The softening of the emission towards the end of the decay phase is also indicated by the e-folding decay times of s in the 3–6 keV to s in the 12–20 keV energy band. This behavior is typically observed during PRE X-ray bursts.
The burst fluence was erg cm-2, calculated by integrating the measured over the burst duration of s. The effective burst duration was s, and the ratio of the observed persistent flux to the net peak flux was . The burst has the same spectral parameters as previous bursts for this source observed with HETE-2 or RXTE (Galloway et al., 2006). Assuming a helium burst at the Eddington limit and canonical NS parameters (1.4 solar mass and radius of 10 km), the source distance is estimated to be kpc.
From the observed INTEGRAL burst properties and the mass accretion rates inferred from the persistent luminosity, the present theory predicts that this burst is pure helium burning. For helium flashes, the fuel burns rapidly, since there are no slow weak interactions, and the local Eddington limit is often exceeded. These conditions lead to PRE bursts with a duration, set mostly by the time it takes the heat to escape, of the order of 5–10 s, as observed. In the framework of the thermonuclear-flash models (e.g., Verbunt & van den Heuvel, 1995) the burst duration, s, and the ratio of the observed persistent flux to the net peak flux indicate a hydrogen-poor burst which is in agreement with the companion star being a helium-rich brown dwarf (Kaaret et al., 2006).
Because there were no other bursts observed during the INTEGRAL observation, the burst recurrence time, , must be at least one day. We can compute the ratio of the total energy emitted in the persistent flux to that emitted in the burst
which is consistent with pure helium bursts (see e.g. Verbunt & van den Heuvel, 1995). Taking the burst total energy release erg (derived from the fluence ) and He burning efficiency of MeV/nucleon erg g-1, we estimated the amount of fuel burned during the burst g. For the mean mass accretion rate of 2 per cent of the Eddington, a burst recurrence time of 2.2 days is expected.

5 Conclusions
The science of accreting millisecond pulsars has been carried forward by the high-energy capabilities of INTEGRAL in concert with the timing resolution capabilities of RXTE and the spectral resolution of XMM at low energies. INTEGRAL observations have contributed to our ability to characterize the high energy spectrum of these sources, and to study their interesting time-lag and pulse fraction behavior over a wide energy range, up to 150 keV.
The reason for the lack of coherent pulsations in the persistent emission from LMXBs has been a longstanding open question in X-ray astronomy. For the first time, we are able to observe a system (HETE J1900.1-2455) known to contain a millisecond period pulsar, which has continued in outburst after its pulsations have disappeared. The transition of HETE J1900.1-2455 from an X-ray millisecond pulsar to a persistent LMXB could indicate that there is a population of suppressed X-ray millisecond pulsars among the non-pulsating LMXBs. Detailed observations of this source at the epoch of pulsation supression can help to solving the long-standing issue of missing pulsations in persistent LMXB emission.
Acknowledgments
I am grateful to the INTEGRAL MSP paper collaborators J. Poutanen, E. W. Bonning, L. Kuiper, J. M. Bonnet-Bidaud, A. Goldwurm, W. Hermsen, L. Stella, and L. Titarchuk on the time/phase lag paper.
References
- Barret et al. (2000) Barret, D., Olive, J. F., Boirin, L., Done, C., Skinner, G. K., & Grindlay, J. E. 2000, ApJ, 533, 329
- Basko & Sunyaev (1976) Basko, M. M., & Sunyaev, R.A. 1976, MNRAS, 175, 395
- Becker & Wolff (2006) Becker, P. & Wolff, M. 2006, ApJ, accepted, astro-ph/0609035
- Chakrabarty et al. (20003) Chakrabarty, D. et al., 2003, Nature, 424, 42
- Cui et al. (1998) Cui, W., Morgan, E., & Titarchuk L. 1998, ApJ, 504, 27
- Falanga et al. (2005a) Falanga, M., Bonnet-Bidaud, J. M., Poutanen, J., et al. 2005a, A&A, 436, 647
- Falanga et al. (2005b) Falanga, M., Kuiper, L., Poutanen, J., et al. 2005b, A&A, 444, 15
- Falanga et al. (2006) Falanga, M., L., Poutanen, J., Bonning, E., W., et al. 2007, A&A, 464, 1069
- Falanga & Titarchuck (2007) Falanga, M., Titarchuck, L., 2007, ApJ, 661, 1084
- Ford (2000) Ford, E., C., 2000, ApJ, 535, L119
- Galloway et al. (2005) Galloway, D. K., Markwardt, C. B., Morgan, E. H., Chakrabarty, D., & Strohmayer, T. E. 2005, ApJ, 622, L45
- Galloway et al. (2006) Galloway, D. K., Morgan, E., H., Krauss H,. M., Kaaret P., Chakrabarty, D., 2006, ApJL, [arXiv:astro-ph/0609693]
- Galloway et al. (2006) Galloway, D., K., Muno, M., P., Hartman, J., M., Savov, P., Psaltis, D., Chakrabarty, D. , 2006, ApJS, [arXiv:astro-ph/0608259]
- Galloway et al. (2006) Galloway D., K., Cumming, A., 2006, ApJL, in press [arXiv:astro-ph/0607213]
- Gierliński et al. (2002) Gierliński, M., Done, C., & Barret, D. 2002, MNRAS, 331, 141
- Gierliński & Poutanen (2005) Gierliński, M., & Poutanen, J. 2005, MNRAS, 359, 1261
- Kaaret et al. (2006) Kaaret, P., Morgan, E. H., Vanderspek, R., & Tomsick, J. A. 2006, ApJ, 638, 963
- Mitsuda et al. (1984) Mitsuda, K., Inoue, H., Koyama, K., et al. 1984, PASJ, 36, 741
- Poutanen & Svensson (1996) Poutanen, J., & Svensson, R. 1996, ApJ, 470, 249
- Poutanen & Gierliński (2003) Poutanen, J., & Gierliński, M. 2003, MNRAS, 343, 1301
- Poutanen (2006) Poutanen, J. 2006, Adv. Space Res., in press [arXiv:astro-ph/0510038]
- Strohmayer (2001) Strohmayer, T. E., 2001, Adv. Space Res., 28, 511
- Sunyaev & Titarchuk (1980) Sunyaev, R.A. & Titarchuk, L.G. 1980, A&A, 86, 121
- Titarchuk et al. (2002) Titarchuk, L.G., Cui, W., & Wood, K.S., 2002, ApJ, 576, L49
- Verbunt & van den Heuvel (1995) Verbunt, F., & van den Heuvel, E. P. J. 1995, in X-ray binaries, eds. W. H. G. Lewin, J. van Paradijs, & E. P. J. van den Heuvel (Cambridge: Cambridge University Press), p. 457
- Viironen & Poutanen (2004) Viironen, K., & Poutanen, J. 2004, A&A, 426, 985
- Wijnands & van der Klis (1998) Wijnands, R., & van der Klis, M. 1998, Nature, 394, 344
- Wijnands (2005) Wijnands, R. 2005, in Pulsars New Research (NY: Nova Science Publishers), in press [astro-ph/0501264]