Energy dependent time lags as observational evidence of Comptonization effects in the neutron star plasma environment
Abstract
We present a Comptonization model for the observed properties of the energy-dependent soft/hard time lags and pulsed fraction (amplitude) associated with the pulsed emission of a neutron star (NS). We account for the soft lags by downscattering of hard X-ray photons in the relatively cold plasma of the disk or NS surface. A fraction of the soft X-ray photons coming from the disk or NS surface upscatter off hot electrons in the accretion column. This effect leads to hard lags as a result of thermal Comptonization of the soft photons. This model reproduces the observed soft and hard lags due to the down- and upscattered radiation as a function of the electron number densities of the reflector, , and the accretion column, . In the case of the accretion-powered millisecond pulsars IGR J00291+5934, XTE J1751-305, and SAX J1808.4-3658 the observed time lags agree well with the model. Soft lags are observed only if . Scattering of the pulsed emission in the NS environment may account for the observed time lags as a non-monotonic function of energy. The time lag measurements can be used as a probe of the innermost parts of the NS and accretion disk. We determine the upper and lower limits of the density variation in this region using the observed time lags. The observed energy-dependent pulsed amplitude allows us to infer a variation of the Thomson optical depth of the Compton cloud in which the accretion column is embedded.
Subject headings:
binaries: close – pulsars: individual (IGR J00291+5934, SAX J1808.4-3658, XTE J1751-305) – stars: neutron – X-ray: binaries1. Introduction
Accreting neutron star and millisecond pulsar (MSP) source spectra are successfully fitted by a two-component model consisting of Comptonization of higher temperature blackbody photons and thermal soft X-ray emission. The emergent radiation is presumably produced by thermal and dynamical Comptonization of seed photons coming from the NS surface and an accretion disk [for NS: e.g. (Titarchuk, Mastichiadis & Kylafis, 1996, 1997; Titarchuk & Shaposhnikov, 2005; Paizis et al., 2006) and MSP: e.g. (Gilfanov et al., 1998; Gierliński et al., 2002; Gierliński & Poutanen, 2005; Falanga et al., 2005a, b)].
Additional information for the X-ray production processes and emission environment can be obtained by studying the pulse profile and phase shift between X-ray pulses at different energy ranges. For SAX J1808.4-3658 and later for XTE J1751-305 it was found that the low-energy pulses lag behind the high-energy pulses (soft phase/time lags) monotonically increasing with energy and saturating at about 10–20 keV (Cui et al., 1998; Ford, 2000; Gierliński & Poutanen, 2005).
This time lag effect was first interpreted as a result of photon delay due to downscattering of hard X-ray photons in the relatively cold plasma of the disk or NS surface (Cui et al., 1998; Titarchuk et al., 2002). It was argued that the photon time lags were an intrinsic signature of the interaction of the Comptonized radiation with the NS and accretion disk plasma. Moreover, the absolute values of the time lags (about hundreds s) are consistent with the electron scattering time scale . Effective Thomson optical depth of the cold reflector is of the order of a few. Typical sizes of the NS photosphere and half-width of the disk are of the order of cm. On the other hand, Poutanen & Gierliński (2003) suggested that the lags may be produced by a combination of different angular distributions of the radiation components and relativistic effects. Recently, soft lags were also found up to keV in the 1.67 ms accreting MSP IGR J00291+5934, where a more complex energy dependence was revealed (Falanga et al., 2005a).
In this Letter, we present a model for the energy-dependent time lags as a result of photon downscattering and upscattering in a Comptonized medium. We show that the resulting time lag signs and behavior as a function of energy depend on the ratio of densities of the Compton emission area, NS surface area and accretion disk regions. By time lag, we mean the time or phase shifts between X-ray pulses at different energies.
2. Comptonization model of energy-dependent time lags
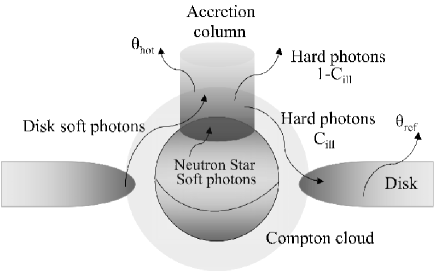
In Figure 1, we present a typical scenario of the formation of the X-ray spectrum of a NS binary. We assume that the hard radiation is produced in an accretion column or Compton cloud (Comptonization region) and illuminates the relatively cold material of the NS and disk. The emergent hard X-ray emission is a result of the upscattering of NS and disk soft photons off of hot electrons in the Comptonization region and the reflection of this upscattered radiation from the NS and disk surfaces. The physical parameters of the source, the geometrical and optical thickness of the disk, the disk plasma conductivity and the NS magnetic field determine the position of the inner edge of the disk and the illumination covering factor . The fraction of the hard photons intercepted by the disk and NS and ultimately reflected () can be in the range of at most 10–15%, depending on the details of the geometry. The parameter is a product of the albedo, , of the cold material (Basko, Sunyaev & Titarchuk, 1974) and the fraction of the Comptonized photons, , emitted by the isotropically radiated central source and then intercepted by the infinite disk. The fraction is less then 25% (Lapidus, et al., 1985). Thus . In Sec. 3, we use = 0.1 as a representative value for low magnetized ( G) neutron stars where the innermost edge of the disk is just a few kilometers from the NS surface.
The photon energy change per electron scattering depends on the photon energy, , and electron plasma temperature :
| (1) |
where is the dimensionless photon energy and is the dimensionless plasma temperature with respect to the electron rest energy (Sunyaev & Titarchuk, 1980). In a cold plasma (NS photosphere or accretion disk) for which the plasma temperature is much less than a given energy of the photon , the solution of the differential equation (1) is
| (2) |
where is the dimensionless energy of a given photon after scatterings for which the initial dimensionless energy is , is the dimensionless time measured in units of mean time between scatterings (number of scatterings), is the plasma number density, and is the Thomson electron cross-section. In a hot plasma, e.g. the Comptonization region, , is much higher than the seed photon energy . In this case, the solution of Eq. (1) is
| (3) |
The appropriate solution of the exact kinetic equation (Titarchuk & Lyubarskij, 1995) gives
| (4) |
where is the energy spectral index. One can approximate Eq. (4) by Eq. (3) if it is assumed that and . Note that Eq. (1) is obtained using a diffusion approximation.
The resulting time lags are a linear combination of the positive (hard) time lags formed in the Comptonization emission area and the negative (soft) ones formed in the accretion disk and NS photosphere as a result of reflection of the hard radiation (see Fig. 1):
| (5) |
where is the electron number density of the reflector, is the electron number density of the Comptonization emission area (accretion column) and is the dimensionless temperature of the reflector. We assume a typical value of keV/511 keV. and are the best-fit parameters for the hot plasma temperature and spectral index of the Comptonization spectrum respectively, and .
We also assume that the seed photon energy is near the lowest energy of the downscattered photons, i.e. (see Eqs. 2, 4). The observational value of is about 3 keV. We set the value of the illumination factor at about 0.1 (see above for details).
The essential model parameters for fitting the observed lags are the number densities and . Eq. (5) is insensitive to if . The first term in parentheses of Eq. (5) is related to the downscattering lags, and the second term is related to the upscattering lags. The positive (hard) lags cannot be observed if the density of the hot plasma is much higher than that of the “cold” reflector. This is because the mean free path between consecutive scatterings and therefore the time lag are inversely proportional to the number density . Consequently, the photons spend less time in the higher density plasma than in the lower density plasma to undergo the same number of scatterings.
The observer detects the negative (soft) lags only if and thus the relative fraction of the negative (downscattering) time lags in the apparent time lag sum is 100% (i.e. ). In this case, the observed absolute values of the soft time lags monotonically increase with energy. Using all of the conditions described above Eq. 5 can be written, after some algebra, as
| (6) |
This type of time lag correlation with energy was found for the first time in the accreting MSP SAX J1808.4-3658 (see Cui et al., 1998).
3. Application of the model to observed time lags
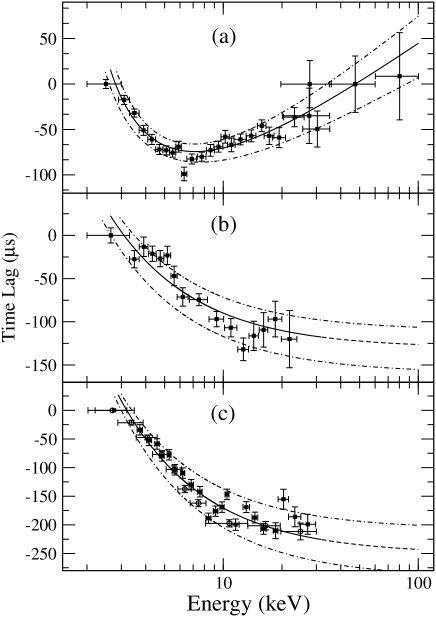
To apply the Comptonization model Eq. (5) to observed time lags, we used the observed pulse phase lag data and best-fit spectral parameters and of the accreting MSPs IGR J00291+5934, XTE J1751-305, and SAX J1808.4-3658. Figure 2 shows, from top to bottom, IGR J00291+5934, XTE J1751-305, and SAX J1808.4-3658 (Falanga et al., 2005a; Gierliński & Poutanen, 2005; Cui et al., 1998; Ford, 2000). The measurements were made either through computing cross-power spectra between different energy bands or through cross-correlating the folded pulse profile in different energy bands.
Figure 2 shows the best-fit curves using the Comptonization model described in Sec. 2. We used keV as the reflector temperature for all fits. The model for fitting the time lags in XTE J1751-305 and SAX J1808.4-3658 has only one free parameter, the number density of the “cold” reflector (see Sec. 2). Presumably, in XTE J1751-305 and SAX J1808.4-3658 the density of the Comptonization region is much higher than that of the “cold” reflector, i.e. . This may indicate that the seed photons are Comptonized (upscattered) in the very dense plasma of the accretion column (see e.g. Basko & Sunyaev, 1976; Becker & Wolff, 2006). The best-fit values are cm-3 and cm-3 for XTE J1751-305 and SAX J1808.4-3658, respectively. The fits of the time lag data for IGR J00291+5934 provide us with best-fit values for the “cold” and hot plasma densities. Both the positive (upscattering) and negative (downscattering) time lags contribute to the apparent time lag because cm-3 and cm-3 are of the same order of magnitude.
The time lag data of IGR J00291+5934, XTE J1751-305, and SAX J1808.4-3658 were collected in different time intervals lasting from hours to days (Cui et al., 1998; Ford, 2000; Gierliński & Poutanen, 2005; Falanga et al., 2005a). However, a hydrodynamical (density perturbation) time, , in the innermost part of the X-ray NS source is of the order of the ratio of the NS radius to the sound speed, that is, s. Thus, during the data collection periods, the densities of the surrounding plasma can vary. As a result, the time lags also vary since they are sensitive to density variations (see Eq. 5). Therefore, we can infer these density variations from the time lag data. We construct a corridor between two curves of time lag vs energy which includes all of the time lag data points (see Fig. 2). This allows us to constrain and . The lower and upper curves in Figure 2 correspond in panel (a) to cm-3 and cm-3, respectively. For the sources in panels (b) XTE J1751-305 and (c) SAX J1808.4-3658 the density variations are cm-3 and cm-3. Thus, the plasma density of the “cold” reflector can change as much as 10 % during the entire data collection.
4. Pulsed fraction of X-rays: observation and theory
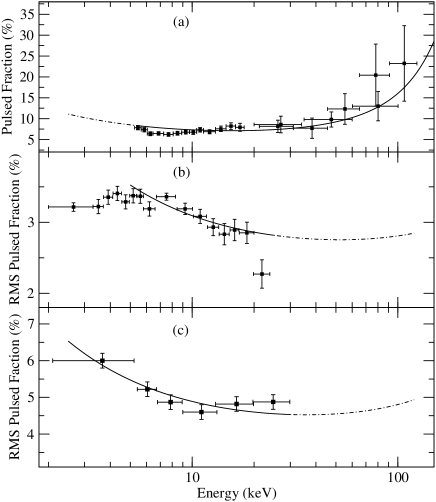
In Figure 3, we show the energy dependent pulsed fraction of (a) IGR J00291+5934, (b) XTE J1751-305 and (c) SAX J1808.4-3658. The pulsed fraction of IGR J00291+5934 vs energy is explained by the energy dependent electron cross-section (see e.g. Pomranning, 1973) and consequently by Compton cloud optical depth as a function of energy
| (7) |
We assume that the accretion column is embedded in the Compton cloud as shown in Figure 1 (see also Titarchuk et al., 2002, for the geometry details). Because decreases with energy, a larger fraction of the pulsed direct hard X-rays which originated in the accretion column can escape to the observer. This fraction is given by
| (8) |
A different scenario of energy dependent amplitude formation can be if there is no electron (Compton) cloud between the accretion column (where the Comptonization spectrum is formed) and the observer. In this case the energy dependence of the amplitude is formed as a result of upscattering. The soft photons upscattered off hot electrons (in the accretion column) increase their energy with the number of scatterings. On the other hand, the amplitude of the pulsed radiation exponentially decreases with the number of scatterings , where is the inverse of the average number of scatterings (see e.g. Sunyaev & Titarchuk, 1980) and consequently with an energy of the upscattered photon (see Eq. 3)
| (9) |
(where is approximately the energy index of the Comptonization spectrum). A characteristic seed (disk and NS) photon energy is keV. Consequently, all photons at higher energies ( keV) are produced by upscattering, and their amplitude should decrease with energy.
In the general case, some of the pulsed soft photons, (a fraction ), may upscatter off hot electrons in the accretion column on the way out as other pulsed photons (a fraction ) forming the hard X-ray tail may escape to the observer while passing through the Compton cloud. In this case, the following combination of Eqs. (8 and 9)
| (10) |
lead to the formula of the emergent pulsed amplitude.
5. Discussion and Conclusions
In this Letter we have shown that the short time lags, phase shifts of the order of 100 s between X-ray pulses at different energy ranges, detected in the accreting MSPs are the result of photon upscattering and downscattering in the plasma environment of the NS. In our model the Comptonization emission area, NS surface, and accretion disk are responsible for the time lag formation. The photon time lag correlations as a function of the electron densities of the reflector, n, and the accretion column, n, at a given energy are successfully reproduced for a reasonable choice of model () and best-fit photon spectral parameters (). As illustrated in the schematic view of the accretion flow (see Fig. 1), the hard X-ray photons are downscattered in the relatively cold plasma of the disk and therefore produce the observed soft lags. The observed hard time lags are a result of thermal upscattering of soft photons coming from the disk and NS off hot electrons of the Comptonized region. This conclusion is based on the spectral shape of the emergent spectrum and time lag behavior as a function of photon energy for three MSP sources. Indeed, we find for IGR J00291+5934 with a s that , indicating that the densities of the relatively “cold” disk plasma and of the accretion column are on the same order of cm-3 for . For SAX J1808.4-3658 and XTE J1751-305 the observed energy-dependent time lags need disk density of a factor of seven higher. The hard lags of the emission due to Compton upscattering are negligible because of the expected compactness of the accretion column region.
However, one can notice in Figure 2 that there are signs of turnover (saturation) for time lags vs energy at 20 keV for SAX J1808.4-3658 and XTE J1751-305 which are similar to that in IGR J00291+5934 which has a turnover at about 7 keV. The high values of with respect to would not allow us to see the contribution of the hard lags in the resulting time lag vs energy plot.
It is also important to emphasize that the energy-dependent time lags allow us to reveal the plasma density variation within 10% near the NS. It implies that the mass accretion rate and ultimately the observed luminosity should also vary within 10%. Thus, we can conclude that the observed variability of X-ray radiation in the compact objects is presumably driven by this variation of the density of the mass accretion there.
Measurements of time lags have been done for black hole binaries (e.g. Kylafis & Klimis, 1987; Miller, 1995; Nowak, 1995). Making a comparison between these measurements and that of time/phase shifts between X-ray pulsations in accreting MSPs is difficult. In the case of black hole binaries, the time lag is generally calculated in two different energy bands and is related to different Fourier frequencies. For black holes, the Fourier frequency dependence can be due to hydrodynamical disk instability, mass accretion configuration, or quasi-periodic instability. This work with accreting millisecond NSs provides a unique advantage since the X-ray pulsations give a perfect clock which allows to determine precise information about the photon delay at different energy bands.
References
- Basko & Sunyaev (1976) Basko, M. M., & Sunyaev, R.A. 1976, MNRAS, 175, 395
- Basko, Sunyaev & Titarchuk (1974) Basko, M. M., & Sunyaev, R.A. & Titarchuk, L. 1974, A&A, 31, 249
- Becker & Wolff (2006) Becker, P. & Wolff, M. 2006, ApJ, accepted, astro-ph/0609035
- Cui et al. (1998) Cui, W., Morgan, E., & Titarchuk L. 1998, ApJ, 504, 27
- Falanga et al. (2005a) Falanga, M., Kuiper, L., Poutanen, J., et al. 2005a, A&A, 444, 15
- Falanga et al. (2005b) Falanga, M. et al. 2005b, A&A, 436, 647
- Ford (2000) Ford, E. C. 2000, ApJ, 535, L119
- Gierliński et al. ( 2002) Gierliński, M., Done, C., & Barret, D. 2002, MNRAS, 331, 141
- Gierliński & Poutanen (2005) Gierliński, M., & Poutanen, J. 2005, MNRAS, 359, 1261
- Gilfanov et al. (1998) Gilfanov, M., et al. 1998, A&A, 338, L83
- Kylafis & Klimis (1987) Kylafis, N. D. & Klimis, G. S. 1987, ApJ 323, 678
- Lapidus, et al. (1985) Lapidus, I.I., Sunyaev, R.A. & Titarchuk, L. 1985, Astrofizika, 23, 515
- Miller (1995) Miller, M. C. 1995, ApJ 441, 770
- Nowak (1995) Nowak, M. A. et al. 1999, ApJ 515, 726
- Pomranning (1973) Pomranning, G.C. 1973, The Equations of Radiation Hydrodynamics (Pergamon Press: Oxford)
- Paizis et al. (2006) Paizis, A., et al., 2006, A&A, in press astro-ph/0607592
- Poutanen & Gierliński (2003) Poutanen, J., & Gierliński, M. 2003, MNRAS, 343, 1301
- Sunyaev & Titarchuk (1980) Sunyaev, R.A. & Titarchuk, L.G. 1980, A&A, 86, 121
- Titarchuk et al. (2002) Titarchuk, L.G., Cui, W., & Wood, K.S., 2002, ApJ, 576, L49
- Titarchuk & Lyubarskij (1995) Titarchuk L., & , Lyubarskij, Yu. 1995, ApJ, 450, 876
- Titarchuk, Mastichiadis & Kylafis (1997) Titarchuk, L. G., Mastichiadis, A., & Kylafis, N. D. 1997, ApJ, 487, 834
- Titarchuk, Mastichiadis & Kylafis (1996) Titarchuk, L. G., Mastichiadis, A., & Kylafis, N. D. 1996, A&A, 120, 171
- Titarchuk & Shaposhnikov (2005) Titarchuk, L. & Shaposhnikov, N. 2005, ApJ, 626, 298