An XMM-Newton view of M101 - III. Diffuse X-ray emission
Abstract
We present a study of the X-ray properties of the nearby face-on Scd spiral galaxy M101 based on recent XMM-Newton observations. In this third and final paper in the present series, we focus on the spatial and spectral properties of the residual emission, after excluding bright X-ray sources with . Within a central region of radius 10′ (21 kpc), the X-ray emission broadly traces the pattern of the spiral arms, establishing a strong link with recent star formation, but it also exhibits a radial scale length of (5.4 kpc) consistent with optical data. We estimate the soft X-ray luminosity within the central (10.5 kpc) region to be (0.5–2 keV), the bulk of which appears to originate as diffuse emission. We find a two-temperature thermal model best fits the spectral data with derived temperatures of 0.20 keV and 0.68 keV which are very typical of the diffuse components seen in other normal and starburst galaxies. More detailed investigation of the X-ray morphology reveals a strong correlation with images recorded in the far-UV through to V band, with the best match being with the U band. We interpret these results in terms of a clumpy thin-disk component which traces the spiral arms of M101 plus an extended lower-halo component with large filling factor.
keywords:
galaxies: individual: M101 – galaxies: spiral – X-rays: galaxies – X-rays: ISM1 Introduction
The hot ( K), X-ray emitting plasma observed in the disk of our Galaxy is an important factor when considering the energy balance and enrichment of the interstellar medium (ISM). Energised by the winds of young massive stars and supernovae, its properties relate to the supernova rate, the evolution of supernova remnants (SNRs) and the impact of young star clusters on their environment. In normal spiral galaxies like the Milky Way, hot gas produced by multiple supernova explosions may escape from the disk via galactic fountains and/or chimneys (Shapiro & Field 1976; Bregman 1980; Norman & Ikeuchi 1989) resulting in a dynamic corona that is bound to the galaxy. This gas then cools, condenses and falls back to the disk, possibly as high-velocity clouds (Bregman, 1980). In contrast, the extremely high star-formation rates in starburst galaxies give rise to hotter ( K) large-scale metal-rich outflows from the starburst regions in the form of “superwinds” (e.g., Heckman, Armus, & Miley 1990). Such superwinds are energetic enough to fully escape the influence of the galaxy and are potentially important for the enrichment and heating of the intergalactic medium (e.g., Martin, Kobulnicky & Heckman 2003).
Unfortunately, the opacity of the galactic plane to soft X-rays greatly complicates the study of the extent, physical properties and filling factor of the X-ray emitting plasma in our own galaxy. However, observations of nearby spiral galaxies with configurations ranging from face-on to edge-on can circumvent many of the problems inherent in studies of the Milky Way. The Einstein observatory provided the first detection of ultra-hot out-flows from the disks of edge-on starburst galaxies (Watson et al. 1984), although only upper limits were obtained on the diffuse emission produced in the disks of normal spiral galaxies (Bregman & Glassgold 1982; McCammon & Sanders 1984). The improved throughput and spatial resolution of subsequent ROSAT PSPC/HRI observations revealed unambiguous evidence for truly diffuse emission in spiral galaxies (Cui et al. 1996; Read et al. 1997). More recently, diffuse structures have been observed with the XMM-Newton and Chandra observatories in samples of both edge-on (Pietsch et al. 2001; Stevens, Read, & Bravo-Guerrero 2003; Strickland et al. 2004a; Strickland et al. 2004b) and face-on spiral galaxies (Kuntz et al. 2003; Tyler et al. 2004). In the face-on systems, diffuse X-rays were found to correlate with the nuclear regions, trace recent star formation within the spiral arms and correlate spatially with H and mid-infrared emission (Tyler et al., 2004). In the survey of edge-on systems by Strickland et al. (2004a,b), extra-planar diffuse emission was detected in all starburst galaxies and one normal spiral galaxy, the extent of which correlated with estimates of the rate of star formation within the disks.
| # | Observation ID | Date | Filter | Pointing co-ordinates | Useful exposure (ks) | |||||
|---|---|---|---|---|---|---|---|---|---|---|
| (yyyy-mm-dd) | RA (J2000) | Dec (J2000) | pn | MOS | ||||||
| 1 | 0104260101 | 2002-06-04 | Medium | 25.7 | 36.7 | |||||
| 2 | 0164560701 | 2004-07-23 | Medium | 26.2 | 28.9 | |||||
| 3 | 0212480201 | 2005-01-08 | Thin | 27.7 | 25.8 | |||||
Clearly, if the purpose is to image the X-ray emission over a wide bandwidth, one should preferentially select galaxies in directions where the line-of-sight Galactic hydrogen column density is low. In this context, the Scd supergiant spiral M101 (NGC 5457), for which (Dickey & Lockman, 1990), is an ideal candidate for a face-on study. A diffuse X-ray component was first hinted at in the central regions of M101 with Einstein at energies in the range 0.2–1.5 keV (McCammon & Sanders 1984; Trinchieri et al. 1990). Subsequent ROSAT PSPC observations (Snowden & Pietsch, 1995) revealed extensive diffuse X-ray emission in the 0.1–1 keV band, corresponding to thermal emission in the temperature range 1–3 K. The dominant soft component was spatially peaked towards the centre of the galaxy but could also be traced out to a radius of at least 7′ (15 kpc at a distance of 7.2 Mpc). It was argued that this soft emission could not originate solely in the disk as this would require a filling factor greater than unity. After correcting for absorption intrinsic to M101, the total diffuse luminosity was estimated to be at least .
In the ROSAT HRI study of Wang et al. (1999), low-surface-brightness X-ray emission was detected both in the central region of M101 and in the vicinity of bright HII regions in the spiral arms of the galaxy. The improved spatial resolution of the HRI (′′ ) allowed the detection and subtraction of point sources down to a luminosity of , after which the total 0.5–2 keV luminosity of the residual emission within a radius of 12′ was estimated to be . These authors agreed with Snowden & Pietsch (1995) that faint discrete X-ray sources were likely to account for only a fraction of the observed flux, implying that the bulk of the soft emission is truly diffuse in nature. The X-ray spectra of the emission in the central region from both the ROSAT PSPC and ASCA GIS were fitted simultaneously, yielding a soft thermal component with a temperature of keV, plus a hard power-law continuum most plausibly explained as the integrated emission of the population of hard X-ray binary sources (XRBs) in M101.
Further progress was made in the Chandra study of Kuntz et al. (2003), using data from the 8′ square ACIS-S3 chip from the first 100 ks Chandra observation of M101. The superb spatial resolution of Chandra allowed the removal of point sources down to luminosities of , leaving residual emission of luminosity 2.3 in the 0.45–1.0 keV band, 16% of which was estimated to come from unresolved XRBs and dwarf stars. The bulk of the soft emission was found to trace the spiral arms and was also spatially correlated with H and far ultra-violet (UV) emission, physically linking the soft X-ray emission to regions of on-going star formation. The X-ray spectrum of the diffuse emission was well-described by a two-temperature thermal plasma with =0.2/0.75 keV, with a large covering factor implying that a significant fraction of the softest component originates in the halo of M101.
This is the third in a series of papers reporting the results of XMM-Newton observations of M101. In Jenkins et al. (2004a) (hereafter Paper I), the spectral and timing properties of the brightest X-ray sources were investigated, whereas in Jenkins et al. (2005b) (hereafter Paper II) we reported on the full catalogues of X-ray source detected in M101 by XMM-Newton. In the current paper we focus on the morphology and spectral properties of the “diffuse” X-ray component in this galaxy. The structure of this paper is as follows. First we describe the XMM-Newton observations and the methods used to construct images and spectra of the residual emission after the exclusion of bright discrete sources (section 2). Next we investigate the likely composition, spectral properties and spatial morphology of this residual emission (section 3). We then go on to discuss the implications of our results (section 4) and, finally, provide a brief summary of our conclusions (section 5). Throughout this paper we assume a distance to M101 of 7.2 Mpc (Stetson et al. 1998), implying that an angular scale of 1′ corresponds to a linear extent of 2.09 kpc in M101.
2 Observations & Data Reduction
Three XMM-Newton EPIC observations have been made of M101 as summarised in Table 1. Our earlier analysis of the point source population in M101, presented in Papers I and II of this series, utilised only the first observation performed in 2002. However, for this paper, we have taken advantage of two additional observations carried out by XMM-Newton in 2004/5 as a Target of Opportunity (TOO) programme to follow up the outburst of the ultraluminous supersoft X-ray source J140332.3+542103, (see Kong, Di Stefano, & Yuan 2004; Mukai et al. 2005). The first XMM-Newton observation was targeted at the nucleus of the galaxy with the result that the 30′ diameter field-of-view of the EPIC cameras encompassed the full 28.8′ (D25) extent of M101 (de Vaucouleurs et al. 1991). In the second and third observations the source J140332.3+542103 was placed on axis, resulting in a eastward offset of the field-of-view with respect to the first observation.
All datasets were screened for periods of high background by accumulating full-field 10–15 keV light curves. MOS data were excluded during periods when the 10-15 keV count rate exceeded 0.3 , and the pn data were similarly screened when the pn count rate exceeded 3 (except in observation 1, which was more heavily contaminated by flaring, where the pn threshold was set at 0.9 ). For the subsequent image and spectral analysis, single and double pixel events were selected for the pn (pattern 0–4), whereas single to quadruple events (pattern 0–12) were utilised in the case of the MOS data.
2.1 Image processing and point source subtraction
To study the morphology of the diffuse component, pn and MOS images and associated exposure maps were created for each observation in three energy bands: soft (0.3–1 keV), medium (1–2 keV) and hard (2–6 keV). In each case the pixel size was set at . The pn, MOS 1 and MOS 2 images in each of the three bands were first flat-fielded by subtracting a constant (non-vignetted) background particle rate (estimated from the count rates recorded in the corners of the CCD detectors not exposed to the sky) and then dividing by the appropriate exposure map. In the same process bad pixels, hot columns and spurious data along chip gaps were excised. The resulting data from the three observations were then mosaiced into flat-fielded pn and MOS (MOS 1 plus MOS 2) images for each band. Since the medium and hard band images showed no evidence for diffuse emission, here we focus primarily on the images obtained in the soft (0.3-1 keV) band. Figure 1(a) shows an adaptively-smoothed soft-band image, obtained from the combined pn and MOS datasets, encompassing the central 20′ diameter region centred on the optical nucleus of M101 (RA , Dec ) . The amplitude scaling is logarithmic and adjusted so as to highlight the extended low surface brightness emission in M101.
To facilitate the investigation of the contribution of bright sources to the total X-ray emission in M101, a master sourcelist, applicable to the three observations, was created. To this end, each of the new observations was analysed in turn using the source detection procedure described in Paper II (applied to the soft, medium and hard band data). Then, by comparing the resulting source lists, the 108 sources detected in observation 1 (Paper II) were supplemented by 21 new sources from observation 2 and an additional 9 new sources from observation 3, to give a combined source catalogue of 138 sources (see the Appendix for details of the new sources).
The next step involved the construction of a spatial mask for the suppression of the bright X-ray sources in the central field of M101. Using the pn+MOS flat-fielded soft-band image, a soft-band source count rate, net of the local background, was determined at each source position; in practice, we extracted the count rate within a cell of radius centred on the source position, subtracted the local background, and lastly applied a correction for the extent of the point spread function (PSF) beyond the source cell. We then selected the sources within 11′ radius of the nucleus of M101 with count rates above 1.5 pn+MOS as a “bright source sample” to be excised from the the soft-band image. Here our approach was to construct a model image in which each source in our bright source list was represented by a PSF sub-image centred on the source position and an intensity scaling commensurate with the measured source count rate. Then by applying a cut at a surface brightness threshold of 0.01 pn+MOS , we were able to construct a bright source mask - see Fig. 1(b). A total of 65 bright soft-band sources were removed within a radius of 11′ of the nucleus of M101 (25 sources within 5′ ).
Figure 1(c) shows the pn+MOS soft-band image of M101 after applying the bright source mask with the colour table adjusted to highlight the distribution of the residual emission111Hereafter in this paper we use the word “residual” to describe the X-ray emission of M101 after masking out the bright discrete X-ray sources. This residual component will include the truly diffuse emission, the integrated emission of discrete sources with count rates below our source-exclusion threshold and also some low-level contamination from bright sources due to the spillover beyond the masked regions of their extended PSFs - see Fig. 1(b)..
The residual component is most prominent within the the central 5′ radius region, although it can be traced out to 10′ in the radial profile distribution shown in Fig. 2. There is a clear correlation with the spiral structure of the galaxy, as is evident from a comparison with the GALEX near-UV (NUV; 2310 Å) band image of M101 (Bianchi et al. 2005; Popescu et al. 2005) shown in Fig. 1(d).

2.2 Spectral extraction of the diffuse component
The images in Fig. 1 demonstrate the existence of an extensive residual component in the soft X-ray emission of M101. In order to investigate the spectral properties of this component we have extracted spectral data for the 5′ radius region, centred on the position of the nucleus. A total of nine individual diffuse emission spectra were derived from the appropriate event files (for the three EPIC instruments, over the three observations). In each case, regions around bright point sources were excluded using the mask described earlier (in practice this involved the use of circular exclusion cells of radius , as an approximation to the source mask used in the image analysis).
Given the extended nature of the diffuse emission, the background subtraction is more complicated than is usual with EPIC data. The use of other XMM-Newton data sets deriving from “blank-field” observations is, in our view, not a good option due to the variation from field to field in the soft X-ray background from the sky - clearly an important consideration when attempting to measure a soft diffuse signal. Instead local background (LBG) spectra were extracted from each event file for the annular region from 5′ to 10′ radius - see Fig. 1(a) - again with the regions around bright sources excluded. We also extracted particle background (PBG) spectra from the out-of-field-of-view corner regions in each EPIC camera. The true background beneath the residual M101 emission in the central source region will be made up primarily of (vignetted) photons from the X-ray sky and (non-vignetted) particles, which comprise the instrumental background. The LBG spectra will also have photon and particle components, but, as the LBG region is further off-axis than the source region, these components are not in the correct ratio for accurate background subtraction (since the signal reduction due to the vignetting is larger in the LBG region). However, a very good model of the true background can be made from a combination of the LBG and PBG spectra, provided the contributions of the two are appropriately scaled222The scale factors applied to the LBG and PBG spectra were respectively and . Here , and refer to the actual areas on the detector of the central, LBG and PBG extraction regions. Similarly and are the average vignetting factors within the central and LBG regions. to allow for the vignetting-corrected and actual areas of the central, LBG and PBG extraction regions. Using this approach, an appropriate composite background was determined for each central region spectrum together with the corresponding ARF and RMF files. Finally for each dataset, the spectral channels were binned together to give a minimum of 20 counts per bin.
Given the radial profile in Fig. 2, the above amounts to a differential measurement of the galaxy spectrum, which in effect compares the integrated signal in the central 5′ region with the equivalent signal measured in the 5′ - 10′ annular region.
3 Results
3.1 Luminosity and composition of the residual emission
After the exclusion of the bright source regions and subtracting the mean sky surface brightness measured in the 5′ –10′annulus, the count rate in the central 5′ region is 0.28 pn+MOS (0.3–1 keV). However, we need to apply three correction factors to obtain the “true” central 5′ count rate. The first accounts for the loss of “diffuse” signal due to the source mask which blocks 12% of the central area. The second factor allows for the differential nature of the measurement (i.e., the fact that we extract the background from the 5′ -10′ annulus where the galaxy is still bright); on the basis of the radial profile determined earlier we estimate that this effect suppresses the central count rate by . Finally, the spillage of the bright source signal beyond the masked region (due to the extended PSF) contributes about 9% of the measured residual count rate (as determined from the source model image shown in Fig. 1(b)). The correction of all three effects translates to a 28% upward scaling of the residual count rate. If we adopt the best-fitting two-temperature model described in section 3.2, the count rate to flux conversion factor is 1 pn+MOS = for the 0.5–2.0 keV band (fluxes corrected for Galactic absorption). The equivalent factors for the 0.3–1 keV and 0.45–1 keV bands are and respectively.
The implied luminosity of the central emission of M101 after excluding bright sources is in the 0.5–2 keV band. However, we must take into account the fact that our source exclusion threshold is relatively high (roughly a factor 10 higher than that employed in the equivalent Chandra study - Kuntz et al. 2003). Chandra has shown that the log N - log S relation for relatively faint sources in the central region of M101 (after correction for background AGNs) is quite flat with a slope of in the integral counts (Pence et al., 2001), implying that bright sources provide the dominant contribution to the discrete source luminosity of the galaxy. Using the count rate to flux conversion factor quoted earlier, our source exclusion threshold of 1.5 pn+MOS (0.3–1 keV) corresponds to a source luminosity of (0.5–2 keV), although this could be an underestimate for the harder spectral forms more typical of bright X-ray binaries. In fact, a source exclusion threshold of appears to be a reasonable estimate based on the average count rate to flux conversion obtained when we compare our measurements with those quoted in Pence et al. (2001) for the sub-set of common sources. As a check, at the latter luminosity threshold the Chandra source counts predict sources within a central 5′ region, which is very consistent with the number of sources actually excluded in our study. Using the Chandra source counts, we find the integrated luminosity in discrete sources from our exclusion cut-off down to a factor 10 deeper (in effect the Chandra limit) amounts to about 20% of the residual signal measured by XMM-Newton. In other words, our estimate of the “diffuse” luminosity of M101 (after allowing for the contribution of sources brighter than ) is (0.5–2 keV) in good agreement with the value reported by Kuntz et al. (2003) based on Chandra measurements of the same region.
3.2 Spectral properties of the residual emission
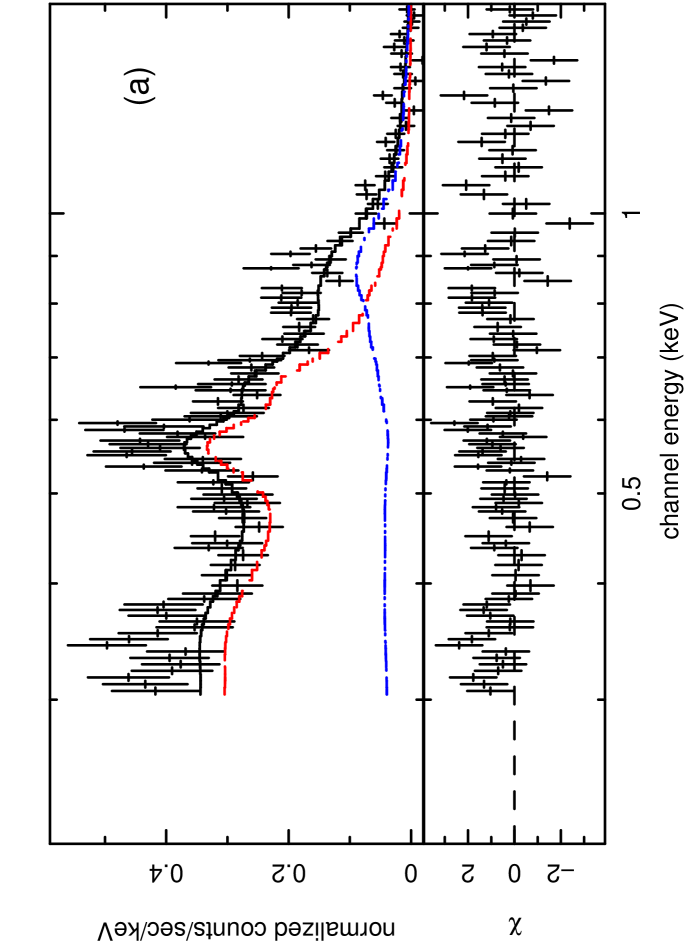
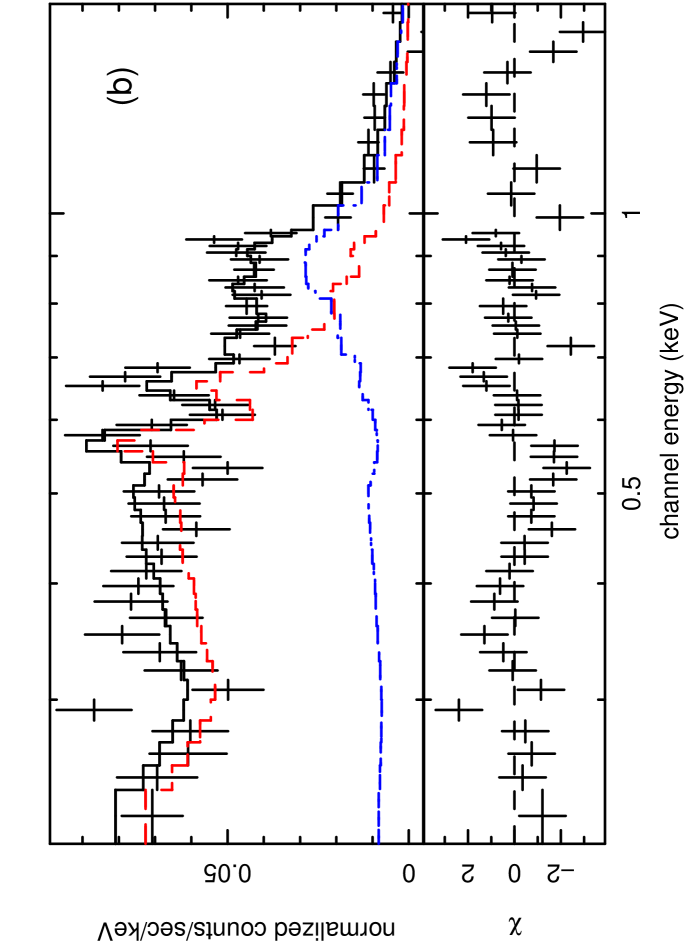
The nine epic spectra were fitted simultaneously using a variety of spectral models, with identical model parameters applied to each of the data sets. Visual inspection of the spectra indicated almost no emission above keV. No acceptable fit could be obtained using just a single hot plasma component. However, a good fit (reduced =0.87 for 2986 degrees of freedom) was obtained with a model incorporating two thermal (solar-abundance) Mekal components, with absorption attributable to the hydrogen column density of our Galaxy in the direction of M101 (1.16 cm-2; Dickey & Lockman 1990). The derived temperatures for the two components were 0.20 keV and 0.68 keV (90% confidence limits assuming 1 interesting parameter). The data plus best fitting two-temperature model are shown in Fig 3. (In this figure we show the averages of the three pn and the six MOS spectra for clarity of display; however, the spectral fitting results quoted here pertain to the fits to the nine individual spectra). The absorption-corrected flux in the 0.3–1 keV band derived from the spectral fits was 3.0 erg cm-2 s-1 of which the hotter component contributes %. The corresponding values for the 0.5–2.0 keV band are 2.5 erg cm-2 s-1 with the hotter component contributing %. When we allowed the metallicity of the two plasmas to vary from unity (i.e., solar values) we obtained a best fit of 0.044 (0.038-0.055) solar for the lower-temperature component and 0.17 (0.10-0.50) solar for the hotter component (with a reduced for the fit of 0.81). However, this determination of strongly sub-solar abundances is most probably an artifact of our attempt to fit relatively low spectral resolution data pertaining to a complex multiphase plasma with a simplistic spectral model, a problem which has in fact been well documented in the literature (e.g., Strickland et al. 2000; Wang et al. 2001). As noted by Kuntz et al. (2003), the abundances in the hot plasma in the central region of M101 are more likely to be near to solar rather than grossly sub-solar.
We know that the measured XMM-Newton spectrum includes some residual contamination by the wings of the bright sources (estimated to be 9% of the 0.3–1 keV count rate) and also includes a contribution from the underlying unresolved source population (estimated to contribute of the 0.5–2 keV flux). Since the sources may have somewhat harder spectra than the diffuse emission, presumably they contribute preferentially to the higher temperature spectral component. However, our derived temperatures of and keV are in very good agreement with the results of Kuntz et al. (2003) based on Chandra observations, suggesting that some fraction of the harder emission does have a diffuse origin. In the following analysis we assume 50% of the measured hard emission is attributable to diffuse emission. We also scale the component normalisations obtained from the spectral fitting so as to correct for both the area of the source mask and the differential nature of the spectral measurement (as detailed in §3.1).
One can infer mean physical properties of the hot diffuse gas once some assumptions have been made regarding the geometry of the diffuse emission. Here we assume that the gas is contained within a cylindrical region of radius of 10.5 kpc in the plane of the galaxy (matching a 5′ angular extent) with a half-width perpendicular to the plane of 0.5 kpc (representing the extent of a putative shallow halo). Using this volume, the derived emission measure (where is the ‘filling factor’ - the fraction of the total volume which is occupied by the emitting gas) can be used to infer the mean electron density . For the 0.2 keV plasma we find cm-3 compared to a value of cm-3 for the 0.7 keV plasma, implying that these two components are in rough pressure balance. The thermal energy residing in each of the plasma components is comparable and totals erg. The cooling is dominated by the line emission with radiative cooling timescales of yr and Gyr for the cooler and hotter components respectively.
3.3 Morphology of the residual emission
As previously noted, the spatial distribution of the residual soft X-ray emission in M101 shows a good correlation with the optical/UV emission of the galaxy, at least over the central 5′ region. We have investigated this correlation using the FUV (1530 Å) and NUV (2310 Å) images of M101 from the GALEX pipeline (Morrissey et al. 2005), together with images recorded by the XMM-Newton Optical Monitor (OM) in the UVW1 ( 2800 Å), U, B and V filters (Mason et al. 2001). The latter were derived from data taken during observation 1 (UVW1) and observation 3 (U,B,V) and subject to the standard SAS pipeline processing.
To aid the comparison, the soft X-ray image of Fig. 1(c) was compressed in both coordinates by a factor 4 (to give pixels) and then lightly smoothed. The UV and optical images were first rebinned into the same image format as the original soft X-ray data, blurred by a mask representative of the on-axis XMM-Newton soft X-ray PSF and then further compressed in an identical way to the soft X-ray data.
Fig. 4 shows a detailed comparison of the 0.3–1 keV surface brightness measured in the central 5′ radius region of M101 with the corresponding NUV, U and V band images. A striking similarity between the soft X-ray and U band images is immediately obvious. In particular, the “S-feature” which delineates the inner spiral structure of M101 is very prominent in both cases. The fall-off in the surface brightness towards the edges of the 5′ field is also very similar in both wavebands, with the north-south asymmetry evident at the level of the lowest soft X-ray contour level also present in the U band image. Interestingly, the correspondence becomes slightly less strong when the soft X-ray image is compared to both the NUV and V band images. The NUV image is clearly totally dominated by bright HII regions and young star associations which together delineate the spiral arms of the galaxy, whereas in the soft X-ray image the general rise in surface brightness towards the nucleus has more relative impact. It would seem highly unlikely that these morphological trends could be induced by the increase in extinction as we move from the U band into the NUV. In contrast, comparison with the V band data veers in the other direction with the soft X-ray image showing more structure outside the central 2′ zone than the optical image.
The above trends are further illustrated in Fig. 5 which shows the pixel-by-pixel correlation between the soft X-ray surface brightness and the optical/UV surface brightness in the various wavebands. (here we use unsmoothed data with a pixel size of , i.e. a factor of 8 compression of the original images). The correlation, as measured by the Pearson product moment correlation coefficient, R, is at a maximum in the U band.

4 Discussion
After excluding bright point sources (with ) we measure the residual soft X-ray luminosity of the inner (10.5 kpc radius) disk of M101 to be (0.5–2 keV). Up to 20% of this flux may originate in relatively bright point X-ray sources (with down to ), which remain unresolved in the XMM-Newton observations. A further 5% of the measured luminosity may be attributable to intermediate luminosity sources (with down to ) and, at very faint levels, the integrated emission of dwarf stars may account for another 10% contribution (Kuntz et al. 2003). Nevertheless, it seems that the bulk of observed X-ray emission is likely to be diffuse in origin.
The EPIC spectrum of the residual emission can be modelled as the sum of two thermal plasma components at temperatures of keV and keV with the harder component contributing of the flux in the 0.5–2 keV band ( in the 0.3–1 keV band). These spectral characteristics appear to be quite typical of the diffuse components seen in normal and starburst galaxies (e.g., Fraternali et al. 2002; Jenkins et al. 2004b; Jenkins et al. 2005a) and, albeit with some caveats, consistent with spectral measurements for M101 reported in the literature (Snowden & Pietsch 1995; Wang 1999; Kuntz et al. 2003).
Earlier studies have demonstrated that for normal spiral galaxies, the total soft X-ray luminosity correlates with the total infrared luminosity (Read & Ponman 2001; Strickland et al. 2004b), the latter serving as a direct indicator of the current star formation rate. For the diffuse X-ray components, this is in line with the mechanism whereby the mechanical energy input from supernovae and the winds from young massive stars serves to heat the galactic ISM to million-degree temperatures. In the case of M101 the required rate of energy input is readily supplied by two supernovae per century (Matonick & Fesen 1997), if the efficiency of the conversion of the mechnical energy of the supernova explosion into X-rays is , where is the energy of the supernova in .
The linkage of X-ray emission to recent star formation is further strengthened by the finding that in a number of galaxies the X-ray morphology in the spiral arms matches that seen in the mid-infrared or H (Tyler et al. 2004). A recent Chandra study has demonstrated that, in M101, the diffuse X-ray emission traces the spiral arms and is correlated with both the H and far-UV emission (Kuntz et al. 2003). In the same study there was no evidence for any significant trend of X-ray spectral hardness with radius333We have subsequently checked the XMM-Newton data for spectral trends by extracting images in the 0.3–0.8 keV and 0.8–1.2 keV sub-bands. The radial profiles of the residual X-ray emission in these sub-bands are consistent with the results obtained for the broader 0.3–1.0 keV band (see Fig. 2) and within the errors, exhibit a constant ratio for radii in the range 1’-10’. The XMM-Newton observations thus confirm that there is no significant radial dependence of spectral hardness in this Galaxy. implying that the 0.2- and 0.7-keV spectral components are closely linked with one another and are both associated with star formation.
In the present paper we have investigated this correlation in more detail by contrasting the X-ray morphology with that observed in far-UV through to V band. We find that the correlation with the X-ray morphology is quite strong for all bands considered (FUV, NUV, UVW1, U, B and V), although the best match is obtained with the U band data. One interpretation of this result is that, in broad terms, there are two underlying components present in the X-ray surface brightness distribution, namely a smooth rise towards the centre of the galaxy as reflected in the radial profile of the emission (Fig. 2) plus a superimposed X-ray spiral arm structure. In moving from the FUV through to the V band, clearly the balance shifts between the extreme population I components (distributed in the spiral arms) and a more intermediate population (associated with the galactic disk) and it is in the U band that this balance happens to best match the X-ray morphology.
In the disks of spiral galaxies star-formation is thought to be triggered by the passage of a spiral density wave through the ISM. The formation of massive young stars results in a large UV/far-UV flux with reprocessing in the immediate environment subsequently giving rise to associated H and mid-IR emission. All of these serve as tracers of the spiral arms of the galaxy. Population synthesis models predict that following a star-formation burst, the peak in the UV/H production will last yr, whilst the most massive stars complete their life cycle. The rate of energy deposition into the ISM from the subsequent supernovae rises at this time and remains fairly constant for yr (Leitherer & Heckman 1995; Cervino, Mas-Hesse & Kunth 2002). Given the lag between the peak in UV/H emission and the X-ray heating one might predict a spatial offset between the diffuse X-ray emission and the other spiral tracers, although as yet there is no clear observational evidence for such an effect (Tyler et al. 2004).
In the case of M101, we assume a flat rotation curve beyond a few kpc of the galaxy centre and a rotational velocity (Bosma, Goss & Allen 1981). We further assume that the spiral pattern corotates with the disk material at 3 radial scale lengths, i.e. at kpc. Then at kpc a delay of yr translates to a rotational lag of or about 3 kpc in a direction perpendicular to the spiral arm. The effective pixel size in our multi-waveband correlation is or 1.2 kpc, implying that a delay in the X-ray production following the passage of a spiral density wave might just be measurable in the current data. Unfortunately the restricted signal to noise and limited clarity of the spiral arm features in the X-ray image mitigates against the detection of such an effect. Earlier we estimated a radiative cooling timescale for the more prominent 0.2-keV plasma component to be yr for a filling factor . Clearly this timescale is inconsistent with the presence of reasonably narrow spiral features in the soft X-ray image. A very small filling factor, e.g. , is required to match the properties of X-ray spiral arms in M101, suggesting a very clumpy thin-disk distribution. In fact a reasonable scenario is that the spiral arms in X-rays are delineated by a combination of truly diffuse emission, possibly in the form of hot gas bubbles and superbubbles, plus contributions from individual SNRs and concentrations of unresolved discrete sources. As noted by Kuntz et al. (2003), the available constraints suggest that superbubbles in the disk of M101 may have similar properties to the Galactic Loop I superbubble (Egger & Aschenbach 1995), although they are not individually resolvable even in Chandra data. Where there is no confinement by chimneys or similar structures in the ISM, energy losses arising from adiabatic expansion of the hot gas in the disk into the lower halo of M101 may also help localise the spiral arm component (nb. in M101 the sound speed of the soft component is comparable to the escape velocity from the disk - Kuntz et al. 2003).
The second spatial component of the X-ray emission considered above broadly follows the distribution of the optical light attributable to the intermediate disk stellar population. The integrated X-ray emission of dwarf stars will presumably follow a disk distribution but this is unlikely to represent a substantial contribution (10% overall in the 0.5–2 keV band but, given the typical keV temperature of dwarf-star coronae, falling to in the softer 0.3–1 keV band; Kuntz et al. 2003). Other contributions to this smoother distribution might be expected from supernovae in the interarm regions associated with disk population stars and X-ray emitting gas which has accumulated in a shallow halo in M101 as a result of galactic chimney/fountain activity. In the case of the latter, gas which has cooled substantially due to adiabatic expansion may, as a result of a frozen-in non-ionization equilibrium, exhibit an emission spectrum dominated by oxygen lines, which mimics that expected from a keV plasma (Breitschwerdt & Schmutzler 1999). The fact that the X-ray surface brightness increases towards the centre of M101 is most naturally explained in terms of an increase in activity per unit disk area, with the filling factor of the extended z-height component possibly approaching unity near the centre of the galaxy. With the latter assumption, the implied electron density and pressure in the inner halo of M101 is comparable to that inferred for the centre of Galactic Loop I and the Local Hot Bubble.
5 Conclusions
This is the third and final paper in a series presenting the results of XMM-Newton observations of the nearby face-on Scd spiral galaxy M101. Here we focus on the spatial and spectral properties of the galaxy, when bright X-ray sources with are removed using an appropriate point source mask.
The residual soft X-ray luminosity of the central (10.5 kpc radius) region of M101 was measured as (0.5–2 keV), the bulk of which appears to originate as diffuse emission. We find a two-temperature model best fits the spectral data with the derived temperatures of 0.200.01 keV and 0.68 keV, typical of the diffuse components seen in other normal and starburst galaxies.
In line with earlier studies, we find that the observed X-ray surface brightness distribution is well correlated with images recorded in optical/UV wavebands. In particular the detection of spiral arms in X-rays establishes a close link between the X-ray emission and recent starformation. Closer investigation suggests that the X-ray morphology may comprise both a spiral arm component and a smoother disk component. In spiral galaxies, star formation is thought to be triggered by the passage of a spiral density wave through the ISM. In principle one might observe a lag between more immediate star-formation indicators such as the UV/far-UV flux or H and the heating of the interstellar medium to X-ray temperatures as result of subsequent supernova. The XMM-Newton data show no evidence for such an effect but it may be observable in future high resolution and high signal-to-noise data. Whereas the spiral arm component, on the basis of the radiative cooling timescale of the 0.2-keV plasma, may be deduced to have a clumpy, low-z distribution, the smoother disk component may represent longer-lived X-ray gas with a relatively large filling factor, which has been transported to the lower halo of M101 via the galactic chimney/fountain mechanism.
Future progress in understanding the X-ray properties of normal spiral galaxies will no doubt follow from very intensive studies of individual galaxies (e.g., the recent 1 Ms observation of M101 with Chandra - Kuntz et al. in preparation) and by applying appropriately optimised analysis procedures to samples of nearby galaxies, as is now possible using archival datasets.
Acknowledgments
LPJ, TPR and RAO acknowledge PPARC support at various junctures during this project. We should also like to thank the anonymous referee for some helpful comments and suggestions.
References
- Bianchi et al. (2005) Bianchi L., et al. , 2005, ApJ, 619, L71
- Bosma, Goss & Allen (1981) Bosma A., Goss W.M., Allen R.J., 1981, A&A, 93, 106
- Bregman (1980) Bregman J. N., 1980, ApJ, 236, 577
- Bregman & Glassgold (1982) Bregman J. N., Glassgold A. E., 1982, ApJ, 263, 564
- Breitschwerdt & Schmutzler (1999) Breitschwerdt D., Schmutzler T., 1999, A&A, 347, 650
- Cervino, Mas-Hesse & Kunth (2002) Cervino M., Mas-Hesse J.M., Kunth, D., 2002, A&A, 392, 19
- Cui et al. (1996) Cui W., Sanders W. T., McCammon D., Snowden S. L., Womble D. S., 1996, ApJ, 468, 102
- de Vaucouleurs et al. (1991) de Vaucouleurs G., de Vaucouleurs A., Corwin H. G., Buta R. J., Paturel G., Fouque P., 1991, Third Reference Catalogue of Bright Galaxies. Springer-Verlag, Berlin
- Dickey & Lockman (1990) Dickey J. M., Lockman F. J., 1990, ARA&A, 28, 215
- Egger & Aschenbach (1995) Egger R., Aschenbach, B., 1995, A&A, 1995, 294, L25
- Fraternali et al. (2002) Fraternali, F., Cappi M., Sancisi R., Osterloo, T., 2002, ApJ, 578, 109
- Heckman et al. (1990) Heckman T. M., Armus L., Miley G. K., 1990, ApJS, 74, 833
- Jenkins et al. (2004a) Jenkins L. P., Roberts T. P., Warwick R. S., Kilgard R. E., Ward M. J., 2004a, MNRAS, 349, 404
- Jenkins et al. (2004b) Jenkins L. P., Roberts T. P., Ward M. J., Zezas A., 2004b, MNRAS, 352, 1335
- Jenkins et al. (2005a) Jenkins L. P., Roberts T. P., Ward M. J., Zezas A., 2005a, MNRAS, 357, 109
- Jenkins et al. (2005b) Jenkins L. P., Roberts T. P., Warwick R. S., Kilgard R. E., Ward M. J., 2005b, MNRAS, 357, 401
- Kong et al. (2004) Kong A. K. H., Di Stefano R., Yuan F., 2004, ApJ, 617, L49
- Kuntz et al. (2003) Kuntz K. D., Snowden S. L., Pence W. D., Mukai K., 2003, ApJ, 588, 264
- Martin et al. (2003) Martin C. L., Kobulnicky H. A., Heckman T. M., 2002, ApJ, 574, 663
- Leitherer & Heckman (1995) Leitherer C., Heckman, T. M., 1995, ApJS, 96, 9
- Mason et al. (2001) Mason K. 0., et al. , 2001, A&A, 365, L36
- Matonick & Fesen (1997) Matonick D.M., Fesen R.A., 1997, ApJS, 112, 49
- McCammon & Sanders (1984) McCammon D., Sanders W. T., 1984, ApJ, 287, 167
- Morrissey et al. (2005) Morrissey P., et al. , 2005, ApJ, 619, L7
- Mukai et al. (2003) Mukai K., Pence W. D., Snowden S. L., Kuntz K. D., 2003, ApJ, 582, 184
- Mukai et al. (2005) Mukai K., Still M., Corbet R.H.D., Kuntz K.D., Barnard R., 2005, ApJ, 634, 1085
- Norman & Ikeuchi (1989) Norman C. A., Ikeuchi S., 1989, ApJ, 345, 372
- Okamura, Kanazawa & Kodaira (1976) Okamura S., Kanazawa T., Kodaira K., 1976, PASJ, 28, 329
- Pence et al. (2001) Pence W. D., Snowden S. L., Mukai K., Kuntz K. D., 2001, ApJ, 561, 189
- Pietsch et al. (2001) Pietsch W., Roberts T. P., Sako M., et al., 2001, A&A, 365, L174
- Popescu et al. (2005) Popescu C. C., et al. , 2005, ApJ, 619, L75
- Read et al. (1997) Read A. M., Ponman T. J., Strickland D. K., 1997, MNRAS, 286, 626
- Read & Ponman (2001) Read A. M., Ponman T. J., 2001, MNRAS, 328, 127
- Shapiro & Field (1976) Shapiro P. R., Field G. B., 1976, ApJ, 205, 762
- Snowden & Pietsch (1995) Snowden S. L., Pietsch W., 1995, ApJ, 452, 627
- Stetson et al. (1998) Stetson, P B. et al. , 1998, ApJ, 508, 491
- Stevens et al. (2003) Stevens I. R., Read A. M., Bravo-Guerrero J., 2003, MNRAS, 343, L47
- Strickland et al. (2000) Strickland D. K., Heckman T. M.,,Weaver K. A., Dahlem, M., 2000, AJ, 120, 2965
- Strickland et al. (2004a) Strickland D. K., Heckman T. M., Colbert E. J. M., Hoopes C. G., Weaver K. A., 2004a, ApJS, 151, 193
- Strickland et al. (2004b) Strickland D. K., Heckman T. M., Colbert E. J. M., Hoopes C. G., Weaver K. A., 2004b, ApJ, 606, 829
- Trinchieri et al. (1990) Trinchieri G., Fabbiano G., Romaine S., 1990, ApJ, 356, 110
- Tyler et al. (2004) Tyler K., Quillen A. C., LaPage A., Rieke G. H., 2004, ApJ, 610, 213
- Wang (1999) Wang Q. D., 1999, ApJ, 517, L27
- Wang et al. (1999) Wang Q. D., Immler S., Pietsch W., 1999, ApJ, 523, 121
- Wang et al. (2001) Wang Q. D., Immler S., Walterbos, R., Lauroesch, J.T., Breitschwerdt, D., 2001, ApJ, 555, L99
- Watson et al. (1984) Watson M. G., Stanger V., Griffiths R. E., 1984, ApJ, 286, 144
APPENDIX: The Point Source Catalogue
Within the D25 circle of M101, 108 sources were detected in observation 1, 91 in observation 2 and the same number in observation 3. Ninety sources were detected in at least two of the observations. For completeness, Table 2 lists the additional 21 sources detected in Observation 2 and another 9 sources detected in Observation 3. The format of the table is identical to that of Table 1 of Paper II and the numbering scheme is a continuation of the original list of 108 sources.
The most notable new source to appear in the second and third observations is source #122, which corresponds to the supersoft transient P98 (Mukai et al., 2003). The results from the XMM-Newton and Chandra observations of this object are reported in Kong et al. (2004) and Mukai et al. (2005).
| Src | XMMU | r1σ | pn count rate (count ks-1) | MOS count rate (count ks-1) | FX | LX | HR1 | HR2 | ||||
|---|---|---|---|---|---|---|---|---|---|---|---|---|
| (′′) | S | M | H | S | M | H | ||||||
| (1) | (2) | (3) | (4) | (5) | (6) | (7) | (8) | (9) | ||||
| 109 | J140213.8+542158 | 1.95 | 3.10.9 | 0.10.3 | 1.70.8 | 0.80.2 | 0.90.2 | 0.70.2 | 1.580.27 | 0.980.17 | -0.470.12 | 0.210.16 |
| 110 | J140237.7+542733 | 2.98 | - | - | - | 0.40.2 | 0.90.2 | 0.30.2 | 0.900.30 | 0.560.19 | 0.410.24 | -0.520.28 |
| 111 | J140238.0+541215 | 2.31 | - | - | - | 0.50.2 | 1.00.3 | 0.30.2 | 1.110.32 | 0.690.20 | 0.340.21 | -0.490.26 |
| 112 | J140246.7+541454 | 2.01 | 0.00.3 | 2.80.6 | 1.30.5 | 0.00.1 | 0.70.2 | 0.40.2 | 1.000.21 | 0.620.13 | 1.000.14 | -0.320.15 |
| 113 | J140251.4+540901 | 2.93 | - | - | - | 1.20.3 | 1.20.3 | 0.40.2 | 1.560.39 | 0.970.24 | 0.000.18 | -0.490.26 |
| 114 | J140257.9+542655 | 2.07 | 1.00.4 | 1.40.5 | 1.50.5 | 0.20.1 | 0.50.2 | 0.80.2 | 1.270.22 | 0.790.13 | 0.250.20 | 0.160.15 |
| 115 | J140302.0+541336 | 2.00 | 1.80.5 | 0.80.4 | 0.00.2 | 0.60.2 | 0.20.1 | 0.10.1 | 0.400.12 | 0.250.08 | -0.430.17 | -0.670.41 |
| 116 | J140304.0+541040 | 2.07 | 2.80.8 | 1.20.5 | 0.00.4 | 0.50.2 | 0.80.2 | 0.10.2 | 0.640.18 | 0.390.11 | -0.070.15 | -0.760.28 |
| 117 | J140306.9+541007 | 2.28 | - | - | - | 0.30.2 | 0.00.1 | 1.20.3 | 1.790.47 | 1.110.29 | -1.000.89 | 1.000.22 |
| 118 | J140308.3+543229 | 2.01 | - | - | - | 1.40.3 | 0.00.1 | 0.00.0 | 0.600.17 | 0.380.10 | -1.000.13 | 0.000.00 |
| 119 | J140320.0+542034 | 2.93 | - | - | - | 0.70.2 | 0.10.1 | 0.00.1 | 0.350.14 | 0.220.09 | -0.700.24 | -1.001.36 |
| 120 | J140324.0+542336 | 2.58 | 2.50.5 | 0.40.3 | 0.00.1 | - | - | - | 0.340.11 | 0.210.07 | -0.750.17 | -0.830.69 |
| 121 | J140327.5+541909 | 1.82 | 2.10.5 | 1.10.3 | 0.80.3 | 0.40.1 | 0.50.1 | 0.40.1 | 0.880.14 | 0.550.09 | -0.140.14 | -0.120.16 |
| 122 | J140332.4+542103 | 1.73 | 5.50.7 | 0.10.2 | 0.60.3 | 0.90.2 | 0.00.0 | 0.00.1 | 0.550.10 | 0.340.06 | -0.980.04 | 0.640.45 |
| 123 | J140334.3+540930 | 1.95 | 4.20.9 | 2.70.7 | 1.90.8 | 1.00.3 | 0.50.2 | 0.90.3 | 1.910.32 | 1.190.20 | -0.260.13 | 0.040.17 |
| 124 | J140354.1+541108 | 2.20 | - | - | - | 1.40.3 | 0.00.1 | 0.10.2 | 0.790.27 | 0.490.17 | -1.000.17 | 1.001.74 |
| 125 | J140355.8+542100 | 1.68 | 6.30.8 | 2.20.5 | 0.70.4 | 0.90.2 | 0.70.2 | 0.10.1 | 1.030.14 | 0.640.09 | -0.380.08 | -0.620.16 |
| 126 | J140357.2+541011 | 2.11 | 5.51.1 | 2.30.7 | 1.10.7 | 0.60.3 | 0.40.3 | 1.00.3 | 1.670.32 | 1.030.20 | -0.380.14 | 0.020.21 |
| 127 | J140401.2+542344 | 2.59 | 2.30.5 | 0.00.2 | 0.30.4 | - | - | - | 0.440.23 | 0.270.14 | -1.000.16 | 1.001.09 |
| 128 | J140429.8+542235 | 2.19 | - | - | - | 0.30.2 | 0.80.2 | 0.60.2 | 1.250.30 | 0.780.19 | 0.430.23 | -0.180.22 |
| 129 | J140435.4+542101 | 1.59 | 12.91.3 | 0.00.2 | 0.00.2 | - | - | - | 1.410.20 | 0.880.12 | -1.000.03 | -1.001.00 |
| 130 | J140229.9+542243 | 1.54 | 14.01.4 | 0.00.3 | 0.00.4 | - | - | - | 1.440.26 | 0.890.16 | -1.000.04 | 0.000.00 |
| 131 | J140230.0+541611 | 2.05 | 3.61.1 | 4.41.0 | 3.21.1 | 1.20.3 | 1.20.4 | 0.70.4 | 2.300.42 | 1.430.26 | 0.070.14 | -0.200.17 |
| 132 | J140243.6+542007 | 2.38 | 2.10.6 | 0.40.3 | 0.40.4 | - | - | - | 0.480.24 | 0.300.15 | -0.700.25 | 0.040.71 |
| 133 | J140250.7+542857 | 3.01 | 2.50.7 | 0.00.1 | 1.30.7 | - | - | - | 1.000.37 | 0.620.23 | -1.000.09 | 1.000.17 |
| 134 | J140300.6+540958 | 2.24 | 4.31.0 | 2.00.7 | 1.00.8 | - | - | - | 1.290.45 | 0.800.28 | -0.360.18 | -0.360.38 |
| 135 | J140312.2+541754 | 2.19 | 3.80.7 | 0.30.3 | 0.10.2 | - | - | - | 0.500.14 | 0.310.09 | -0.840.13 | -0.450.76 |
| 136 | J140314.4+542132 | 2.79 | - | - | - | 0.60.2 | 0.20.1 | 0.20.1 | 0.570.19 | 0.350.12 | -0.490.25 | -0.150.48 |
| 137 | J140355.8+540856 | 2.10 | 4.00.9 | 2.90.8 | 1.30.7 | - | - | - | 1.570.44 | 0.970.27 | -0.170.17 | -0.390.27 |
| 138 | J140415.6+540948 | 1.75 | 7.21.1 | 4.50.9 | 1.50.9 | 2.00.4 | 1.00.3 | 0.60.3 | 2.120.31 | 1.310.19 | -0.260.09 | -0.410.17 |
| (1) source number; (2) XMMU source designation (J2000 coordinates); (3) 1 error radius (including a 1.5 arcsecond systematic error); |
| (4 & 5) source count rates in soft (0.3–1 keV), medium (1–2 keV) & hard (2–6 keV) bands for the pn and MOS cameras, with the |
| significant source detections () highlighted in bold; (6) source flux in units of in the broad (0.3–6 keV) band; |
| (7) source luminosity in units of in the 0.3–6 keV band (assuming a distance to M101 of 7.2 Mpc); (8 & 9) soft (HR1) and |
| hard (HR2) hardness ratios. |