X-ray Spectral Variation of Car through the 2003 X-ray Minimum
Abstract
We report the results of an X-ray observing campaign on the massive, evolved star Car, concentrating on the 2003 X-ray minimum as seen by the XMM-Newton observatory. These are the first spatially-resolved X-ray monitoring observations of the stellar X-ray spectrum during the minimum. The hard X-ray emission, believed to be associated with the collision of Car’s wind with the wind from a massive companion star, varied strongly in flux on timescales of days, but not significantly on timescales of hours. The lowest X-ray flux in the keV band seen by XMM-Newton was only 0.7% of the maximum seen by RXTE just before the X-ray minimum. In the latter half of the minimum, the flux increased by a factor of 5 from the lowest observed value, indicating that the X-ray minimum has two states. The slope of the X-ray continuum above 5 keV did not vary in any observation, which suggests that the electron temperature of the hottest plasma associated with the stellar source did not vary significantly at any phase. Through the minimum, the absorption to the stellar source increased by a factor of to NH 3–41023 cm-2. The thermal Fe XXV emission line showed significant excesses on both the red and blue sides of the line outside the minimum and exhibited an extreme red excess during the minimum. The Fe fluorescence line at 6.4 keV increased in equivalent width from 100 eV outside the minimum to 200 eV during the minimum. The small equivalent widths of the Fe fluorescence line suggests small fluorescence yield in the companion’s low-density wind. The lack of variation in the plasma temperature is consistent with the eclipse of the X-ray plasma during the minimum, perhaps by a clumpy wind from the primary star, although the deformation of the Fe XXV profile and the relatively weak fluorescence Fe line intensity during the minimum may suggest an intrinsic fading of the X-ray emissivity. The drop in the colliding wind X-ray emission revealed the presence of an additional X-ray component which exhibited no variation on timescales of weeks to years. This new component has relatively cool temperature (kT 1 keV), moderate NH (51022 cm-2), large intrinsic luminosity (LX 1034 ergs s-1) and a size 1′′ (2300 AU at 2.3 kpc). This component may be produced by the collision of high speed outflows at 10002000 km s-1 from Car with ambient gas within a few thousand AU from the star.
1 Introduction
Car is a violently unstable, extremely luminous object and a key tracer of evolution of stars in the upper portion of the Hertzsprung-Russell diagram (Davidson & Humphreys, 1997). The star is believed to have had an initial mass of 150 M⊙ (Hillier et al., 2001). It is currently in a short, poorly understood evolutionary stage, known as the Luminous Blue Variable (LBV) phase, which is thought to occur near the onset of pulsational instabilities. It provides a convenient laboratory to study how extremely luminous, massive stars evolve and how they shape their environments both geometrically and chemically.
Car is best known for an extraordinarily powerful eruption in 1843 which sent 12 M⊙ (Smith et al., 2003b) of its atmosphere into space, creating a beautiful bipolar nebulosity called the Homunculus around the star. Car also had a minor eruption in 1890, which produced a small bipolar nebula inside the Homunculus nebula (the “Little Homunculus”, Ishibashi et al., 2003). The star still exhibits a strong mass loss (1010-3 M⊙ yr-1 Davidson et al., 1995; Cox et al., 1995; Ishibashi et al., 1999; Hillier et al., 2001; Pittard & Corcoran, 2002), preferentially in the polar direction (Smith et al., 2003a; van Boekel et al., 2003). The ejecta and the stellar wind are rich in helium and nitrogen and depleted in oxygen and carbon (Verner et al., 2005; Davidson et al., 1984; Hillier et al., 2001), consistent with CNO processing. Davidson et al. (2005) and Martin & Koppelman (2004) suggested from the change of H and H line profiles and the increase of optical brightness that Car is changing rapidly at the present time.
The past decade has witnessed an important change in our understanding of the star. This began with the recognition that the strength of some narrow emission lines, notably He I 10830Å, vary predictably with a period of 5.52 years (Damineli, 1996). Along with observations in infrared (Whitelock et al., 1994; Feast et al., 2001), (Cox et al., 1995), (Duncan et al., 1995), and optical (van Genderen et al., 1999) wavelengths, observations of the X-ray emission from the star have played a key role. ROSAT observations in 1992 first showed a variation which appeared to be correlated with Damineli’s emission line variations (Corcoran et al. 1995), and subsequently the keV lightcurve of the star obtained by RXTE (Ishibashi et al., 1999) showed in detail the X-ray variation culminating in a swift, unstable rise to maximum and steep fall to minimum lasting for 3 months, i.e. the same time interval as Damineli’s spectroscopic minimum. These observations clearly show that the star varies in a fundamental way every 5.54 years, and strongly suggest that Car is two stars, not one. In this binary model, most of the dramatic, pan-chromatic changes are now believed to be produced by the interaction of the UV flux and wind from a companion star with the wind of Car. Variations in the X-ray region are produced by a wind-wind collision (WWC) of the wind from Car with the wind of the companion star. A current guess at the system parameters describes a massive hot companion with 30 M⊙ plus a brighter primary star with 80 M⊙ in a highly eccentric (), year orbit (Corcoran et al. 2001a, see also Davidson 1999).
| Abbr. | Seq. ID | Observation Start | Exposure | Observation Mode | Filter | |
|---|---|---|---|---|---|---|
| Date | (ksec) | |||||
| Before the minimum | ||||||
| XMM000726aaData from XMM000726 and XMM000728 are combined and denoted as XMM0007. | 112580601 | 2000 Jul. 26, 06:01 (M2) | 0.470 | / /29.6 | PFW/PFW/PSW | thick |
| XMM000728aaData from XMM000726 and XMM000728 are combined and denoted as XMM0007. | 112580701 | 2000 Jul. 28, 00:51 (M2) | 0.471 | / /7.8 | PFW/PFW/PSW | thick |
| XMM030125bbData from XMM030125, XMM030127A, XMM030127B, XMM030129 and XMM030130 are combined and denoted as XMM0301. | 145740101 | 2003 Jan. 25, 13:03 (PN) | 0.922 | 4.8/ / | PSW/PFW/PFW | thick |
| XMM030127AbbData from XMM030125, XMM030127A, XMM030127B, XMM030129 and XMM030130 are combined and denoted as XMM0301. | 145740201 | 2003 Jan. 27, 01:08 (PN) | 0.922 | 4.8/ / | PSW/PFW/PFW | thick |
| XMM030127BbbData from XMM030125, XMM030127A, XMM030127B, XMM030129 and XMM030130 are combined and denoted as XMM0301. | 145740301 | 2003 Jan. 27, 20:42 (PN) | 0.923 | 4.7/ / | PSW/PFW/PFW | thick |
| XMM030129bbData from XMM030125, XMM030127A, XMM030127B, XMM030129 and XMM030130 are combined and denoted as XMM0301. | 145740401 | 2003 Jan. 29, 01:45 (PN) | 0.923 | 5.8/ / | PSW/PFW/PFW | thick |
| XMM030130bbData from XMM030125, XMM030127A, XMM030127B, XMM030129 and XMM030130 are combined and denoted as XMM0301. | 145740501 | 2003 Jan. 30, 00:00 (PN) | 0.924 | 4.8/ / | PSW/PFW/PFW | thick |
| XMM030608 | 160160101 | 2003 Jun. 08, 13:31 (M1) | 0.988 | 22.1/27.6/ | PSW/PSW/PFW | thick |
| XMM030613 | 160160901 | 2003 Jun. 13, 23:52 (M1) | 0.990 | 21.9/30.4/ | PSW/PSW/PFW | thick |
| During the minimum | ||||||
| CXO030720ccSpectra from CXO030720 and XMM030722 are simultaneously fit and those results are denoted as CXOXMM0307. | 200216 | 2003 Jul. 20, 01:47 | 1.008 | 90.3 | ACIS-S w/HETG | |
| XMM030722ccSpectra from CXO030720 and XMM030722 are simultaneously fit and those results are denoted as CXOXMM0307. | 145780101 | 2003 Jul. 22, 01:51 (M2) | 1.009 | 5.8/8.2/8.4 | PSW/PSW/PFW | thick |
| XMM030802 | 160560101 | 2003 Aug. 02, 21:01 (M2) | 1.015 | 12.2/17.1/17.5 | PSW/PSW/PFW | thick |
| XMM030809 | 160560201 | 2003 Aug. 09, 01:44 (M2) | 1.018 | 8.7/12.3/12.6 | PSW/PSW/PFW | thick |
| XMM030818 | 160560301 | 2003 Aug. 18, 15:23 (M2) | 1.023 | 13.0/18.2/18.6 | PSW/PSW/PFW | thick |
| CXO030828 | 200237 | 2003 Aug. 28, 17:38 | 1.028 | 18.8 | ACIS-S | |
| After the minimum | ||||||
| CXO030926 | 200217 | 2003 Sep. 26, 22:47 | 1.042 | 70.1 | ACIS-S w/HETG | |
Note. — Abbr.: abbreviation adopted for each observation. Seq. ID: sequence identification number of each observation. Observation Start Date: start time of the detector in the parentheses. = (JD[observation start] 2450799.792)/2024 (Corcoran, 2005). Exposure: exposure time excluding the detector deadtime; for XMM-Newton observations the exposure times are given for the PN, MOS1 and MOS2 detectors, respectively; The data sets without exposure time were not used due to the severe event pile-up. Observation Mode: PSW: prime small window, PFW: prime full window. For the XMM-Newton observations the observations modes are given for the PN, MOS1 and MOS2 detectors, respectively. Filter: optical blocking filter selected for the XMM-Newton detectors.
During the 1997/98 X-ray minimum, Car was the target of every available X-ray observatory, including RXTE (Ishibashi et al., 1999; Corcoran et al., 2001a), ASCA (Corcoran et al., 2000), and BeppoSAX (Viotti et al., 2002). The ASCA satellite detected hard X-ray emission from Car (Corcoran et al., 2000), which was characterized by slightly smaller NH than the pre-minimum state with reduced plasma emission measure (E.M.). The limited spatial resolution of ASCA, however, left the possibility that the observed emission was due to contamination by unresolved nearby sources. The BeppoSAX satellite observed Car just after the recovery of the X-ray emission (Viotti et al., 2002). The spectrum showed strong absorption of NH1.51023 cm-2 unlike the ASCA spectrum during the minimum, which had an NH 31022 cm-2. The overall X-ray brightness variations observed with RXTE are explained well with the colliding wind mechanism (Pittard et al., 1998; Pittard & Corcoran, 2002). However, key properties of the X-ray lightcurve were still poorly understood: dramatic changes in X-ray flux as the emission increases to maximum, the variation of the absorbing material in front of the X-ray emitting region near the X-ray minimum, the nature of the rapid fall from X-ray maximum to X-ray minimum, the excess in NH after recovery.
The minimum which occurred in mid-2003 was among the best observed astronomical events of all time. A key part of this campaign were the detailed X-ray observations obtained with RXTE, Chandra, and XMM-Newton. RXTE again provided crucial monitoring of the daily changes in X-ray flux, while Chandra provided previously-unobtainable monitoring of the X-ray emission line dynamics at key phases of the binary period. XMM-Newton obtained critical measurements of the spectrum of the source during the low-flux state when observations with RXTE or Chandra are difficult.
This paper describes the overall change of the X-ray spectrum of Car around the 2003 minimum as measured by XMM-Newton (Jansen et al., 2001), supplemented where necessary with key observations with Chandra (Weisskopf et al., 2002). We try to understand the X-ray emission and absorption mechanism and the cause of the X-ray minimum, from a comparison of derived spectral properties such as kT, NH and emission line strengths in these observations and earlier ROSAT and ASCA observations during the 1992 and 1997/98 minima.
The paper is comprised of the following sections. Section 2 describes the observations and method of the data reduction, and includes a description of problems of unresolved emission components around the central source in the extracted XMM-Newton source events. Section 3 describes imaging and timing analyses of the XMM-Newton data. Section 4 describes the analysis of the X-ray spectra during the 2003 minimum. Section 5 compares the X-ray spectra during the 2003 minimum to the previous minima in 1998 and 1992. We discuss our results in section 6, and in section 7 we summarize our conclusions.
2 Observations & Data Reduction
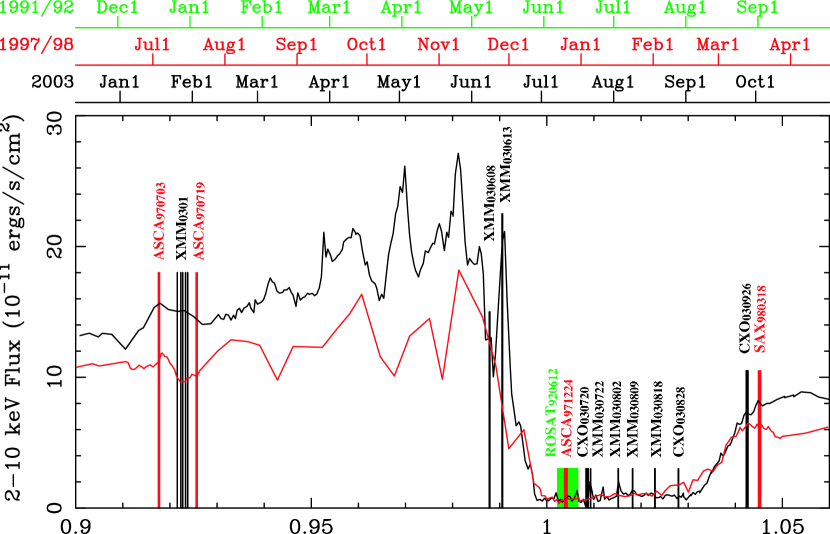
In 2003, XMM-Newton observed Car a total of 11 times, 5 times in January 2003 (about 6 months before the onset of the 2003 minimum), twice in June 2003 (weeks before the onset of the 2003 minimum, near the X-ray maximum) and four times during the 2003 minimum in July and August 2003 prior to the recovery, which started near 2003 September 3. Figure 1 displays these observing times on the RXTE lightcurve (Corcoran, 2005) for context. We also re-analyzed two XMM-Newton observations from 2000, whose results were previously published by Leutenegger et al. (2003). We thus used a total of 13 XMM-Newton observations in our analysis, as listed in Table 1. Throughout this paper, individual XMM-Newton observations are designated XMM, subscripted with the year, month and day of the observation. To improve statistics, we combined data from two observations in 2000 and combined data from five observations in 2003 January because these observations were close together in time, and did not show any significant variabilty among them.
XMM-Newton is composed of three nested Wolter I-type X-ray telescopes (Aschenbach et al., 2000) with the European Photon Imaging Camera (EPIC) CCD detectors (PN, MOS1 and MOS2) in their focal planes (Strüder et al., 2001; Turner et al., 2001). In all the observations, Car was on-axis but the observations were obtained with different satellite roll angles. The EPIC instrumental modes are listed in Table 1. The XMM-Newton spectra suffered significant photon pileup in the data taken in prime full window (PFW) mode outside the 2003 minimum when the star was bright in the keV band. We did not use these data sets in our analysis. XMM-Newton is also equipped with the Reflection Grating Spectrometer (RGS; den Herder et al., 2001), but the RGS has limited sensitivity above 1 keV, where emission from the WWC region dominates. We therefore did not use the RGS data.
The analysis of the XMM-Newton data was performed with version 5.4.1 of the SAS111http://xmm.vilspa.esa.es/external/xmm_sw_cal/sas_frame.shtml software package and version 5.2 of the HEASoft222http://heasarc.gsfc.nasa.gov/docs/software/lheasoft/ analysis package. The Observation Data Files (ODF) data were processed using the SAS scripts “emchain” and “epchain.” We removed events close to hot pixels or outside the field of view, and selected events with pattern 4 for EPIC PN spectral analysis and pattern 12 for timing analysis of the EPIC PN data and spectral and timing analysis of the EPIC MOS data. Most of these observations luckily avoided high background periods and the instrumental background is negligible in any observations within the 0.310 keV band. We did not need to reject any high background periods because the strong emission from Car greatly surpassed the observed background levels.
Due to the limited spatial resolution of XMM-Newton, the extracted Car data inevitably include emission from a number of sources (see Figure 2). The extracted spectrum is usually dominated by hard X-rays from the wind-wind collision in Car, which varies from observation to observation (Corcoran et al., 2000; Viotti et al., 2002). The Homunculus Nebula emits weak diffuse reflected X-rays from the central source, which can be spatially resolved only with Chandra and only during the minimum (Corcoran et al., 2004). The outer ejecta extending about beyond the Homunculus Nebula emits diffuse non-variable X-rays below 1 keV with a ring- or shell-like morphology (Seward et al., 2001; Weis et al., 2004). To correct the XMM-Newton spectra for emission from the outer ejecta and the Homunculus Nebula, we used three Chandra data sets from the 2003 X-ray observing campaign, two observations during the 2003 minimum and an observation just after the 2003 minimum. These Chandra observations spatially resolve the outer ejecta emission from the emission of the stellar source and so allow us to determine the spectrum of the outer emission, which we can then use to help model the XMM-Newton spectra.
The log of Chandra observations and the timing of the observations are also given in Table 1 and Figure 1. Chandra observations are designated CXO, subscripted with the year, month and day of the observation, similar to our designation of the XMM-Newton observations. The Chandra observations were obtained using the Advanced CCD Imaging Spectrometer detector using the Spectrometer array (ACIS-S) either with or without the high energy transmission grating (HETG). For the grating data, 0th-order photon events were used for CXO030720 (during the X-ray minimum, when the source was too faint at 1st order), and 1st-order photon events were used for CXO030926 after the recovery since the central source had severe pile-up in the 0th-order data. The observation CXO030828, taken during the minimum with the ACIS-S imaging array with no grating, also suffered mild pile-up (). The analysis of the Chandra data was performed with the CIAO333http://cxc.harvard.edu/ciao/ software package, version 2.3 (CALDB version 2.22), version 3.0 (CALDB version 2.23) and version 3.0.2 (CALDB version 2.26) for sequences 200216, 200237, and 200217 respectively. We also used version 5.2 of the HEAsoft package, and followed the recommendations of the analysis science thread444http://cxc.harvard.edu/ciao/threads. A full analysis of the Chandra spectra will be published separately (Corcoran et al. 2007, in preparation).
3 X-ray Images and Time Variability

| Observation | Net Count Rate | Constant Model Fit | |||||||||||
|---|---|---|---|---|---|---|---|---|---|---|---|---|---|
| Soft[0.31 keV] | Med[14 keV] | Hard[410 keV] | /d.o.f. | ||||||||||
| PN | MOS1 | MOS2 | PN | MOS1 | MOS2 | PN | MOS1 | MOS2 | Soft | Med | Hard | d.o.f | |
| (counts s-1) | (counts s-1) | (counts s-1) | |||||||||||
| XMM0007 | 0.255aaSource regions are slightly smaller for these Prime Small Window observations. | 1.25aaSource regions are slightly smaller for these Prime Small Window observations. | 0.91aaSource regions are slightly smaller for these Prime Small Window observations. | 0.97 | 1.12 | 0.82 | 76 | ||||||
| XMM0301 | 1.15 | 7.72 | 7.18 | 0.98 | 1.14 | 1.05 | 75 | ||||||
| XMM030608 | 1.10 | 0.247aaSource regions are slightly smaller for these Prime Small Window observations. | 4.58 | 1.70aaSource regions are slightly smaller for these Prime Small Window observations. | 6.77 | 1.89aaSource regions are slightly smaller for these Prime Small Window observations. | 0.99 | 1.45 | 0.95 | 55 | |||
| XMM030613 | 1.09 | 0.242aaSource regions are slightly smaller for these Prime Small Window observations. | 4.99 | 1.84aaSource regions are slightly smaller for these Prime Small Window observations. | 10.49 | 2.80aaSource regions are slightly smaller for these Prime Small Window observations. | 1.02 | 1.84 | 1.29 | 62 | |||
| XMM030722 | 1.03 | 0.223aaSource regions are slightly smaller for these Prime Small Window observations. | 0.285 | 0.456 | 0.170aaSource regions are slightly smaller for these Prime Small Window observations. | 0.188 | 0.183 | 0.045aaSource regions are slightly smaller for these Prime Small Window observations. | 0.049 | 0.81 | 0.85 | 1.31 | 16 |
| XMM030802 | 1.07 | 0.222aaSource regions are slightly smaller for these Prime Small Window observations. | 0.288 | 0.464 | 0.161aaSource regions are slightly smaller for these Prime Small Window observations. | 0.190 | 0.517 | 0.137aaSource regions are slightly smaller for these Prime Small Window observations. | 0.124 | 0.97 | 1.21 | 0.75 | 34 |
| XMM030809 | 1.06 | 0.226aaSource regions are slightly smaller for these Prime Small Window observations. | 0.280 | 0.476 | 0.178aaSource regions are slightly smaller for these Prime Small Window observations. | 0.188 | 0.554 | 0.159aaSource regions are slightly smaller for these Prime Small Window observations. | 0.151 | 1.13 | 0.79 | 1.09 | 24 |
| XMM030818 | 1.05 | 0.221aaSource regions are slightly smaller for these Prime Small Window observations. | 0.288 | 0.514 | 0.169aaSource regions are slightly smaller for these Prime Small Window observations. | 0.202 | 0.648 | 0.179aaSource regions are slightly smaller for these Prime Small Window observations. | 0.174 | 1.34 | 0.96 | 0.92 | 37 |
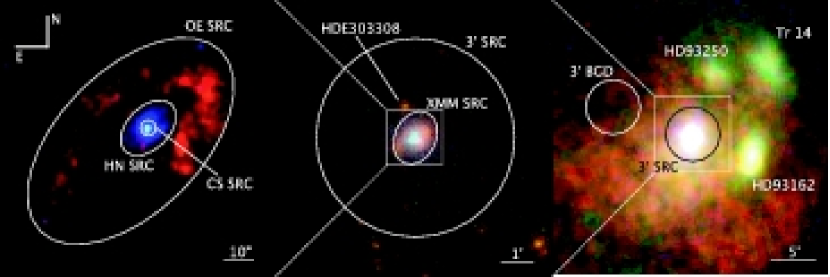
All XMM-Newton images similarly showed emission from the central source and the outer ejecta (Figure 2). Because these XMM-Newton images cannot completely separate emission from the outer ejecta and central source nor resolve the faint X-ray Homunculus Nebula (Corcoran et al., 2004), we used an ellipse of 50′′ 37.′′5 as the source region (called “XMM SRC” in Figure 2), which includes all these emission components but excludes nearby X-ray luminous stars (such as HDE 303308) more than distant. For some small window mode MOS observations, the south-east tip of the ellipse fell outside the small window. We determined background using regions from apparently source-free regions on the same CCD chip.
Table 2 shows detected photon count rates in the soft (0.3–1 keV), medium (1–4 keV), and hard (4–10 keV) bands in each detector for each observation. The soft band mainly includes emission from the outer ejecta, while the medium band includes emission from an additional source which we call the central constant emission component (CCE, see §4.1.2), and the medium band outside the minimum and the hard band includes the WWC emission (see §4.2). In the soft band, the MOS2 count rates are 10% lower in XMM0007 than during the 2003 minimum because of the use of a smaller MOS2 source region for the XMM0007 data. The soft-band PN count rates are slightly higher outside minimum because the spectral response of the PN allows photons from the bright hard source to contaminate the soft band. For example, we estimate the soft band contamination due to the hard photons in XMM0007 to be 0.08 counts s-1, which makes the corrected PN count rates in the soft band 1.06 counts s-1 in this observation. This means that the emission from the outer ejecta was constant to 2% to better than 90% confidence over a half-year interval. On the other hand, both the medium and hard band count rates decreased dramatically to 1–5% of the maximum brightness seen by XMM-Newton.
We constructed light curves with 500 s time bins, combining all the available MOS and PN data. In Figure 3, we show three sample light curves, representing variations before the minimum (XMM030613) and during the minimum (XMM030722, XMM030818). In general, these light curves showed no significant variation in most energy bands at 90% confidence (Table 2, Figure 3). The exceptions are the medium band light curves before the 2003 minimum. The medium band light curve from the XMM030608 observation showed an “excess” of 0.2 counts s-1 (4 %) near the middle of the observation, while the medium band light curve from the XMM030613 observation showed a slight linear increase by counts s-1 day-1 (1-) or 10% day-1. The linear model is still not accepted above the 90% confidence level (/d.o.f. = 1.59), due to small fluctuation on timescales of 500 s. We note that the hard band light curve in XMM030613 is also better reproduced by a linearly-increasing model with a slope of counts s-1 day-1, or 7.5% day-1, with /d.o.f. = 0.98. This increase is roughly consistent with the RXTE light curve (15% day-1, see Figure 1).
4 X-ray Spectra
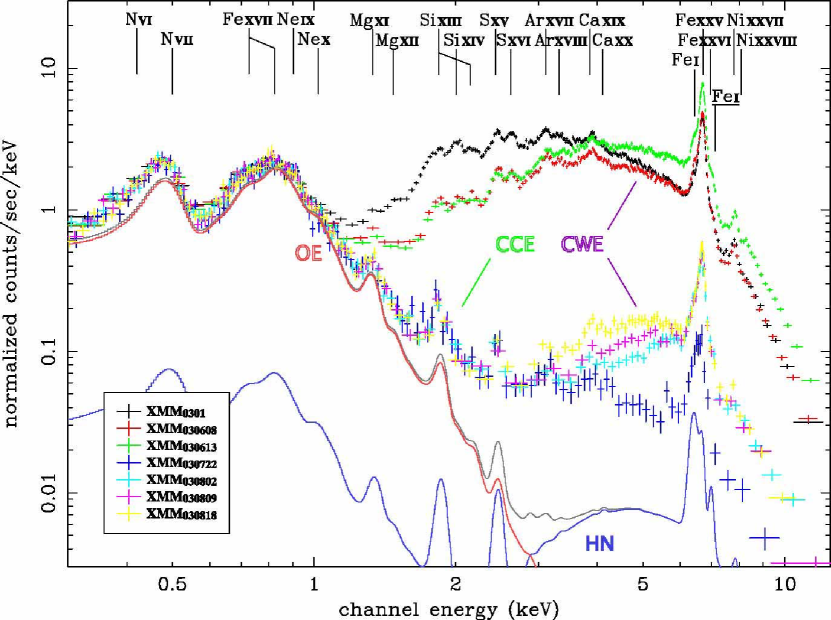
For each XMM-Newton observation, we produced EPIC PN and MOS spectra using the same source and background regions as in §3. Figure 4 presents the EPIC PN spectra for all 2003 observations. The X-ray spectra are a combination of a variable hard WWC component, along with non-variable emission from a number of components. Consistent with Table 2, the spectra below 1 keV are almost constant through the observations. Above 1 keV the spectra varied by a factor of 23 before the 2003 minimum, then decreased dramatically by more than an order of magnitude after the onset of the 2003 minimum in June, with small recovery by a factor of 3 at 4 keV during August. Most spectra clearly showed lines of hydrogen- and helium- like ions of Mg, Si, S, Ar, Ca, Fe, and Ni, and a fluorescence line from cold Fe.
In the following we examine first the non-variable emission, then use this emission to fully understand changes in the variable component. In our analysis, we adopt abundances relative to solar abundances given by Anders & Grevesse (1989)
4.1 Non-Variable Components
4.1.1 Contribution of the Outer Ejecta and Homunculus Nebula to the X-ray Spectra
We use Chandra observations to estimate the amount of contamination from the outer ejecta and the Homunculus Nebula in the XMM-Newton spectra.
We extracted the spectrum of the outer ejecta from the Chandra CXO030720 HETG 0th-order data, which has the smallest contamination from the central hard source. We extracted the source spectrum from an 83′′ 47′′ ellipse centered on the star (“OE SRC” in Figure 2), with its major axis parallel to the long axis of the extended outer X-ray nebula, but excluded a 20′′ 15′′ ellipse (“HN SRC” in Figure 2) centered on the central source and the Homunculus Nebula. We extracted background spectra from a nearby apparently source-free region. Car is embedded in soft diffuse emission from the Carina nebula, but its contribution to the Car spectrum is negligible.
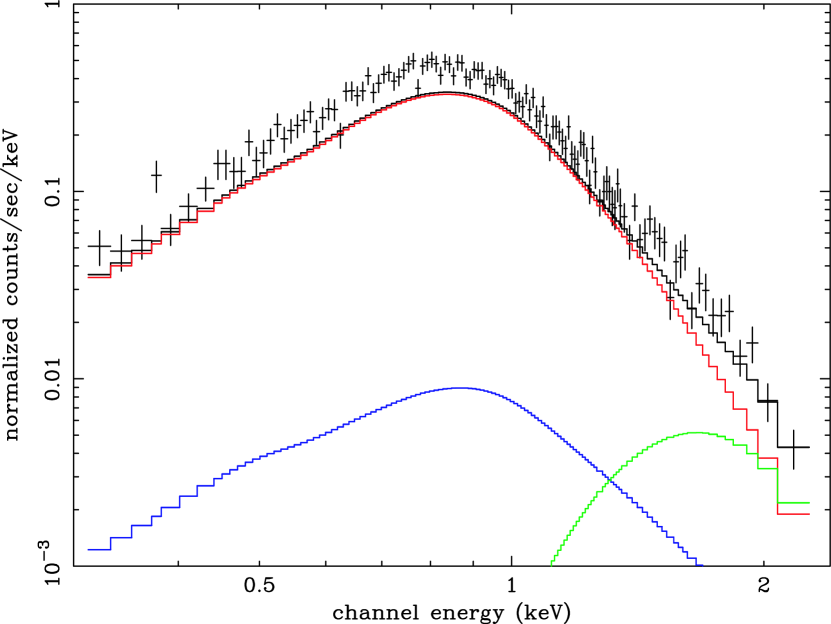
The spectrum from the “OE SRC” region, excluding the spectrum from the “HN SRC” region, is shown in Figure 5. This spectrum shows a strong emission line from nitrogen, which re-confirms the N enhancement in the outer ejecta found by a number of previous analyses, (optical/UV: Davidson et al. 1982, X-rays: Tsuboi et al. 1997 [N/O 5], Leutenegger et al. 2003 [N/O 9]). This spectrum also shows a significant excess at 1.3 keV, the energy of the helium-like Mg line, which seems to require a Mg overabundance of 3 solar at kT 0.6 keV (though plasma with that temperature should emit a stronger hydrogen-like Mg line). Leutenegger et al. (2003) also found a similarly strong Mg line in the XMM-Newton grating spectrum, though they conjectured that some of the Mg emission might be contamination from the stellar X-ray source. Our results suggest that the Mg line does in fact originate in the outer nebulosity. We modeled the extracted, background-corrected source spectrum below 3 keV (where the emission from the extended source dominates) using a simple absorbed optically thin, thermal plasma model (WABS, Morrison & McCammon 1983; MEKAL, Mewe et al. 1995), including the ACISABS555http://cxc.harvard.edu/cont-soft/software/ACISABS.1.1.html component to compensate for the progressive low energy degradation of the quantum efficiency of the Chandra ACIS detector. We allowed the abundances to vary, but constrained all abundances to have the same value except for nitrogen, which was allowed to vary independently. We added a Gaussian with a fixed line centroid at 1.31 keV with no intrinsic broadening, to account for the helium-like Mg line emission. The model successfully reproduces the spectrum of the outer ejecta, yielding a reduced of 1.09 for 81 dof, with the best-fit parameters of kT 0.58 keV, NH 7.21020 cm-2, with a VMEKAL normalization of 7.210-4, elemental abundance of 85 solar for nitrogen, near solar abundance for the others, and an excess flux of 1.5 10-5 counts cm-2 s-1 for Mg. The plasma temperature, keV – mainly constrained by continuum above 1 keV – agrees well with the highest plasma temperature derived from the emission lines in the XMM-Newton grating spectrum (Leutenegger et al., 2003). However, the NH is smaller than interstellar absorption to Car (3 1021 cm-2, see §2.2 of Leutenegger et al. 2003), the nitrogen abundance is overestimated from earlier measurements, and the best-fit model does not reproduce the Fe L and Ne lines near 1 keV that are observed with the high resolution grating spectrum. This is perhaps caused by assuming a simplistic 1T model for a spectrum which may have multiple cooler plasma components. Therefore, this model reproduces CCD-resolution spectra (100 eV at 1 keV) at energies above 0.4 keV but not higher-resolution grating spectra.

The reflected X-ray emission from the Homunculus Nebula did not vary significantly between CXO030720 and CXO030828, an interval of 40 days (Corcoran et al., 2004). Since this emission represents the accumulated X-rays reflected from the entire Homunculus Nebula, any time variation of the central source shorter than the average light-travel time from the star to the reflecting site inside the Homunculus Nebula (88 days) will be smeared out. We assume that the emission from the Homunculus Nebula did not vary between CXO030720 and CXO030828, which includes all XMM-Newton observations during the 2003 minimum (XMM030722 – XMM030818). To show the relative magnitude of the contamination from this reflected component, in Figure 4 we include a model fit of the Chandra spectrum of the reflected X-rays from the Homunculus Nebula, which we extracted from a 20′′ 15′′ ellipse centered on the star (HN SRC in Figure 2), excluding a 2.′′5 radius circle (CS SRC).
Though the X-ray intensity of the Homunculus in observations outside the 2003 minimum is less certain, at these times the X-ray emission from the central source was so bright that the X-ray contamination from the Homunculus is 1% even if the reflected emission from the Homunculus brightened by a factor of 3.
4.1.2 Discovery of a “Constant” Component Near the Central Source
| Parameters | 1T fit | |
|---|---|---|
| kT | (keV) | 1.05 (0.96–1.13) |
| Z(Si) | (solar) | 0.22 (0.14–0.29) |
| Z(S) | (solar) | 0.47 (0.39–0.55) |
| E.M. | (1056cm-3) | 7.0 (6.0–8.2) |
| NH | (1022cm-2) | 4.96 (4.77-5.16) |
| LXaaAbsorption corrected X-ray luminosity between 0.5–10 keV, assuming the distance of 2.3 kpc. | (1034ergs s-1) | 1.3 |
| /d.o.f | 1.51 | |
| d.o.f | 1205 |
Note. — Elemental abundances of the hard component were found to be non-solar, but do not vary with observation.
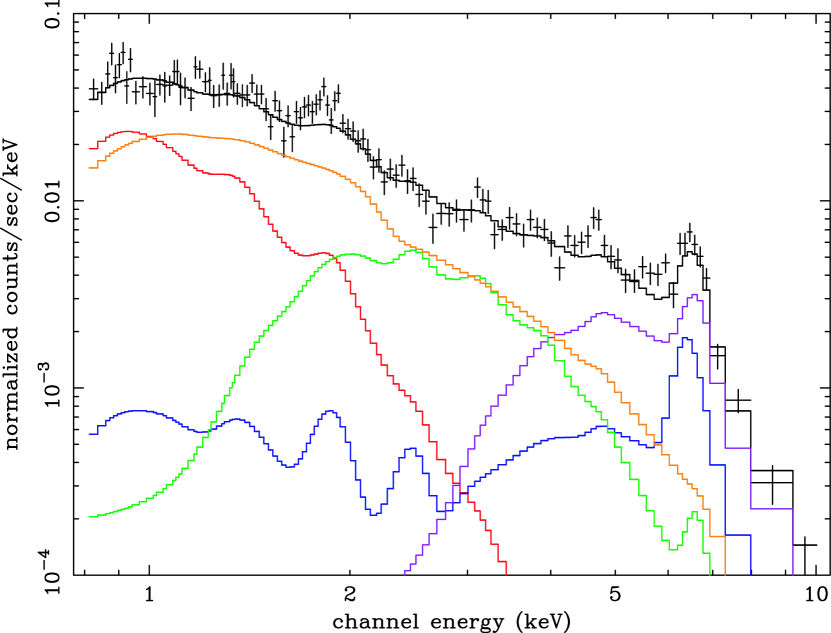
Figure 4 depicts the XMM-Newton EPIC PN spectra recorded through 2003, along with the best-fit spectral models of the outer ejecta, the X-ray Homunculus Nebula, and their sum. Except for the excess below 1 keV, which is produced by the poor absolute flux calibration of the EPIC PN666see the XMM-Newton calibration report CAL-TN-0018-2-3, the excess over the summed spectrum represents emission in a region (CS SRC in Figure 2) within .′′5 of the hard X-ray peak. Apparent in Figure 4 is an excess over the model in the energy range keV. This emission apparently did not vary in time with the harder emission, and had the same flux in the Chandra spectra of the central region in observations CXO030720, CXO030828, and CXO030926 (see also Figure 6), so that the emission was securely constant for more than two months between July 20 – September 26 2003. We call this component the Central Constant Emission component, or “CCE”.
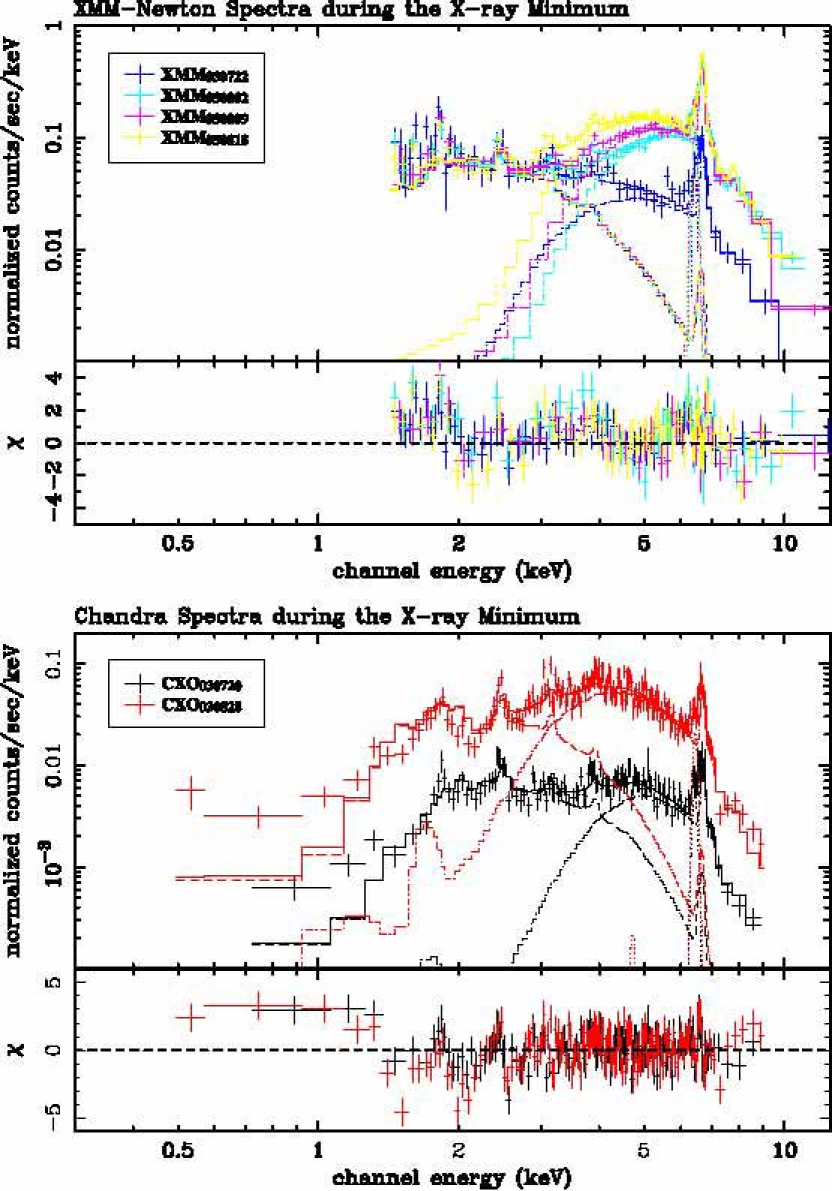
The CCE shows lines of helium-like S and Si ions but no lines of hydrogen-like S and Si ions. This indicates that the CCE comes from relatively cool plasma. To estimate the emission parameters of the CCE, we subtracted contributions of the outer ejecta and Homunculus Nebula from both the PN and MOS spectra (see the top panel of Figure 6 which shows the PN spectra). We ignored data bins below 1.4 keV, where the MOS and PN spectra have significant discrepancies due to problems with the relative flux calibrations between the two instruments. To better estimate the spectrum at low energies, we also fit the Chandra spectra of the central region from CXO030720 and CXO030828 (see the bottom panel of Figure 6). Because of the finer spatial resolution of Chandra, these spectra are mostly free from contamination by emission from the outer ejecta. Each XMM-Newton and Chandra spectrum was fit by a combination of a low and high temperature, optically thin thermal plasma model with independent absorbing columns for each component, including a Gaussian line to account for the fluorescence iron line at 6.4 keV. The low temperature component accounts for the emission from the CCE.
The parameters of the low temperature component were tied among all the spectra, and we assumed fixed solar abundances for all elements except for silicon and sulfur, whose abundances were allowed to vary simultaneously for all the spectra. We allowed the parameters of the hard component (which represents the variable emission of the stellar source) to vary among all the spectra, but we kept the abundances at the same (non-solar) values in each spectrum. Table 3 shows the best-fit parameters for the constant component. The spectrum can be fit with kT 1.1 keV, NH 5.01022 cm-2, with an absorption corrected luminosity of log LX 34 ergs s-1, and low abundances for Si (0.21 solar) and S (0.47 solar).
The model, however, was not accepted at above 90% confidence for the following reasons: i) The Chandra spectra show significant excess below 1 keV, perhaps originating in foreground emission from the outer ejecta “bridge” (Weis et al., 2004, see also Figure 2). The excess can be reproduced by including some flux from the outer ejecta using the model derived in §4.1.1. This slightly improves the reduced from 1.51 for 1205 to 1.50 for 1203 degrees of freedom. The included flux is 0.4% of the whole outer ejecta emission. ii) The model overestimates the spectra near 2 and 2.7 keV, where lines of hydrogen-like Si and S ions are, and the model underestimates the spectra near 1.8 and 2.5 keV, where lines of helium-like Si and S ions are. This suggests that the constant component includes plasma with temperature cooler than kT 1 keV, though an inconsistency near 2 keV between XMM-Newton and Chandra spectra could also be caused by calibration uncertainties of the Chandra effective area around the iridium M-edge. Since cooler plasmas have lower emissivities in those lines, our simple 1T model fitting for the CCE component can underestimate the elemental Si and S abundances. iii) The model underestimates the XMM-Newton spectra near 34 keV, possibly because the variable component is a multiple temperature plasma (see §4.2.2). iv) The Fe K line profile is complex and cannot be fit by a simple 1-temperature equilibrium model (see §4.2.3). Nevertheless, the parameters given in Table 3 should approximate the physical properties of the CCE, except perhaps for the elemental abundances, which are more dependent on details of the model.
As seen in Figure 6, the emission between 13 keV in CXO030720 comes predominantly from the CCE component. The 13 keV image in CXO030720 was apparently point-like, which restricts the projected plasma size to within 1′′ of Car, the width of the Chandra point-spread function. This is equivalent to a projected distance 2300 AU at 2.3 kpc, suggesting that the hot gas which produces the CCE component is inside the Little Homunculus Nebula (which has a projected extent of , Ishibashi et al., 2003).
4.2 The Variable Component
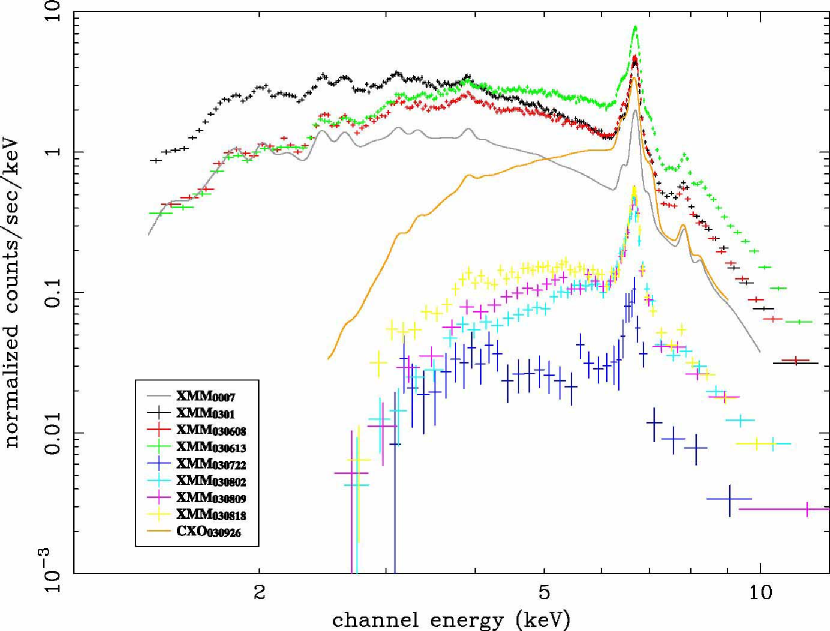
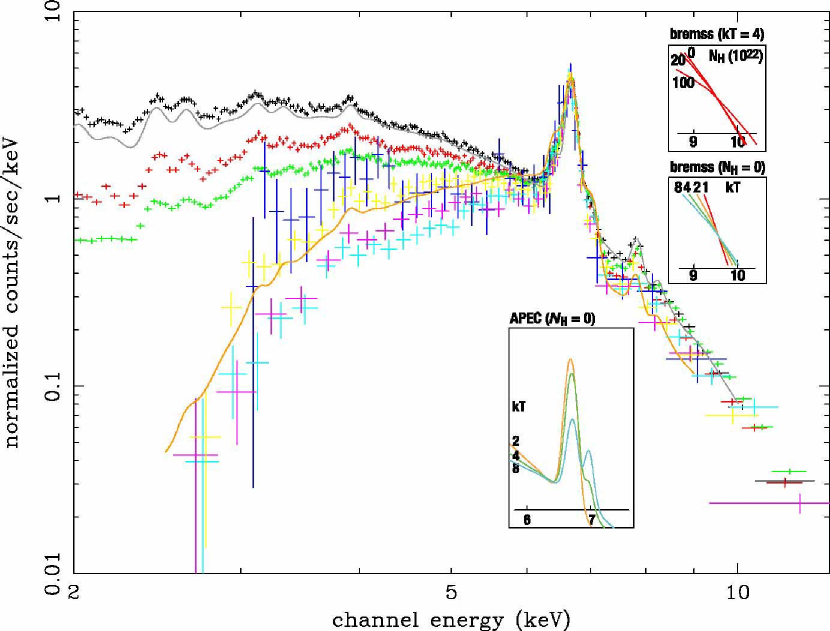
In order to determine the spectrum of the variable stellar component, we then subtracted from all the original spectra the recognized non-variable emission components – the outer ejecta, the X-ray Homunculus Nebula, and the CCE component. The remaining emission represents the variable component associated with the stellar source, and is shown in Figure 7. The top panel shows the variable component “corrected” for the constant components we identified. For comparison, we overlaid on the top panel of Figure 7 the best-fit models for the XMM0007 and CXO030926 datasets.
4.2.1 Variation of the Overall Spectral Shape
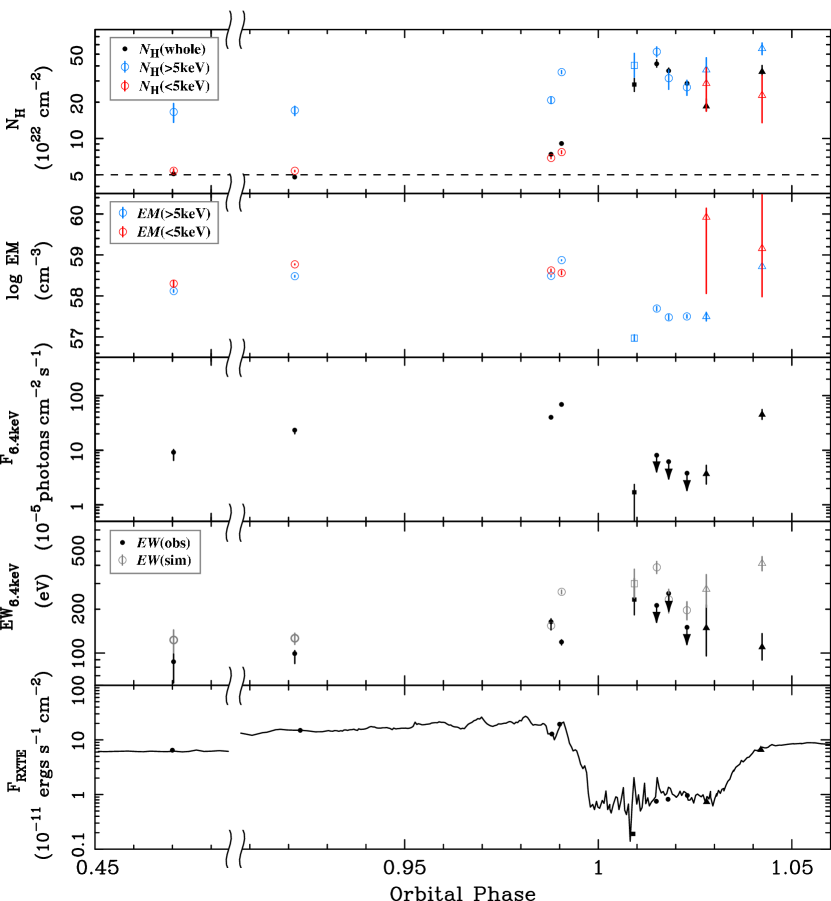
The bottom panel of Figure 7 shows the “corrected” variable components normalized at the Fe XXV line energy to highlight changes in the shape of the spectra. From XMM0007 to XMM0301 (an interval of 2.5 years) the X-ray flux increased by a factor of 2–3 without remarkable changes in spectral shape. Four months later (observation XMM030608), the X-ray emission decreased only below 5 keV. Five days later (observation XMM030613), when Car was close to the peak of the last flare before the 2003 minimum (Corcoran, 2005), the hard X-rays above 3 keV increased by a factor of two. The X-ray emission dropped by almost two orders of magnitude by XMM030722, the first observation after the 2003 minimum. In XMM030802, the hard band flux recovered by a factor of 3 without any significant change in the soft band. The hard band flux stayed the same in XMM030802, XMM030809, XMM030818, and CXO030828 (not shown), while the soft band emission slightly increased. The RXTE light curves (Corcoran, 2005) also show a clear transition in the flux level and hardness ratio between XMM030722 and XMM030802. This means that the X-ray minimum has two states. By CXO030926, only the hard band flux recovered to the pre-minimum level.
The bottom panel in Figure 7 clearly shows that, throughout the observations, the hard band slope above 7 keV did not change significantly, nor did the ratio of hydrogen-like to helium-like Fe ion lines. This means that the electron temperature of the hottest plasma did not change during the 2003 minimum. On the other hand, the soft band flux relative to the hard band decreased gradually from the X-ray maximum through the minimum to the recovery. This looks like an increase of the absorption column to the X-ray plasma though the situation is somewhat more complicated, as the following sections describe. The 2003 minimum can be better described as an apparent decrease of the emission measure (E.M.) as suggested by earlier ASCA observations (Corcoran et al., 2000), which means that either the amount of X-ray emitting material has declined, or that the amount that is visible to the observer is smaller.
| Observation | kT | Flux | NH | Observed Flux | reduced (d.o.f.) | ||
|---|---|---|---|---|---|---|---|
| (keV) | (solar) | (10-4counts cm-2 s-1) | (1022 cm-2) | (10-11ergs cm-2 s-1) | |||
| XMM0007 | 0.470–0.471 | 4.6 (4.5–4.8) | 0.67 (0.63–0.70) | 0.91 (0.75–1.04) | 5.1 (5.0–5.2) | 6.5 | 2.85 (315) |
| XMM0301 | 0.922–0.924 | 4.3 (4.2–4.4) | 0.64 (0.62–0.65) | 2.4 (2.3–2.6) | 4.8 (4.7–4.9) | 15.0 | 10.29 (249) |
| XMM030608 | 0.988 | 4.5 (4.4–4.6) | 0.83 (0.81–0.85) | 4.1 (3.9–4.2) | 7.4 (7.3–7.5) | 12.8 | 12.77 (417) |
| XMM030613 | 0.990 | 5.4 (5.4–5.5) | 0.95 (0.94–0.97) | 6.9 (6.7–7.1) | 9.1 (9.0–9.2) | 19.3 | 17.49 (548) |
| CXOXMM0307 | 1.008–1.009 | 3.1 (2.8–3.6) | 0.44 (0.37–0.53) | 0.16 (0.13–0.20) | 28 (25–32) | 0.19 | 1.24 (193) |
| XMM030802 | 1.015 | 3.6 (3.3–3.9) | 0.64 (0.56–0.71) | 0.65 (0.58–0.78)bbThese values are upper-limits since the line shapes are not clearly seen in the spectra. | 42 (39–45) | 0.75 | 2.44 (119) |
| XMM030809 | 1.018 | 2.9 (2.8–3.1) | 0.64 (0.58–0.71) | 0.55 (0.45–0.65)bbThese values are upper-limits since the line shapes are not clearly seen in the spectra. | 36 (34–38) | 0.82 | 1.19 (94) |
| XMM030818 | 1.023 | 2.9 (2.8–3.1) | 0.58 (0.54–0.63) | 0.37 (0.26–0.42)bbThese values are upper-limits since the line shapes are not clearly seen in the spectra. | 29 (27–30) | 0.96 | 1.30 (161) |
| CXO030828aaAbout 4% of the photon events are piled-up, causing the spectrum to appear slightly harder. | 1.028 | 4.6 (3.4–5.4) | 0.48 (0.37–0.60) | 0.31 (0.3–0.43) | 18 (17–21) | 0.73 | 1.54 (137) |
| CXO030926 | 1.042 | 2.9 (2.3–3.3) | 0.40 (0.36–0.45) | 3.6 (3.0–4.3) | 36 (33–40) | 6.6 | 1.40 (242) |
Note. — These fits refer to the spectrum between 2–10 keV after subtraction of the CCE and the Homunculus emission. Parentheses show the range of values for which from the best-fit value.
4.2.2 1-Temperature Fit of the Entire Spectrum
To quantitatively describe the spectral shapes and compare them with earlier results obtained by ASCA and BeppoSAX (see §5), we fit each spectrum by an absorbed 1T thermal APEC777http://cxc.harvard.edu/atomdb/ model (which provided a better fit near the Fe K lines than the MEKAL model), with a Gaussian at 6.4 keV to account for the Fe K fluorescence line. The results are listed in Table 4.
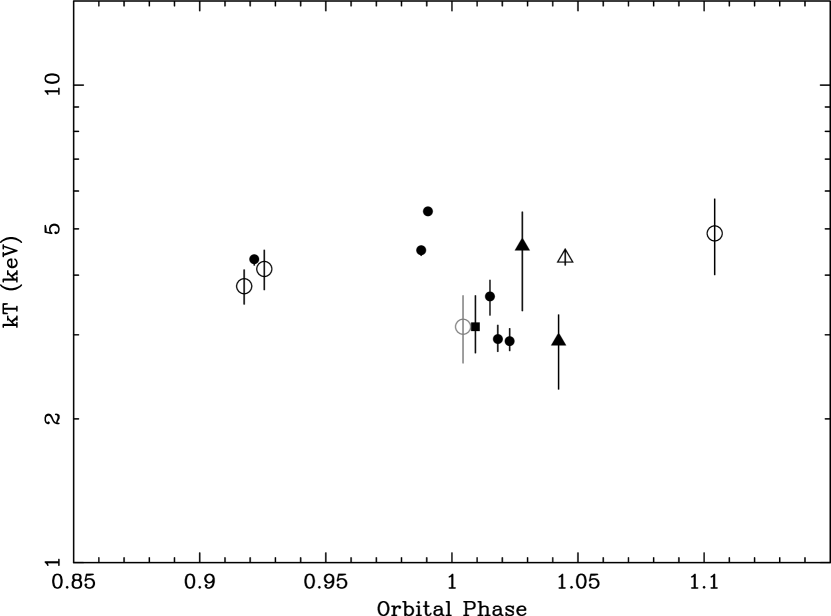
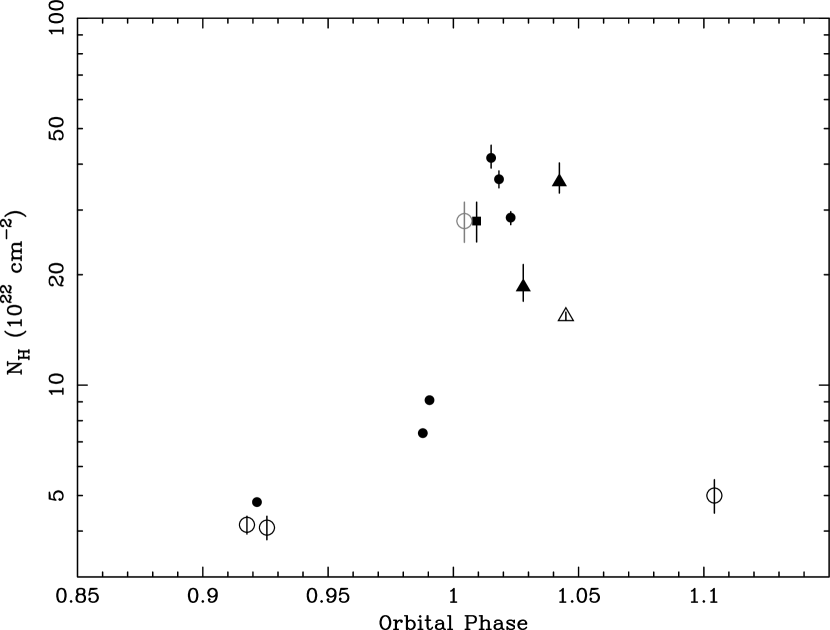
Most of the fits were not acceptable at the 90% confidence level. One reason for the poor fit by the absorbed 1T models is that the strong Fe K profile is quite complicated, as described in §4.2.3. Another reason, in particular for the spectra before the 2003 minimum, is that the plasma is really composed of multiple components with different temperatures as shown by Corcoran et al. (2001b), as their best-fit plasma temperatures kT 4–5 keV do not account for the strong lines of helium-like S and Si ions seen in the XMM-Newton spectra (which should be emitted from plasma with kT keV). The plasma temperatures outside the 2003 minimum (kT 4–5 keV) are consistent with earlier results (Tsuboi et al., 1997; Corcoran et al., 2000; Viotti et al., 2002; Leutenegger et al., 2003), but they are probably overestimated by our 1T model fit (see the next section). The derived absorption column, which does not depend strongly on temperature for kT 35 keV, gradually increased from NH cm-2 to NH cm-2.
4.2.3 Fits to the 5 keV Spectrum
![[Uncaptioned image]](/html/astro-ph/0702409/assets/x10.png)
Fig. 8. — Continued.
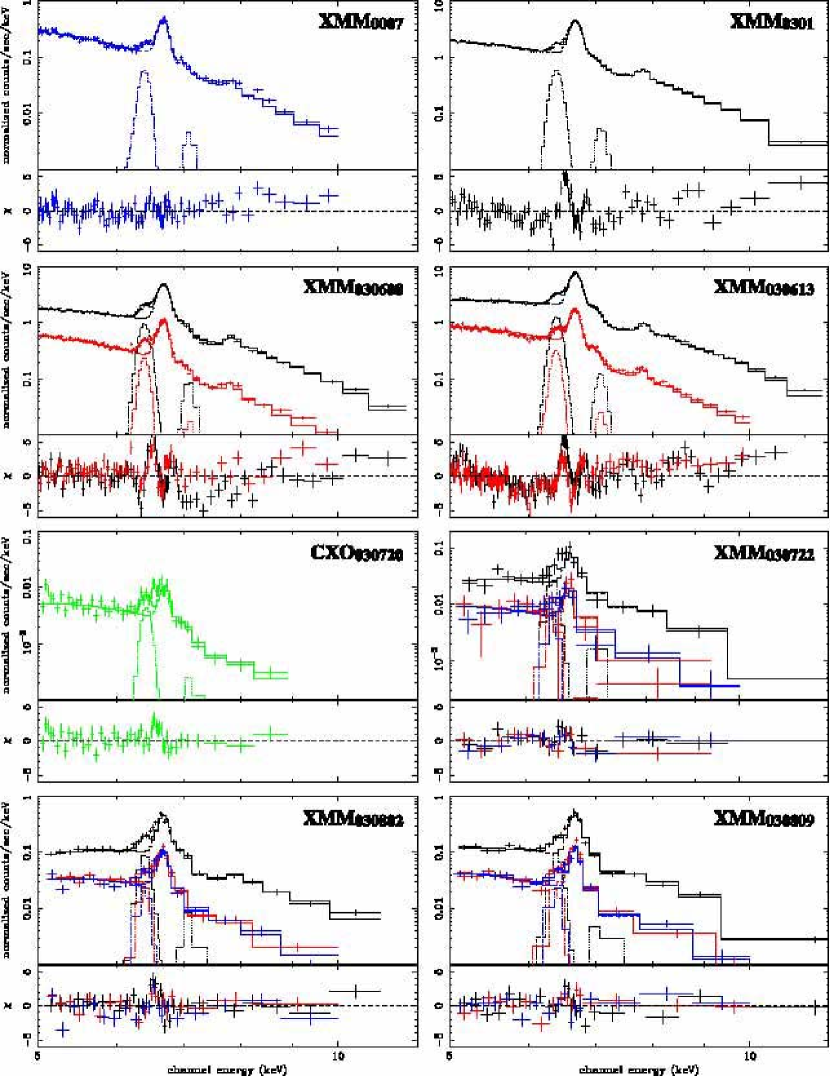
The EPIC spectra marginally resolved emission lines below 5 keV and could not reliably measure the neighboring continuum level. Spectral modelling of this energy band with unconstrained elemental abundances, therefore, has intrinsic uncertainty. On the other hand, the spectrum above 5 keV is relatively simple and provides an unambiguous measure of the hottest plasma from the continuum slope and Fe K line intensities. To characterize the hottest plasma, we thus fit the spectra above 5 keV by a simple absorbed 1T model.
In each observation, we simultaneously fit all the available spectra, using an APEC thermal equilibrium model for the thermal emission. We simultaneously fit the spectra of two observations, CXO030720 and XMM030722, which were obtained during the 2003 minimum within 2 days of each other. A preliminary fit to the bright phase spectra showed that most spectra could be fit with kT =3.3 keV, a nickel abundance near 0.8 solar, with solar abundances for other elements. Therefore, we fixed the nickel abundance at 0.8 solar and the temperature at 3.3 keV, and we varied the Fe abundance, column density and emission measure. We included 2 narrow Gaussian lines to account for lines of Fe K and K fluorescence, fixing their centroids at 6.4 keV and 7.1 keV, with their line widths () fixed at 0.01 keV, and the K line flux fixed at 11.3% of the K line flux. We used photoelectric absorption cross-sections calculated by Balucinska-Church & McCammon (1992). Table 5 gives the best-fit parameters, and the spectra, along with their best-fit models, are shown in Figure 8. The spectra except for XMM0007 and CXOXMM0307 accept the assumed model at 90% confidence, mostly because these spectra show several spectral features which are not fit by the model.
| Observation | log E.M. | EW(Fe) | NH | reduced (d.o.f.) | ||
|---|---|---|---|---|---|---|
| (solar) | (cm-3) | (eV) | (1022 cm-2) | |||
| XMM0007 | 0.470–0.471 | 0.48 (0.45–0.52) | 58.1 (58.158.2) | 87 (62–99) | 17 (14–20) | 1.43 (86) |
| XMM0301 | 0.922–0.924 | 0.48 (0.47–0.50) | 58.5 (58.558.5) | 99 (85–104) | 17 (16–19) | 4.07 (82) |
| XMM030608 | 0.988 | 0.55 (0.54–0.57) | 58.5 (58.558.5) | 164 (158–172) | 21 (20–22) | 4.21 (154) |
| XMM030613 | 0.990 | 0.44 (0.43–0.45) | 58.9 (58.958.9) | 119 (114–123) | 36 (35–37) | 3.66 (245) |
| CXOXMM0307 | 1.008–1.009 | 0.38 (0.30–0.47) | 57.0 (56.957.0) | 233 (183–325)aaThese values are regarded as upper-limits since the spectra did not clearly show the iron fluorescence line peak. | 40 (32–51) | 1.35 (90) |
| XMM030802 | 1.015 | 0.50 (0.46–0.55) | 57.7 (57.657.7) | 213aaThese values are regarded as upper-limits since the spectra did not clearly show the iron fluorescence line peak. | 53 (48–58) | 1.91 (71) |
| XMM030809 | 1.018 | 0.70 (0.63–0.77) | 57.5 (57.457.5) | 257aaThese values are regarded as upper-limits since the spectra did not clearly show the iron fluorescence line peak. | 32 (26–37) | 1.59 (54) |
| XMM030818 | 1.023 | 0.62 (0.57–0.67) | 57.5 (57.557.5) | 150aaThese values are regarded as upper-limits since the spectra did not clearly show the iron fluorescence line peak. | 27 (23–30) | 1.65 (84) |
| CXO030828bbAbout 4% of the photon events pile-up, causing the spectrum slightly hard. | 1.028 | 0.33 (0.24–0.42) | 57.5 (57.457.6) | 149 (96–214)aaThese values are regarded as upper-limits since the spectra did not clearly show the iron fluorescence line peak. | 37 (28–47) | 1.81 (54) |
| CXO030926 | 1.042 | 0.33 (0.29–0.37) | 58.7 (58.658.8) | 110 (90–136) | 56 (50–62) | 1.54 (130) |
Note. — These fits refer to the spectrum after subtraction of the CCE and the Homunculus emission. The plasma temperature and the Ni abundance were fixed at 3.3 keV and 0.8 solar, respectively.
The most prominent of these features are excesses on the blue and red sides of the K-shell lines of helium-like iron. Those excesses are not caused by poor energy or gain calibration, since there is good consistency in profile between the XMM030613 spectrum and the near-contemporaneous Chandra grating spectrum. The blue excess could be explained if the K lines of Fe XXV are Doppler broadened, with 4000 km s-1. This is similar to the derived wind velocity of the companion star, km s-1 (Pittard & Corcoran, 2002). The red excess, especially during the 2003 minimum and CXOXMM0307 and XMM030802 when the X-ray flux was the weakest, would require a Fe XXV Doppler shift of 7000 km s-1, and such high velocities are not expected in Car. However, the red excess may be produced by unresolved emission lines of Fe in ionization stages below Fe XXV in the 6.5–6.6 keV band. Interestingly, the ASCA minimum spectrum in ASCA971224 showed a similar excess (see §5.2), while a Chandra grating spectrum near apastron (0.53) showed a similar broad-band excess (Pittard & Corcoran, 2002). Presence of lower-ionization iron lines would indicate that the hottest plasma is no longer in collisional ionization equilibrium at 3.3 keV, and that the electron temperature is higher than the ion temperature. Non-equilibrium ionization (NEI) effects have been claimed in the X-ray spectrum of WR 140, another colliding wind system (Pollock et al., 2005).
Similarly, a hump-like spectral feature is perhaps present between 56.4 keV and becomes more noticeable during the early phase of the minima. There are no specific emission lines in this energy band, except a weak Ca XIX line at 4.56 keV. A similar feature is sometimes seen in the X-ray spectra of some AGNs (Tanaka et al., 1995), produced by gravitationally red-shifted material very near the central blackhole. However, there is little evidence that Car houses a black hole because of the lack of short term X-ray variability and relatively low X-ray luminosity.
A second feature is a hard “tail” at 9 keV, best seen in the residuals in XMM0007, XMM0301, XMM030608, and XMM030613 (see Figure 8). This feature is probably not an instrumental or background artifact: none of the spectra (except for CXO030828) suffer photon pile-up, and source count rates are much higher than the background. During the 2003 minimum the tail seems weaker or non-existent, though this may simply be an artifact since the source is weak at these times. The slope above 9 keV in XMM030613 can be fit by a bremsstrahlung model with kT 10 keV or power-law model with 2.3. Viotti et al. (2004) measured a similar photon index for a hard tail extending up to 150 keV, seen in a BeppoSAX PDS spectrum in June 2000 (0.46), but the flux between 1320 keV, 1.410-11 ergs cm-2 s-1, is about three times larger than the extrapolation of the hard tail we measured in XMM030613. The hard excess we see in the XMM-Newton data may be from an extremely hot plasma in the colliding wind region, or from non-thermal emission due to 1st-order Fermi acceleration at the wind contact surface, which would produce a population of relativistic electrons that can upscatter UV photons from the stellar photosphere and/or X-ray photons from the wind-wind shock.
We also clearly see an excess at 8.5 keV in the PN spectra in observations XMM0301 and XMM030613. This feature might be due to emission from K shell lines of heavy metals like Cu and Zn. Though the EPIC instrumental background shows emission from those elements (Strüder et al., 2001), inspection of the EPIC background data provided by the XMM project showed that the instrumental background at this energy was negligible in spectra obtained outside the minimum. This feature could indicate an overabundance of Cu or Zn, or perhaps be a part of the Cu edge at 9 keV (which would also require a large Cu overabundance as well). On the other hand, the feature might be produced by absorption edges from Fe XXV (8.8 keV) and Fe XXVI at 9.3 keV (Lotz, 1967).
Finally, the fourth feature is a marginal dip around 7 keV, which is seen in all the PN spectra, but which is not so prominent in the MOS spectra. This dip could be caused by an underestimate of the line intensity of hydrogen-like Fe ions at 6.9 keV (perhaps due to an underestimate of the maximum plasma temperature) or an underestimate of the strength of the Fe edge structure at 7.1 keV, perhaps indicating larger Fe absorption. This dip is especially noticeable in the observation CXO030926, and will be discussed more fully in the analysis of our Chandra HETGS observations (Corcoran et al. in preparation).
4.2.4 Adding a Soft Component to Reproduce the Entire Spectrum
| Observation | kT | log E.M. | NH | Reduced (d.o.f.) | ||
|---|---|---|---|---|---|---|
| (keV) | (solar) | (cm-3) | (1022 cm-2) | |||
| XMM0007 | 0.470–0.471 | 1.1 (1.11.2) | 0.25 (0.200.31) | 58.3 (58.258.4) | 5.4 (5.25.5) | 2.04 (225) |
| XMM0301 | 0.922–0.924 | 1.1 (1.11.1) | 0.18 (0.160.19) | 58.8 (58.858.8) | 5.4 (5.35.4) | 8.85 (164) |
| XMM030608 | 0.988 | 1.1 (1.11.1) | 0.24 (0.220.26) | 58.6 (58.658.7) | 6.9 (6.87.0) | 5.41 (260) |
| XMM030613 | 0.990 | 1.6 (1.51.6) | 0.25 (0.220.28) | 58.6 (58.558.6) | 7.7 (7.57.8) | 12.02 (300) |
| CXO030828 | 1.028 | 0.5 (0.40.9) | 0.58 | 59.9 (58.160.1) | 29 (1739) | 1.32 (80) |
| CXO030926 | 1.042 | 0.9 (0.61.8) | 0.28 (0.050.75) | 59.2 (58.060.5) | 23 (1333) | 0.52 (109) |
Note. — These fits refer to the spectrum after subtraction of the CCE and the Homunculus emission.
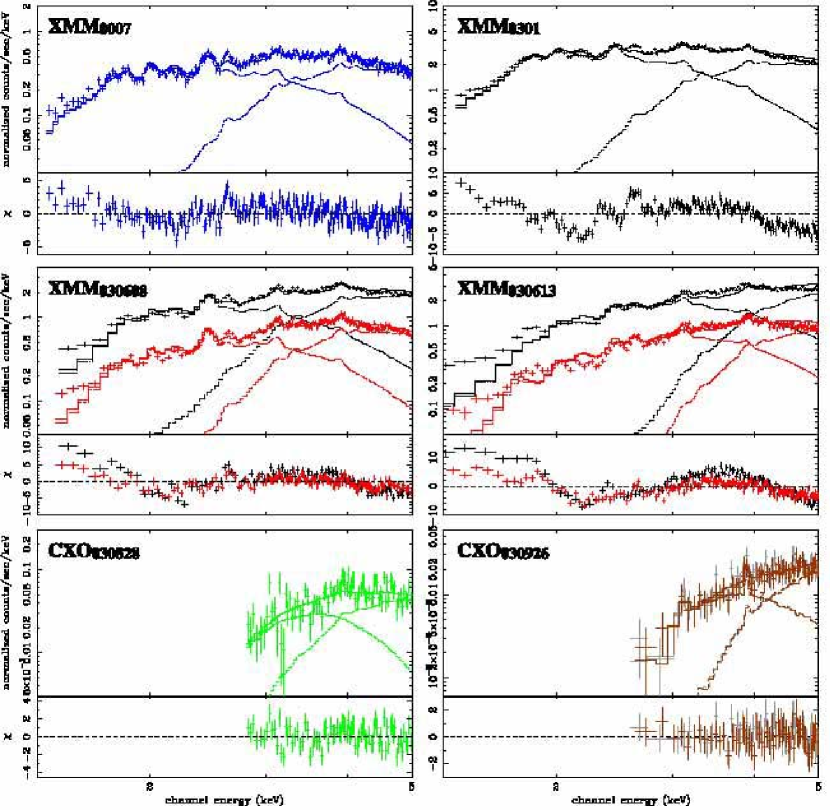
Extrapolation of the model spectrum above 5 keV from the XMM0007, XMM0301, XMM030608, XMM030613, CXO030828 and CXO030926 data to lower energies underestimates the observed emission at 5 keV, indicating the presence of additional cooler emitting material. We thus modeled the emission below 5 keV by fixing the best-fit model spectrum derived in §4.2.3, and adding another 1T component with independent absorption. The results are given in Table 6 and Figure 9.
These fits were not accepted at 90% confidence except the fit to the CXO030926 spectra. One reason for the poor quality of the fits is that the fixed hard component, which reproduces emission above 5 keV, somewhat overestimates the emission near 5 keV, which might indicate we slightly underestimated the absorption to the hard component. Another reason is that the best-fit models do not reproduce the strengths or locations of many emission lines, in particular S XIV, which is generally emitted by plasma at kT keV. This means that the spectra may require additional components with kT between 13 keV. The NH values we derive from this 2 component modeling are very close to the ones from the 1T fitting in §4.2.2.
5 Comparison with the Previous Observations Near X-ray Minima
The weekly to daily monitoring of Car with RXTE (Corcoran, 2005) showed significant cycle-to-cycle variability in flux and X-ray hardness. Since the RXTE data are contaminated by instrumental and cosmic background, we compared our XMM-Newton and Chandra results with earlier spatially-resolved observations from ASCA (Tanaka et al., 1994), BeppoSAX (Scarsi, 1993) and ROSAT (Trümper, 1984).
Between phase 0.10 0.10, there were 4 ASCA observations and 1 BeppoSAX observation near the 1998 minimum, and 1 ROSAT observation during the 1992 minimum. These observations are summarized in Table 7. Because of the extended point responses (FWHM a few arcminutes) of ASCA and BeppoSAX compared to XMM-Newton, source spectra extracted from these observations used relatively large () extraction regions (Corcoran et al., 2000; Viotti et al., 2002). This extraction area is about a factor of 20 larger than the area used in the XMM-Newton analysis (XMM SRC), and about a factor of 5000 larger than the area used in the Chandra analysis (CS SRC). Because the neighborhood of Car is crowded with X-ray sources and diffuse emission, the ASCA and BeppoSAX spectra will suffer greater contamination from neighboring sources.
| Abbreviation | Satellite | Date | Porbit | Exposure | NH | kT | Referecnce |
|---|---|---|---|---|---|---|---|
| (ksec) | (1022 cm-2) | (keV) | |||||
| ROSAT920612 | ROSAT | 1992 Jun. 12, 22:33 | 0.998 | 23.6 | |||
| ASCA970703 | ASCA | 1997 Jul. 3, 09:58 | 0.082 | 12.6 | 4.160.23 | 3.790.31 | 1 |
| ASCA970719 | ASCA | 1997 Jul. 19, 15:11 | 0.074 | 12.8 | 4.090.30 | 4.120.39 | 1 |
| ASCA971224 | ASCA | 1997 Dec. 24, 09:29 | 0.004 | 58.8 | 1 | ||
| SAX980318 | BeppoSAX | 1998 Mar. 18, 05:01 | 0.045 | 39.0aaExposure time for the MECS23 detector. | 15.40.4 | 4.350.15 | 2 |
| ASCA980716 | ASCA | 1998 Jul. 16, 04:40 | 0.104 | 13.4 | 5.000.52 | 4.890.88 | 1 |
5.1 Comparison of the 1997/98 and 2003 Spectra Outside the Minimum
Outside the minimum, contamination of the stellar source spectra in the ASCA and BeppoSAX observations from the surrounding sources, the CCE component, and the reflection from the Homunculus Nebula is 10% above 2.5 keV (see §5.2).
Viotti et al. (2002) tried two models to fit their BeppoSAX spectra: an absorbed single temperature bremsstrahlung model Gaussian for the spectrum between 310 keV, and an absorbed two temperature model to fit the entire spectrum between 0.110 keV. Both gave consistent results with each other for the central hard variable component. On the other hand, in an analysis of ASCA spectra obtained just prior to the 1997/98 minimum, Corcoran et al. (2000) fixed the emission from the outer ejecta using the model derived in Corcoran et al. (1998). Though the coolest temperature they used to fit the ASCA spectra (kT 0.3 keV) is a bit lower than our adopted temperature (kT 0.6 keV) and the resulting difference in the outer ejecta flux is about a factor of three at 2 keV, this only produces a 1% uncertainty in the flux of the variable emission outside the 2003 minimum. The results of their BeppoSAX and ASCA analyses, therefore, are comparable to the result we derived from our 1T fits to the entire XMM-Newton and Chandra spectra in §4.2.2.
The plasma temperatures in the 1997/98 observations were always around 45 keV, which is similar to our results. The derived values of NH varied significantly with phase (Figure 10), reaching a maximum during the X-ray minimum, and declining thereafter. The variation in 2003 was similar to the NH variation in 1997/98, except for the interval just at the end of the minimum. Though BeppoSAX and Chandra observed Car at a similar orbital phase (0.045, 1.042), the NH measured with Chandra in 2003 is a factor of two larger than the value derived by Viotti et al. (2002) from the BeppoSAX observations in 1998. This is consistent with the behavior of the hardness ratio after the recovery as measured by RXTE, which was higher in the 2003 recovery than in the 1998 recovery (Corcoran, 2005).
5.2 Comparison of the 1997/98 and 2003 Spectra During the Minima
In order to compare this dataset with the X-ray observations during the 2003 minimum, we re-analyzed the ASCA971224 GIS data. We screened the “revision2” data taken from the HEASARC archive888http://heasarc.gsfc.nasa.gov/W3Browse/ using gisclean and filtered it with the standard criteria, which excludes data affected by the South Atlantic Anomaly, Earth occultation and high background in regions with low geomagnetic rigidities. For both GIS2 and GIS3 detectors, we used a 3′ radius circle centered on Car as the source region “3′ SRC”, and used as background emission from a 3′ radius circle designated “3′ BGD” centered to the north-east of Car (Figure 2) where the soft diffuse X-ray emission from the Carina Nebula is apparently weak (Hamaguchi et al., 2006). We used the standard GIS response files, version 4.0 (g[23]v4_0.rmf) and generated ancillary response functions with ascaarf ver. 3.10. We then merged both GIS2 and GIS3 spectra together to improve signal to noise. The left panel of Figure 11 shows the GIS spectrum from ASCA971224.
Because the stellar source was faint during the minimum and the ASCA point spread function is large, contamination by nearby X-ray sources is significant for this observation. We therefore tried to estimate the contamination from emission from sources within 3′ of Car “3′ SRC” using XMM030722 (when the central point source of Car was the weakest) excluding the source region “XMM SRC” used for the analysis of Car from the XMM-Newton MOS2 data. We used the same background region as we used to estimate the ASCA background emission, “3′ BGD”. About 10% of the emission from Car (which amounts to 20% of the emission from the surrounding sources even in XMM030722) contaminates the “3′ SRC” region. We simulated the contamination due to Car and subtracted it from the ASCA source spectrum. The subtracted spectrum (Figure 12) does not show any evidence of the extremely strong nitrogen line at 0.5 keV from the outer ejecta, suggesting that contamination is well removed.

| Soft Component | Hard Component | ||||||||
|---|---|---|---|---|---|---|---|---|---|
| Model | kT | log E.M. | kT | log E.M. | Z | NH | reduced (d.o.f.) | ||
| (keV) | (cm-3) | (keV) | (cm-3) | (10-1 solar) | (1021 cm-2) | ||||
| 2T | 0.24 (0.18–0.29) | 57.7 (57.2–58.5) | 2.6 (1.9–3.3) | 56.2 (56.2–56.4) | 0.36 (0.19–0.70)aaThe abundace parameters of both soft and hard components are tied together. | 3.6 (2.6–5.5) | 1.28 (92) | ||
| 1T + pl | 0.27 (0.23–0.30) | 56.5 (56.3–56.8) | 2.5 (2.4–2.7) | 3 (fix)bbThe absorption is insensitive to abundance in the range between 0 and 10 solar. | 2.6 (2.1–3.3) | 1.26 (93) | |||
Note. — Values in parentheses denote 90% confidence limits.
The resulting spectrum, after subtracting the simulated Car spectrum, shows weak emission lines at 0.9 and 1 keV from Ne IX and Ne X, 0.8 keV possibly from Fe, and a marginal excess around 3–4 keV from Ca. This spectrum can be fit either by an optically thin, thermal (MEKAL) model with 2-temperature components or by a cool component plus a power-law component for the hard emission at slightly below the 90% confidence, assuming common absorption for both components (Table 8). In either model, the average absorption to these sources is consistent with the interstellar value (cm-2, see §2.2 of Leutenegger et al., 2003). As the spectrum does not have strong emission lines, the elemental abundance of the 2T model is small (0.04 solar), while the abundances are not constrained by the 1T plus power-law model. We thus fixed the abundances at 0.3 solar, a typical value for stellar X-ray emission obtained from low resolution CCD spectra (e.g. OB stars, Kitamoto & Mukai 1996; Kitamoto et al. 2000; low-mass MSs, Tagliaferri et al. 1997; low-mass PMSs, Yamauchi et al. 1996; Kamata et al. 1997; Tsuboi et al. 1998.)999 High resolution grating spectra with Chandra and XMM-Newton showed complex line profiles especially from OB stars, and therefore the abundance obtained from low resolution spectra may not reflect real elemental abundance. (e.g., Cassinelli et al., 2001; Kahn et al., 2001; Miller et al., 2002) The observed flux is 3.210-12 ergs cm-2 s-1 (0.5–10 keV).
The “3′ SRC” region includes at least 55 Chandra X-ray point sources (Evans et al., 2003): 6 OB stars and 49 unidentified, weak sources that might be low mass pre-main-sequence stars. The combined absorption corrected flux from these sources calculated from Table 3 and 4 in Evans et al. (2003) is 1.310-12 ergs cm-2 s-1 (0.52.04 keV). There is also diffuse emission within the source region which is also calculated from Evans et al. (2003) to have a flux of 5.710-12 ergs cm-2 s-1. The total absorption corrected flux, 710-12 ergs cm-2 s-1, is roughly consistent with our result 8.210-12 ergs cm-2 s-1 (0.52.04 keV, unabsorbed). Moreover, the combined absorption corrected fluxes of the point sources are as large as the flux from the hard component (1.710-12 ergs cm-2 s-1), and the flux from the diffuse emission is as large as the soft component, 6.510-12 ergs cm-2 s-1, in the keV band. As seen in Figure 2, many point sources are detectable at intermediate energies, where the hard component is dominant, but they are not clear in the soft band (except for HDE 303308). The hard component probably represents emission from point sources with the soft component dominated by diffuse emission and HDE 303308.
We have compared the ASCA spectrum to a model derived from our fits to the Chandra and XMM-Newton spectra including emission from the outer ejecta, from the Homunculus Nebula, from the CCE component and the variable model which fits the spectrum obtained from the CXOXMM0307 observation, along with emission from the surrounding sources (diffuse emission and point sources) which fall within the 3′ extraction circle. The ASCA spectrum agrees well with this combined model. Assuming that emission from the outer ejecta, X-ray Homunculus Nebula and the surrounding sources did not vary between 1997 and 2003 and that spectral shapes of the CCE and variable components did not change dramatically, the flux of both CCE and variable components are the same within 50%.
5.3 Comparison with the 1992 Minimum
There is one ROSAT PSPC observation of Car during the minimum in mid-1992. Corcoran et al. (1995) used this observation to show that the X-ray emission in the hard ROSAT band (1.6 keV) decreased by a factor of 2 at that time. ROSAT however had very little effective area above 2 keV so that the bulk of the variable emission was not observable by ROSAT.
Corcoran et al. (1995) extracted a spectrum from a 1.′85 radius circle excluding a 30′′ radius circle around the nearby bright star HDE 303308. To minimize contamination from surrounding sources, we re-extracted the spectrum using an elliptical source region of 65′′ 47.′′5, which includes emission from the outer ejecta but which excludes HDE 303308 and point and diffuse sources around Car. We took the same background region as used in our analysis of ASCA971224. In analyzing the PSPC spectrum, we used the standard response file pspcb_gain2_256.rmf from the ROSAT calibration databbase, but we generated the ancillary response file using the pcarf v. 2.1.3 as appropriate for this observation.
The PSPC spectrum is shown in the right panel of Figure 11. We have overlaid all the spectral components of Car on this spectrum as we did for the ASCA971224 spectrum, except for the component due to the surrounding sources, whose contribution would be small in the ROSAT spectrum due to the smaller PSPC extraction region. Emission between 0.51 keV, where the outer ejecta component is dominant, is about a factor of 30% larger than the model. This difference may be due to calibration uncertainties between ROSAT and XMM-Newton, or it might be produced by another variable source within the ROSAT extraction area. Though the XMM-Newton model of the CCE component only contributes to the few highest channels of the PSPC detector, this component is consistent with the ROSAT spectrum. Thus it appears that ROSAT did not detect the stellar component at all during the 1992 minimum.
6 Discussion
6.1 Emission from the Variable Component
RXTE clearly showed that the variable emission is periodic and leaves little doubt that the emission is produced by the WWC in a binary system (Corcoran, 2005), and if so, that the X-ray minimum occurs near periastron passage. Our results further strengthen this conclusion. The temperature of the hottest plasma, 3 keV, was mostly unchanged through the cycle, consistent with the collision of stellar winds at terminal velocities (e.g., see Ishibashi et al., 1999). Furthermore, the spectral shape varied in a periodic way, as well. However, the NH measured just after the end of the X-ray minimum was about a factor of two larger during the 2003 cycle than it was during the 1998 cycle.
Most of the light curves derived from the Chandra and XMM-Newton data showed no short-term variations, suggesting that the X-ray plasma is produced by a steady source and is probably larger than , where is the pre-shock velocity and is the exposure time of the observation. For km s-1 (corresponding to shock temperatures of keV) and exposure times of ksec (corresponding roughly to the XMM-Newton observing time), the size of the emitting region is probably AU, and perhaps considerably larger. The RXTE lightcurve also shows clear variations in observations separated by as little as 1 day, suggesting that the size of the emitting region is AU. Although the orbital elements are currently uncertain, the stellar separation at periastron may be as little as 1.5 AU (Corcoran et al., 2001a), so that the size of the emitting region may be comparable to the stellar separation at periastron passage.
Spectra outside the 2003 minimum require at least 2 temperatures, kT 3 keV and 1–1.5 keV, consistent with the analysis of a Chandra grating spectrum by Corcoran et al. (2001b). The failure to fit most of the spectra by 2 temperature models in §4.2.4 is perhaps an indication of the presence of more than 2 temperatures. This is consistent with a hydrodynamic simulation of the WWC plasma (Pittard & Stevens, 1997), in which the plasma temperature is the highest near the stagnation point where the winds collide head-on, and cooler farther along the bow-shock. The excess at the blue side of the Fe XXV line discussed in §4.2.3 may represent streams from the stagnation point flowing outward near the companion’s wind terminal velocity.
The RXTE light curves also displayed quasi-periodic X-ray “flares”, which correspond to hardness ratio maxima (Corcoran et al., 1997; Corcoran, 2005). XMM030608 occurred near the bottom of one of these flares, while XMM030613 occurred near a flare peak. A comparison of these spectra in Figure 7 shows that the hard band flux went up by a factor of two, while the soft band flux below 3 keV did not change except that emission lines are apparently weaker in XMM030613. This is consistent with an increase of the hardness ratio measured with RXTE. This indicates either a slight increase in kT and/or E.M. for the hottest plasma, possibly caused by increase of the density of the high-temperature gas near the stagnation point, as discussed for a similar event in the previous cycle observed with ASCA (Corcoran et al., 2000). The emission at keV, on the other hand, did not vary strongly between those observations. One possibility is that hard X-ray emission from the highest-temperature plasma at the stagnation point of the shock cone varied strongly due to density fluctuations of the primary or secondary wind, with the soft X-ray emission coming from a larger area which averages out such fluctuations. Another possibility is that the flares are related to instabilities in the WWC plasma.
6.2 The Absorber around the WWC Plasma
Before the 2003 minimum, NH measured from our fits to the spectra above 5 keV (hereafter NH[5 keV]) was always about a factor of four larger than NH measured from the spectra below 5 keV (NH[5 keV]; Figure 13). NH[5 keV] mainly represents Fe absorption, while NH[5 keV] represents absorption by lighter elements (Morrison & McCammon, 1983). Though this discrepancy can be produced by an Fe overabundance in the Car ejecta, the elemental abundances around the stellar source are near solar except for He and N, which are overabundant, and O and C, which are strongly depleted (Hillier et al., 2001; Verner et al., 2005; Davidson et al., 1984). Abundance anomalies of He, N, O and C would not change the amount of absorption above 1 keV. This means that the soft emission does not suffer as strong absorption as the hard emission before the minimum, and hence this supports the idea that the variable emission originates in multiple-temperature plasmas with various absorptions. This is consistent with the idea that the hot emission originates from a highly absorbed region near the apex of the shock cone, with the lower-energy emission arising from a region farther along the shock interface which suffers less absorption. Neither NH[5 keV] nor NH[5 keV] varied significantly between XMM0007 at 0.47 (close to apastron) and XMM0301 at 0.92, when the stellar separation changed by about a factor of 3. The value of NH[5 keV] before the minimum (51022 cm-2) may be absorption beyond the wind of the primary. The higher value of NH[5 keV] suggests that extra absorbing material must be located near the hottest plasma.
After XMM0301 and through the onset of the 2003 minimum, NH[5 keV] and the absorption column derived from fitting the spectra over the entire keV band (NH[whole], see Figure 10) increased to 351023 cm-2. As shown in Figure 10 the observed maximum column density occurred near the mid-point of the X-ray minimum, and the column densities declined thereafter towards the end of the minimum. During the X-ray minimum, NH[5 keV] was unmeasurable because of the near total suppression of the low energy flux. This could mean that the E.M. of the cool component decreased during the minimum, or that the absorption to the cool plasma also increased on the line of sight. Nevertheless, the NH[5 keV] confirms that the X-ray minimum is closely associated with an increase in the amount of absorption along the line of sight. This suggests that the WWC plasma entered into, or was hidden behind, the densest part of wind from the primary star. The behavior of the absorption towards the hard component, NH[5 keV], is in interesting contrast to the behavior of NH[whole]. NH[5 keV] had already increased to 41023 cm-2 by XMM030613 (i.e. prior to the start of the X-ray minimum) and it did not change strongly after that. This could be explained if the WWC region was bent, perhaps by the Coriolis force, causing the stagnation point to enter into the densest part of the primary’s wind earlier than the downstream material.
The column density did not decline until some time after the 2003 minimum ended. This confirms that the column density variation is not completely synchronous with the X-ray minimum. Conjunction probably occurred during the interval when NH was near its maximum observed value, in the phase interval . We note that the NH measured in 2003 (=1.042) is a factor of two larger than the NH measured in 1998 (=0.045). Davidson et al. (2005, see their Figure 2c) also noted that the absorption component in the P-(9017) line in 2003.72 () was stronger than in 1998.21 (), which might also indicate that the amount of absorbing material in the line of sight near the start of the X-ray minimum is increasing with time. However they also note that the equivalent widths of the H- emission lines were lower just after the end of the 2003 minimum. This might suggest a distribution of wind material which has preferentially grown denser in the line of sight than perpendicular to the line of sight in the 19982003 interval.
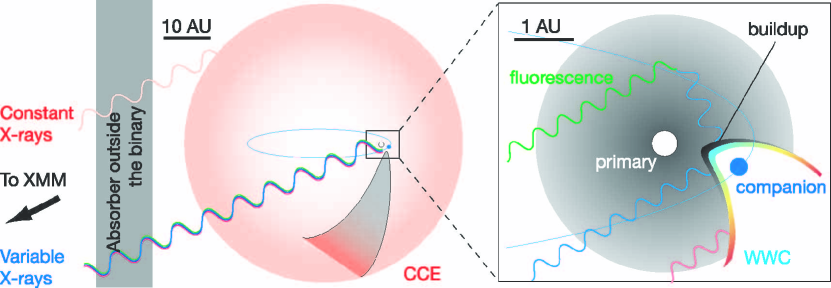
The equivalent width (EW) of the Fe K fluorescence line varied between 100200 eV, which is far smaller than the EW (1.5 keV) produced by scattering X-rays from the Homunculus Nebula (Corcoran et al., 2004). This suggests that the X-ray emission in all the observations comes directly from the WWC plasma, even during the X-ray minimum, with only a small scattered component (see Figure 14). From Inoue (1985), the Fe K fluorescence line EW produced by scattering from a spherically-symmetric medium around an X-ray source is EW 7.5NH[5 keV]/1022 eV, where we have multiplied Inoue’s coefficient by 0.75, the flux ratio in the keV band between a kT 3.3 keV thermal emission component appropriate to the Car spectra and the power-law emission component assumed by Inoue (1985). In Figure 13, we plot the expected Fe-K fluorescence line EWs as open symbols for a spherically-symmetric scattering medium. The differences between the expected and observed equivalent widths seem to be larger when the X-ray flux goes up and smaller when it goes down (XMM030608, XMM030613 and CXO030926), which may suggest that the variation of the fluorescence line is delayed by light travel time.
The observed EWs are 25% smaller than the expected EWs even during the XMM0007 (=0.470) and XMM0301 (=0.923) observations when the direct X-ray emission did not vary strongly. This suggests that the scattering material is not spherically symmetric as assumed in Inoue (1985), and that there is a deficit of scattering material off the line of sight. This deficit is probably produced by the wind-wind collision, since the region on the companion side of the shock has a much lower density than on the primary star’s side. In order to reduce the fluorescent Fe emission by 25%, the full opening angle of the wind shock cone would need to be 120∘. This is consistent with the measurement of the half-opening angle of ∘ by Pittard & Corcoran (2002).
6.3 The Nature of the X-ray Minimum
The 2003 X-ray minimum can be described as an apparent decrease in E.M., along with an increase in NH. However, a column density of NH 5cm-2 is needed to reduce the emission at 10 keV by two orders of magnitudes, and the observed maximum column density (NH cm-2) is much lower than this. The ASCA observations during the 1997/98 minimum (Corcoran et al., 2000) also appeared consistent with an apparent decline in E.M.
Two mechanisms could produce the observed decrease in E.M. One possibility is an “eclipse model”, namely that emitting region is almost totally, but not completely, obscured by an optically thick absorber with NH cm-2, and we only see the least absorbed residual emission during the minimum. Ishibashi et al. (1999) and Corcoran et al. (2001a) tested the eclipse model using the RXTE light curve of Car and showed that the duration of the X-ray minimum ( months) at high energies ( keV) was difficult to explain for a spherically symmetric wind from Car if the mass loss rate was constant at M⊙ yr-1. The eclipse model seems to require that the wind is not spherically symmetric, or that the absorption to the hard X-ray emitting region was enhanced for an extended interval near periastron passage. It also suggests that a portion of the hard emission is visible during the minimum so that the size of the hottest region is greater than the size of the occulting region.
Another possibility is that the emissivity of the WWC itself fades during the minimum, i.e. that there is a decline in the amount of material hot enough to generate keV X-rays. Some WWC models predict a change in the X-ray emissivity of the shock around periastron. For example, “radiative braking” (Gayley et al., 1997) in which UV photons from Car decelerate the companion’s wind at phases near periastron could reduce the intrinsic X-ray emission from the wind-wind collision at keV. Davidson (2002) suggested that strong instabilities near periastron might cause the shocked gas to radiatively cool, reducing the emission at high energies. Soker (2005) and Akashi et al. (2006) suggested that Bondi-Hoyle accretion of the primary star’s wind by the companion star near periastron could suppress the companion’s wind and thus reduce the emission from the colliding wind shock for a brief period. In optical observations, the He II emission line, which is believed to arise near the WWC shock, decreased in concert with the X-ray drop (Steiner & Damineli, 2004). Martin et al. (2006) argued that the disappearance of this line in a direct view of the star, and in a reflected polar view (the so-called “FOS4” position, Stahl et al., 2005) indicated a waning of the shocked gas during the minimum.
Below, we examine some of the behaviors of the electron temperature, iron line profile, iron fluorescence line variation and lack of variation at E 7 keV during the minimum from the 2003 X-ray spectra to try to decide between these two mechanisms.
6.3.1 Electron Temperature
The electron temperature of the hottest material did not change significantly during the 2003 minimum, as the normalized spectra at the bottom of Figure 7 clearly show. The constancy of the electron temperature of the hottest material argues against radiative braking, shock instability or accretion models which predict that the plasma temperature should decrease. Akashi et al. (2006)’s model in particular predicts complete shutdown of the WWC activity during periastron passage, and therefore could only be consistent with a constant electron temperature if an alternative X-ray emission mechanism during the minimum could produce plasma at nearly the same temperature as the WWC emission. If the shock actually disappears during the minimum, then the constancy of the high-energy X-ray continuum requires that a small part of the 3000 km s-1 secondary wind continues to produce a shock by encountering material directly at normal incidence.
6.3.2 The Iron Line Profile
The variable excess emission on the red side of the Fe XXV line can be explained by non-equilibrium ionization (NEI) effects in the high-temperature plasma, and variations in the strength of this feature means that the ion temperature of some of the high-temperature plasma in the colliding wind shock changed during the minimum. This might favor mechanisms in which the intrinsic emission from the shock declines with time near periastron, though the NEI effect itself does not reduce emissivity of the continuum. The observed excess at 6.55 keV is consistent with emission lines of around Fe XXI, present at an ionization time scale s cm-3 in the 3.3 keV plasma, where is the gas density and is the time after the gas starts heating. Since the gas density , it should be larger by more than two orders of magnitude at periastron than at apastron (using the orbital elements of Corcoran et al., 2001a). Thus near periastron the plasma should reach ionization equilibrium much faster (15 min, Soker, 2005) than at apastron. Perhaps near periastron, both the cooling time-scale and the equilibrium time-scale decrease relative to their values at apastron, but the cooling time-scale decreases faster. This means that near periastron the fraction of non-equilibrium gas to gas in equilibrium is larger than it is near apastron. However, since the radiative cooling time-scale has the same dependence on gas density as the ionization equilibrium time-scale (), an additional cooling mechanism (such as adiabatic expansion or conduction) needs to be effective near periastron in order to decrease the cooling time-scale faster than the equilibrium time-scale.
6.3.3 Iron Fluorescence Line Variations
As noted in the previous section, the EWs of the Fe K fluorescence line stayed below 200 eV during the 2003 minimum, and therefore the observed X-ray emission is direct emission, with only a small scattered component. The Fe fluorescence line flux decreased by a factor of 50 during the 2003 minimum (Figure 13). This could be produced by reducing the number of 7.1 keV X-ray photons from the source seen by the fluorescing region, or by reducing the number of photons from the fluorescing region which reach the observer. If we assume that the fluorescing region extends far from the stars then during the 2003 minimum either the X-ray source is nearly entirely covered by obscuring material along the line of sight to the fluorescing region, or the intrinsic X-ray emissivity has declined so that fewer ionizing photons reach the fluorescing medium. This picture is consistent with a similar variation of He II 4687 emission between the direct emission from the central WWC region and polar emission scattered from the SE lobe (Stahl et al., 2005; Martin et al., 2006).
6.3.4 The Lack of Variation at keV During the Minimum
The hard band X-ray emission above 7 keV reached its lowest value after the 2003 minimum started, recovered by a factor of 3 after XMM030722 and did not vary for at least 3 weeks from XMM030802 to CXO030828. Since RXTE light curves showed a similar trend in the previous cycle, the time variation seems to be phase repeatable. The observed X-ray flux after XMM030722 was 5% of the flux at XMM030613. It is very difficult for an eclipse of the X-ray emitting region by an opaque disk (similar to that proposed by Ishibashi et al., 1999, for example), to keep the observed flux constant for so long a time, since the stellar motion would be so fast near periastron that the emitting region moves beyond the occulter on day timescales, causing a short eclipse and a rapid rise in X-ray brightness. Perhaps a “leaky absorber” eclipse, in which the absorbing medium is very extended and composed of optically thick clumps, could better describe the behavior of the observed flux during the minimum. Models in which the shock cools may not be consistent with the constancy of the keV emission either, unless some residual emission at high energies could be generated after the shock cools.
6.4 The Origin of the CCE Component
The CCE component did not vary within the two months during the 2003 minimum when it could be observed. It apparently had the same spectrum during the 1998 minimum (as shown by our analysis of ASCA971224), and did not show any enhanced emission during the minimum in 1992. This suggests that the X-ray source is stable on time-scales of 510 years. The Chandra image during the 2003 minimum restricts the size of the emitting plasma to , constraining the maximum size of the CCE at 2000AU. The column density to this component, NH 51022 cm-2, is smaller than the column density to the variable emission component around the 2003 minimum, but each component shows nearly the same column density in January 2003 (before the 2003 minimum) and near apastron. After correcting for absorption, the X-ray luminosity of the CCE is 1034 ergs s-1. This suggests that a stable luminous source is present outside of the absorbing material which lies in front of the colliding-wind source at periastron.
One possibility is that the CCE component is produced within the wind of the companion star and/or Car due to the inherent instabilities of their radiatively-driven winds. The X-ray properties of the CCE component – kT 1 keV with little apparent X-ray variation – resemble the X-ray properties of normal OB stars (e.g. Berghöfer et al., 1997; Corcoran et al., 1993). For OB stars LXLbol to (Berghöfer et al., 1997), so that the X-ray luminosity of the CCE corresponds to a bolometric luminosity Lbol ergs s-1. This is somewhat larger than the luminosity of the companion according to Verner et al. (2005) (Lbol ergs s-1), but near the luminosity of Car (Lbol ergs s-1, Hillier et al., 2001).
Alternatively, the CCE emission could be produced in ambient gas shocked by a strong outflow from the stellar winds (see Figure 14). The maximum size of the CCE () means that it is inside the Little Homunculus nebula (Ishibashi et al., 2003), so that the CCE component might be produced by the collision of the polar wind from Car with the Little Homunculus. The velocity of the polar wind from Car is believed to be 1000 km s-1 (Smith et al., 2003a), which is sufficient to heat gas to kT 1 keV. If all the kinetic energy of this outflow is converted to thermal energy, the required mass loss rate would have to be only 310-8 M⊙ yr-1 in order to match the observed emission measure (7.01056 cm-3), which is only of the mass loss rate of Car (1010-4 M⊙ yr-1, Hillier et al., 2001; Pittard & Corcoran, 2002). The gas density inside the shell structure of the Little Homunculus should be less than the density of the shell, which is 10107 cm-3 (Ishibashi et al., 2003). Assuming that radiative cooling dominates, the cooling timescale of the plasma is 3, where is the emissivity. With a plasma density of 107 cm-3, and plasma temperature kT 1 keV, and (1keV) 3.110-23 ergs s-1 cm3, then 0.5 years, consistent with our result.
A third alternative is that the CCE might be associated with the outflowing material from the WWC that collides with cold circumstellar gas and is reheated. The required mass loss rate streaming out through the WWC is given by = 2LX/10-8/(km s-1) M⊙ yr-1, where is the efficiency to convert the kinetic energy to X-ray emission, and is the velocity of the outflow, which should be 1,000 km s-1 from the CCE temperature. Since the most of the companion’s wind goes into the shock cone, the of the outflowing material should be 10-5 M⊙ yr-1 (Pittard & Corcoran, 2002), and should only be 0.1%.
7 Conclusions & Summary
We have observed Car at key phases around the X-ray minimum in 2003 using the XMM-Newton and Chandra satellites and studied the variation of the X-ray spectral shape. We also compared the behavior of the X-ray emission during the 2003 minimum with observations during earlier minima made by ASCA, BeppoSAX and ROSAT. The results are summarized as follows.
-
1.
During the minimum, the hard and medium band emission from the central point source decreased to 15% of the flux outside the minimum, but the emission did not disappear. The X-ray flux varied in an apparently stepwise way near the middle of the minimum, suggesting that the X-ray minimum has two states. The light curve within any single observation did not show significant variability on timescales of a few ksec, supporting that the hard X-ray emission is produced in a WWC.
-
2.
The spectrum of the variable emission component changed markedly throughout the X-ray minimum. The medium band emission decreased gradually relative to the hard emission. Assuming an absorbed 1T model for the entire spectrum, the absorption to the central source increased from 51022 cm-2 to 41023 cm-2. The hard band flux went up prior to the X-ray minimum, and decreased abruptly during the 2003 minimum, without changing the spectral slope significantly, suggesting that the plasma electron temperature is constant around 3 keV.
-
3.
The line flux ratios between the helium-like ions and hydrogen-like ions of Si, S, and Fe seen in the spectra before the 2003 minimum indicate a similar type of multi-temperature plasma as seen near apastron by Corcoran et al. (2001b).
-
4.
The values of NH derived from the spectra above 5 keV (NH[5 keV]) are larger than those values of NH derived from the entire spectra (NH[whole]) or from the spectra below 5 keV (NH[5 keV]), but show less variation than NH[whole] or NH[5 keV]. This suggests that the hotter plasma has stronger absorption, i.e. emission from Car is multi-temperature, and each emission component is associated with an independent absorption component. This means that the hotter and cooler emission originate in spatially distinct regions. The hardest emission, which is believed to arise from material near the stagnation point of the WWC region, perhaps shows the effects of a build-up of material as the colliding wind shock plows through the primary wind.
-
5.
The Fe XXV line profile showed a small blue excess, and a strong red excess before the 2003 minimum. The blue excess may be due to Doppler shifting of the line centroid or line broadening, and if so, the observed velocity is 4000 km s-1. The red excess may indicate that some of the plasma is no longer in ionization equilibrium. The line showed a stronger red excess during the 2003 minimum than outside the minimum, which we interpret as decrease in the cooling time scale of the plasma near periastron. Interestingly, we note that an outburst spectrum of the dwarf nova SS Cyg taken with the Suzaku satellite showed a similar red excess on the Fe K line profile accompanied with a decrease in the hard band X-ray flux (Ishida et al., 2007).
-
6.
We find evidence for a hard tail at keV, at about an order of magnitude larger than the background level, in spectra outside the X-ray minimum. This either indicates the presence of very hot plasma in the system or non-thermal emission perhaps produced by first-order Fermi acceleration of particles which then Compton-upscatter UV seed photons from the stellar photospheres and/or X-ray photons from the shock.
-
7.
The values of NH and kT of the X-ray spectrum at corresponding phases in previous cycles are very similar to those during the 2003 cycle, except during the recovery phase. In particular, the ASCA spectrum during the 1997/98 minimum (ASCA971224) is almost identical to the spectrum from CXOXMM0307. The difference in NH during the recovery, as measured by Chandra and BeppoSAX could be produced by an increase in the density of the wind from Car.
-
8.
The EWs of the Fe fluorescence line at 6.4 keV are always below the values expected from NH[5 keV] assuming a spherically symmetric absorber. This is probably because the absorber is not spherically symmetric and is consistent with the lack of scattering matter in the lower-density wind of the companion if the full opening angle of the shock cone is ∘, consistent with the value derived by Pittard & Corcoran (2002).
-
9.
The X-ray minimum is caused by the apparent decrease of the plasma E.M. An eclipse model seems to explain the observed constancy of the plasma electron temperature, while the small EWs of the Fe fluorescence line and the deformation of the Fe XXV He-like triplet might indicate a real decline in the amount of hot gas in the colliding wind shock. It might also indicate that nearly all of the shock is hidden by an optically thick but slightly porous stellar wind.
-
10.
We discovered a constant emission (CCE) component very near the central X-ray source. The CCE component can be seen between 13 keV during the X-ray minimum; at other times the emission from the colliding wind source overwhelms it. This component showed no variation on either short timescales within any observation or between observations for about two months during the 2003 minimum, and was apparently the same during the 1997/98 and 1992 minima. The CCE spectrum exhibited emission lines of Si XIII and S XIV, and can be fit by an absorbed 1T model with NH 51022 cm-2, kT 1.1 keV and absorption corrected LX 1034 ergs s-1. Chandra data suggest that the emission is point-like, restricting the size of the source 2000AU at 2.3 kpc. This emission might be produced by collisionally-heated shocks from the fast winds from Car or perhaps the fast moving outflow from the wind-wind collision with the ambient gas, or might be associated with shocked gas which is intrinsic to the wind of Car.
-
11.
X-ray emission within 3′ from Car can be reproduced by 2 emission components with interstellar absorption: cool plasma with kT 0.25 keV (perhaps coming from the diffuse emission and HDE 303308), and hot plasma with kT 2.6 keV or power-law , perhaps coming from a cluster of young stars. Correcting for these emission components is important in understanding the X-ray spectrum of Car derived from lower spatial resolution X-ray observatories like ASCA and Suzaku.
-
12.
Emission from the outer ejecta did not vary significantly on timescales of several years. The slope of the highest energy emission associated with the spectrum of the outer ejecta can be reproduced with kT 0.6 keV, which is consistent with the highest temperature derived from analysis of the emission line spectrum (Leutenegger et al., 2003).
Currently, there are few reasons to suspect that the variable X-ray emission is not driven by shocks produced by the WWC from binary stars. For the first time, the spatially-resolved observations of Car obtained by XMM-Newton and Chandra has revealed the details of the plasma and absorption components which are directly associated with the WWC plasma. While the earlier spectral analysis of Pittard & Corcoran (2002) did not account for the different emission components identified in this work, their fit was largely determined by emission above 2 keV which we have shown is dominated by emission from the WWC at the phase of their analysis.
Still the biggest mystery is the cause of the X-ray minimum, which is difficult to fully explain by occultation by a smooth wind from the primary star. If the X-ray activity really switches off during the minimum, a fading of the X-ray emission can be imaged in principle using the scattered X-ray emission from the Homunculus Nebula. The intensity of the Fe K-shell fluorescence line just after the onset of the 2003 minimum should change differently between the eclipsing model and the fading model, and perhaps detailed monitoring of this line by spatially resolved X-ray spectral observations could decide the issue. On the other hand, deformation of the Fe XXV line profiles is unusual in the context of stellar systems, though similar deformation has been noted in iron lines arising from regions of strong gravity near black holes. This feature requires further study with high resolution spectrometers such as an X-ray micro-calorimeter to produce sufficient spectral resolution at 7 keV.
References
- Akashi et al. (2006) Akashi, M., Soker, N., & Behar, E. 2006, ApJ, 644, 451
- Anders & Grevesse (1989) Anders, E., & Grevesse, N. 1989, Geochim. Cosmochim. Acta, 53, 197
- Aschenbach et al. (2000) Aschenbach, B., Briel, U. G., Haberl, F., Bräuninger, H. W., Burkert, W., Oppitz, A., Gondoin, P., & Lumb, D. H. 2000, in SPIE, Vol. 4012, X-Ray Optics, Instruments, and Missions III, ed. Joachim E. Trümper, Bernd Aschenbach, p. 731–739
- Balucinska-Church & McCammon (1992) Balucinska-Church, M., & McCammon, D. 1992, ApJ, 400, 699
- Berghöfer et al. (1997) Berghöfer, T. W., Schmitt, J. H. M. M., Danner, R., & Cassinelli, J. P. 1997, A&A, 322, 167
- Cassinelli et al. (2001) Cassinelli, J. P., Miller, N. A., Waldron, W. L., MacFarlane, J. J., & Cohen, D. H. 2001, ApJ, 554, L55
- Corcoran (2005) Corcoran, M. F. 2005, AJ, 129, 2018
- Corcoran et al. (2000) Corcoran, M. F., Fredericks, A. C., Petre, R., Swank, J. H., & Drake, S. A. 2000, ApJ, 545, 420
- Corcoran et al. (2004) Corcoran, M. F., et al. 2004, ApJ, 613, 381
- Corcoran et al. (1997) Corcoran, M. F., Ishibashi, K., Davidson, K., Swank, J. H., Petre, R., & Schmitt, J. H. M. M. 1997, Nature, 390, 587
- Corcoran et al. (2001a) Corcoran, M. F., Ishibashi, K., Swank, J. H., & Petre, R. 2001a, ApJ, 547, 1034
- Corcoran et al. (1998) Corcoran, M. F., et al. 1998, ApJ, 494, 381
- Corcoran et al. (1995) Corcoran, M. F., Rawley, G. L., Swank, J. H., & Petre, R. 1995, ApJ, 445, L121
- Corcoran et al. (2001b) Corcoran, M. F., et al. 2001b, ApJ, 562, 1031
- Corcoran et al. (1993) Corcoran, M. F., et al. 1993, ApJ, 412, 792
- Cox et al. (1995) Cox, P., Mezger, P. G., Sievers, A., Najarro, F., Bronfman, L., Kreysa, E., & Haslam, G. 1995, A&A, 297, 168
- Damineli (1996) Damineli, A. 1996, ApJ, 460, L49
- Davidson (1999) Davidson, K. 1999, in ASP Conf. Ser. 179: Eta Carinae at The Millennium, ed. J. A. Morse, R. M. Humphreys, & A. Damineli, p. 304
- Davidson (2002) Davidson, K. 2002, in Astronomical Society of the Pacific Conference Series, p. 267
- Davidson et al. (1984) Davidson, K., Dufour, R. J., Walborn, N. R., & Gull, T. R. 1984, in IAU Symp. 105: Observational Tests of the Stellar Evolution Theory, ed. A. Maeder & A. Renzini, 261
- Davidson et al. (1995) Davidson, K., Ebbets, D., Weigelt, G., Humphreys, R. M., Hajian, A. R., Walborn, N. R., & Rosa, M. 1995, AJ, 109, 1784
- Davidson & Humphreys (1997) Davidson, K., & Humphreys, R. M. 1997, ARA&A, 35, 1
- Davidson et al. (2005) Davidson, K., et al. 2005, AJ, 129, 900
- Davidson et al. (1982) Davidson, K., Walborn, N. R., & Gull, T. R. 1982, ApJ, 254, L47
- den Herder et al. (2001) den Herder, J. W., et al. 2001, A&A, 365, L7
- Duncan et al. (1995) Duncan, R. A., White, S. M., Lim, J., Nelson, G. J., Drake, S. A., & Kundu, M. R. 1995, ApJ, 441, L73
- Evans et al. (2003) Evans, N. R., Seward, F. D., Krauss, M. I., Isobe, T., Nichols, J., Schlegel, E. M., & Wolk, S. J. 2003, ApJ, 589, 509
- Feast et al. (2001) Feast, M., Whitelock, P., & Marang, F. 2001, MNRAS, 322, 741
- Gayley et al. (1997) Gayley, K. G., Owocki, S. P., & Cranmer, S. R. 1997, ApJ, 475, 786
- Hamaguchi et al. (2006) Hamaguchi, K., et al. 2006, ArXiv Astrophysics e-prints (astro-ph/0610024)
- Hillier et al. (2001) Hillier, D. J., Davidson, K., Ishibashi, K., & Gull, T. 2001, ApJ, 553, 837
- Inoue (1985) Inoue, H. 1985, Space Science Reviews, 40, 317
- Ishibashi et al. (1999) Ishibashi, K., Corcoran, M. F., Davidson, K., Swank, J. H., Petre, R., Drake, S. A., Damineli, A., & White, S. 1999, ApJ, 524, 983
- Ishibashi et al. (2003) Ishibashi, K., et al. 2003, AJ, 125, 3222
- Ishida et al. (2007) Ishida, M., Okada, S., Nakamura, R., Terada, Y., Mukai, K., & Hamaguchi, K. 2007, in Proceedings of the Extreme Universe in the Suzaku Era, Progress of Theoretical Physics, in preparation
- Jansen et al. (2001) Jansen, F., et al. 2001, A&A, 365, L1
- Kahn et al. (2001) Kahn, S. M., et al. 2001, A&A, 365, L312
- Kamata et al. (1997) Kamata, Y., Koyama, K., Tsuboi, Y., & Yamauchi, S. 1997, PASJ, 49, 461
- Kitamoto & Mukai (1996) Kitamoto, S., & Mukai, K. 1996, PASJ, 48, 813
- Kitamoto et al. (2000) Kitamoto, S., Tanaka, S., Suzuki, T., Torii, K., Corcoran, M. F., & Waldron, W. 2000, Advances in Space Research, 25, 527
- Leutenegger et al. (2003) Leutenegger, M. A., Kahn, S. M., & Ramsay, G. 2003, ApJ, 585, 1015
- Lotz (1967) Lotz, W. 1967, ApJS, 14, 207
- Martin et al. (2006) Martin, J. C., Davidson, K., Humphreys, R. M., Hillier, D. J., & Ishibashi, K. 2006, ApJ, 640, 474
- Martin & Koppelman (2004) Martin, J. C., & Koppelman, M. D. 2004, AJ, 127, 2352
- Mewe et al. (1995) Mewe, R., Kaastra, J. S., & Liedahl, D. A. 1995, Legacy, 6, 16
- Miller et al. (2002) Miller, N. A., Cassinelli, J. P., Waldron, W. L., MacFarlane, J. J., & Cohen, D. H. 2002, ApJ, 577, 951
- Morrison & McCammon (1983) Morrison, R., & McCammon, D. 1983, ApJ, 270, 119
- Pittard & Corcoran (2002) Pittard, J. M., & Corcoran, M. F. 2002, A&A, 383, 636
- Pittard & Stevens (1997) Pittard, J. M., & Stevens, I. R. 1997, MNRAS, 292, 298
- Pittard et al. (1998) Pittard, J. M., Stevens, I. R., Corcoran, M. F., & Ishibashi, K. 1998, MNRAS, 299, L5
- Pollock et al. (2005) Pollock, A. M. T., Corcoran, M. F., Stevens, I. R., & Williams, P. M. 2005, ApJ, 629, 482
- Scarsi (1993) Scarsi, L. 1993, A&AS, 97, 371
- Seward et al. (2001) Seward, F. D., Butt, Y. M., Karovska, M., Prestwich, A., Schlegel, E. M., & Corcoran, M. 2001, ApJ, 553, 832
- Smith et al. (2003a) Smith, N., Davidson, K., Gull, T. R., Ishibashi, K., & Hillier, D. J. 2003a, ApJ, 586, 432
- Smith et al. (2003b) Smith, N., Gehrz, R. D., Hinz, P. M., Hoffmann, W. F., Hora, J. L., Mamajek, E. E., & Meyer, M. R. 2003b, AJ, 125, 1458
- Soker (2005) Soker, N. 2005, ApJ, 635, 540
- Stahl et al. (2005) Stahl, O., Weis, K., Bomans, D. J., Davidson, K., Gull, T. R., & Humphreys, R. M. 2005, A&A, 435, 303
- Steiner & Damineli (2004) Steiner, J. E., & Damineli, A. 2004, ApJ, 612, L133
- Strüder et al. (2001) Strüder, L., et al. 2001, A&A, 365, L18
- Tagliaferri et al. (1997) Tagliaferri, G., Covino, S., Fleming, T. A., Gagné, M., Pallavicini, R., Haardt, F., & Uchida, Y. 1997, A&A, 321, 850
- Tanaka et al. (1994) Tanaka, Y., Inoue, H., & Holt, S. S. 1994, PASJ, 46, L37
- Tanaka et al. (1995) Tanaka, Y., et al. 1995, Nature, 375, 659
- Trümper (1984) Trümper, J. 1984, Advances in Space Research, 3, 483
- Tsuboi et al. (1998) Tsuboi, Y., Koyama, K., Murakami, H., Hayashi, M., Skinner, S., & Ueno, S. 1998, ApJ, 503, 894
- Tsuboi et al. (1997) Tsuboi, Y., Koyama, K., Sakano, M., & Petre, R. 1997, PASJ, 49, 85
- Turner et al. (2001) Turner, M. J. L., et al. 2001, A&A, 365, L27
- van Boekel et al. (2003) van Boekel, R., et al. 2003, A&A, 410, L37
- van Genderen et al. (1999) van Genderen, A. M., Sterken, C., de Groot, M., & Burki, G. 1999, A&A, 343, 847
- Verner et al. (2005) Verner, E., Bruhweiler, F., & Gull, T. 2005, ApJ, 624, 973
- Viotti et al. (2002) Viotti, R. F., et al. 2002, A&A, 385, 874
- Viotti et al. (2004) Viotti, R. F., Antonelli, L. A., Rossi, C., & Rebecchi, S. 2004, A&A, 420, 527
- Weis et al. (2004) Weis, K., Corcoran, M. F., Bomans, D. J., & Davidson, K. 2004, A&A, 415, 595
- Weisskopf et al. (2002) Weisskopf, M. C., Brinkman, B., Canizares, C., Garmire, G., Murray, S., & Van Speybroeck, L. P. 2002, PASP, 114, 1
- Whitelock et al. (1994) Whitelock, P. A., Feast, M. W., Koen, C., Roberts, G., & Carter, B. S. 1994, MNRAS, 270, 364
- Yamauchi et al. (1996) Yamauchi, S., Koyama, K., Sakano, M., & Okada, K. 1996, PASJ, 48, 719