Cosmic-ray composition and its relation to shock acceleration by supernova remnants
Abstract
An overview is given on the present status of the understanding of the origin of galactic cosmic rays. Recent measurements of charged cosmic rays and photons are reviewed. Their impact on the contemporary knowledge about the sources and acceleration mechanisms of cosmic rays and their propagation through the Galaxy is discussed. Possible reasons for the knee in the energy spectrum and scenarios for the end of the galactic cosmic-ray component are described.
keywords:
cosmic rays , origin , acceleration , propagation , knee , air showerPACS:
98.70.Sa , 96.50.sdurl]www-ik.fzk.de/joerg
1 Introduction
The origin of high-energy cosmic rays is one of the open questions in astroparticle physics. The fully ionized atomic nuclei reach the Earth from outside the solar system with energies from the GeV range up to eV. Most of them are assumed to originate in the Milky Way. At the highest energies, exceeding eV, the particles are usually considered of extragalactic origin. This review focuses on galactic cosmic rays. To distinguish between different models of the cosmic-ray origin requires detailed measurements of the energy spectrum, mass composition, and arrival direction of charged cosmic rays. Additional and complementary information is obtained through the measurements of high-energy photons up to TeV energies.
This review starts with a short overview on detection methods typically applied to measure the composition of cosmic rays on satellites, balloons, and at ground level (Sect. 2). The propagation of cosmic rays through the Galaxy is in the focus of Sect. 3. Recent progress concerning the sources and acceleration of the high-energy particles is described in Sect. 4. One of the headstones in understanding the origin of galactic cosmic rays is to know the reasons for the knee in the energy spectrum. In Sect. 5 recent measurements of the all-particle energy spectrum, the mean mass, and spectra for individual elements are compiled and their impact on the contemporary knowledge of the origin of galactic cosmic rays is discussed. The end of the galactic cosmic-ray spectrum and the transition to an extragalactic component is briefly illuminated in Sect. 6.
2 Experimental Techniques
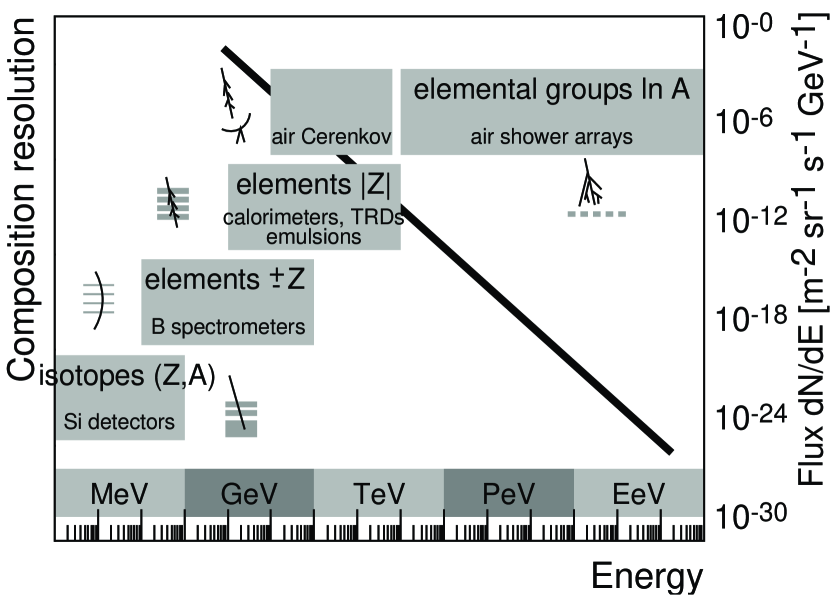
The energies of cosmic rays extend from the GeV domain up to eV. Within this range the particle flux decreases by about 30 orders of magnitude. This has implications on the accuracy to determine the mass composition of cosmic rays. At low energies the flux is large enough to build sophisticated detectors with an active area of a few 100 cm2 to measure the abundance of individual isotopes. On the other hand, at the highest energies, where only a few particles are expected per km2 and century, huge ground based installations are necessary to measure secondary products generated by cosmic rays in the atmosphere and the (average) mass can be estimated coarsely only. The situation is sketched figuratively in Fig. 1.
At energies in the MeV range sophisticated silicon detectors, operated in outer space, like the Ulysses HET (Simpson et al., 1992) or the ACE/CRIS (0.025 m2 sr) (Stone et al., 1998) experiments can identify individual isotopes, fully characterized by simultaneous measurements of their energy, charge, and mass . Since the particles have to be absorbed completely in a silicon detector this technique works up to energies of a few GeV only.
In the GeV domain particles are registered with magnetic spectrometers on stratospheric balloons, like the BESS instrument (Ajima et al., 2000). They are the only detectors discussed here which are able to identify the sign of the particles charge. All other detectors rely on the fact that the specific ionization loss is , thus is derived from the measurements. Magnet spectrometers are the only detectors suitable to distinguish between matter and antimatter as e.g. , , or . The particle momentum is derived from the curvature of the trajectory in a magnetic field, which limits the usage of these detectors to energies approaching the TeV scale.
At higher energies particles are measured with balloon borne instruments on circumpolar long duration flights (Jones, 2005). Individual elements are identified, characterized by their charge and energy. is determined through measurements. Experimentally most challenging is the energy measurement. In calorimeters the particles need to be (at least partly) absorbed. The weight of a detector with a thickness of one hadronic interaction length () and an area of 1 m2 amounts to about 1 t. Due to weight limitations actual detectors like ATIC (Guzik et al., 2004) or CREAM (Seo et al., 2004) have to find an optimum between detector aperture and energy resolution, resulting in relatively thin detectors with a thickness of 1.7 (ATIC) or 0.7 (CREAM) only. The measurement of transition radiation from cosmic-ray particles allows to build large detectors with reasonable weight. The largest cosmic-ray detector ever flown on a balloon, the TRACER experiment (Gahbauer et al., 2004) has an aperture of 5 m2 sr. During a long duration balloon flight over Antarctica (Hörandel, 2006a) and another flight from Sweden to Alaska (Boyle, 2006), up to now an exposure of 70 m2 sr d has been reached with this experiment. With such exposures the energy spectra for individual elements can be extended to energies exceeding eV.
To access higher energies very large exposures are necessary. At present reached only in ground based experiments, registering extensive air showers. In the TeV regime (small) air showers are observed with imaging Čerenkov telescopes such as the HEGRA (Aharonian et al., 1999), HESS (Hinton, 2004), MAGIC (Ferenc, 2005), or VERITAS (Weekes et al., 2002) experiments. These instruments image the trajectory of an air shower in the sky with large mirrors onto a segmented camera.
For primary particles with energies exceeding eV the particle cascades generated in the atmosphere are large enough to reach ground level, where the debris of the cascade is registered in large arrays of particle detectors. Two types of experiments may be distinguished: installations measuring the longitudinal development of showers (or the depth of the shower maximum) in the atmosphere and apparatus measuring the density (and energy) of secondary particles at ground level.
The depth of the shower maximum is measured in two ways. Light-integrating Čerenkov detectors like the BLANCA (Fowler et al., 2001) or TUNKA (Gress et al., 1999) experiments are in principle arrays of photomultiplier tubes with light collection cones looking upwards in the night sky, measuring the lateral distribution of Čerenkov light at ground level. The depth of the shower maximum and the shower energy is derived from these observations. Imaging telescopes as in the HiRes (Abu-Zayyad et al., 2001a) or AUGER (Abraham et al., 2004) experiments observe an image of the shower on the sky through measurement of fluorescence light, emitted by nitrogen molecules, which had been excited by air shower particles. These experiments rely on the fact that the depth of the shower maximum for a primary particle with mass relates to the depth of the maximum for proton induced showers as
| (1) |
where g/cm2 is the radiation length in air (Matthews, 2005; Hörandel, 2006b).
An example for an air shower array is the KASCADE-Grande experiment (Antoni et al., 2003; Navarra et al., 2004), covering an area of 0.5 km2. The basic idea is to measure the electromagnetic component in an array of unshielded scintillation detectors and the muons in scintillation counters shielded by a lead and iron absorber, while the hadronic component is measured in a large calorimeter (Engler et al., 1999). The total number of particles at observation level is obtained through the measurement of particle densities and the integration of the lateral density distribution (Antoni et al., 2001). The direction of air showers is reconstructed through the measurement of the arrival time of the shower particles in the individual detectors. Measuring the electron-to-muon ratio in showers, the mass of the primary can be inferred. A Heitler model of hadronic showers (Hörandel, 2006b) yields the relation
| (2) | |||
This illustrates the sensitivity of air shower experiments to . To measure the composition with a resolution of 1 unit in the shower maximum has to be measured to an accuracy of about 37 g/cm2 (see (1)) or the ratio has to be determined with an relative error around 16% (see (2)). Due to the large intrinsic fluctuations in air showers, with existing experiments at most groups of elements can be reconstructed with .
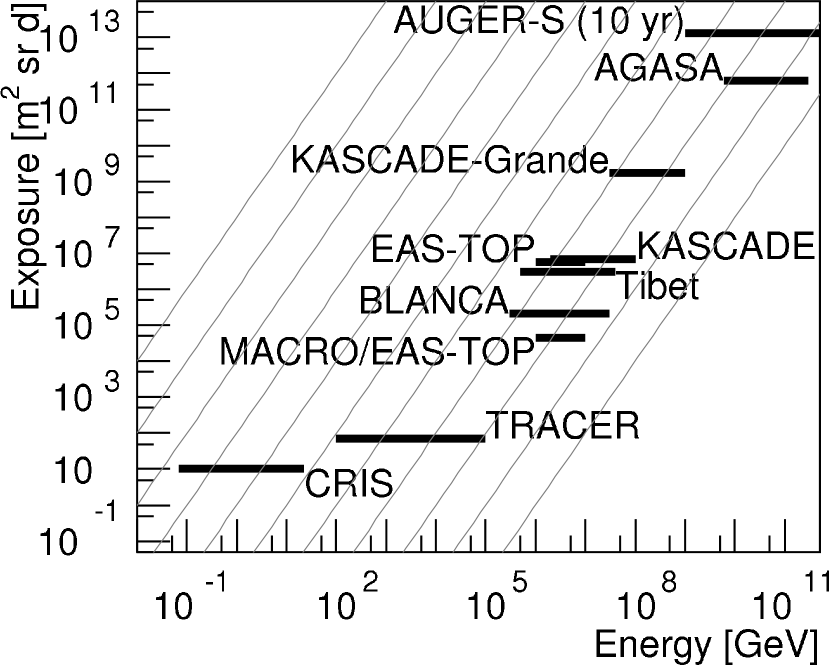
The exposure achieved by several experiments is shown in Fig. 2. The integral cosmic-ray flux roughly depends on energy as . Hence, the grey lines () serve to compare the exposure of detectors in different energy regimes. It can be recognized that the different experiments, despite of their huge differences in physical size, ranging from the cm2 CRIS space experiment to the km2 AUGER air shower experiment, have about equal effective sizes when the decreasing cosmic-ray flux is taken into account.
3 Propagation
The propagation of cosmic rays in the Galaxy can be described quantitatively, taking into account energy loss, nuclear interactions, radioactive decay, spallation production, and production by radioactive decay, using the equation (Simpson, 1983)
| (3) |
is the flux of species after propagating through an amount of matter g/cm2 subject to the reduction of , that represents the source term. The other parameters are: , the rate of ionization energy loss; , the total inelastic cross section for species ; , the mean lifetime at rest for radioactive decay for species ; , the cross section for production of species from fragmentation of species ; , the mean lifetime at rest for decay of species into species ; , Avogadro’s Number; , the mean atomic weight of the interstellar gas; and , the Lorentz factor. The exact spatial distribution of the matter traversed becomes important only when considering radioactive isotopes, since the distance traversed in a time is .
Abundances of stable secondary nuclei (produced during propagation) indicate the average amount of interstellar medium traversed during propagation before escape. Because secondary radioactive cosmic-ray species will be created and decay only during transport, their steady-state abundances are sensitive to the confinement time if their mean lifetimes are comparable or shorter than this time.
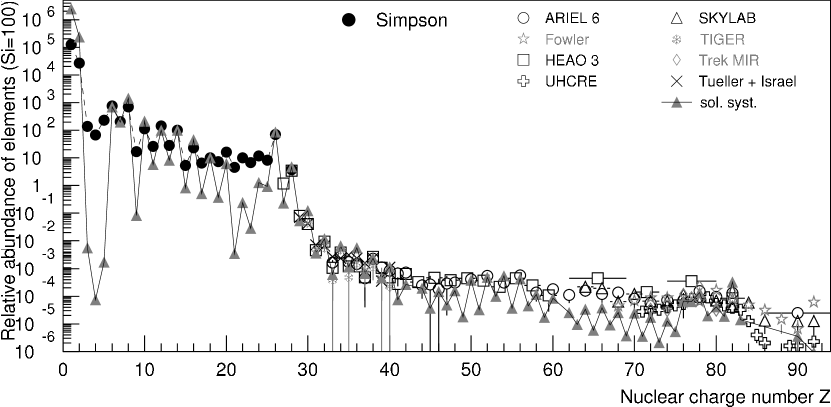
At low energies around 1 GeV/n the abundance of individual elements in cosmic rays has been measured. A compilation of data from various experiments is presented in Fig. 3. The data are compared to the abundance in the solar system. Overall, a good agreement between cosmic rays and solar system matter can be stated. However, there are distinguished differences as well, giving hints to the acceleration and propagation processes of cosmic rays.
The elements lithium, beryllium, and boron, the elements below iron (), and the elements below the lead group () are significantly more abundant in cosmic rays as compared to the solar system composition (Fig. 3). This is attributed to the fact, that these elements are produced in spallation processes of heavier elements (fourth term in (3)) during the propagation through the Galaxy.
Measured ratios of secondary to primary nuclei, namely boron/carbon and (scandium+vanadium)/iron, are shown in Fig. 4 (Yanasak et al., 2001). These ratios can be used to estimate the matter traversed by cosmic rays in the Galaxy (Garzia-Munoz et al., 1987). The data can be successfully described using a Leaky Box model, assuming the escape path length for particles with rigidity and velocity as
| (4) |
with (Yanasak et al., 2001). The lines in Fig. 4 correspond to this function with a path length at 2 GeV/n around 13 g/cm2 decreasing to g/cm2 at 100 GeV/n.

However, at high energies a path length according to (4) decreases as and reaches extremely small values. They should result in large anisotropies of the arrival direction of cosmic rays, not observed by experiments (Ptuskin, 1997; Hörandel et al., 2007). To sustain a suitable path length at high energies a residual path length model has been proposed, assuming the relation g/cm2 for the escape path length (Swordy, 1995). Recent measurements of the TRACER experiment yield an upper limit for the constant term of 0.15 g/cm2 (Müller et al., 2005).
The spallation processes during the cosmic-ray propagation influence also the shape of the spectra. Usually, it is assumed, that the energy spectra of all elements have the same slope, i.e. the same spectral index at the source. Taking the energy dependence of the spallation cross sections and the pathlength of the particles in the Galaxy into account, it is found that at Earth the spectra of heavy nuclei should be flatter as compared to light elements (Hörandel et al., 2007). For example, the spectral index for iron nuclei should be about 0.13 smaller than the corresponding value for protons. Indeed, direct measurements indicate that the spectra of heavy elements are flatter as compared to light elements (Hörandel, 2003a), e.g. the values for protons and iron differ as expected. This effect could be of importance for the propagation of ultra-heavy nuclei and their possible contribution to the all-particle spectrum to explain the second knee around 400 PeV (Hörandel et al., 2007).
During the propagation also radioactive secondary nuclei are produced (fifth term in (3)). Their abundance can be used to estimate the spatial distribution of the matter traversed or the cosmic-ray confinement time in the Galaxy if the half-life time is comparable to the confinement time (Garcia-Munoz et al., 1975; Simpson and Garcia-Munoz, 1988). Measuring the abundance of the isotopes 10Be ( yr), 26Al ( yr), 36Cl ( yr), and 54Mg ( yr) with the ACRE/CRIS experiment, the propagation time in the Galaxy has been determined to be yr (Yanasak et al., 2001).
In the Leaky Box model, the product is proportional to the escape path length . Knowing and , thus allows to determine the average density of the interstellar matter. Measurements of the CRIS experiment yield an average hydrogen number density in the interstellar matter H atoms/cm3. A comparison to the average density in the galactic disc /cm3 indicates that cosmic rays spend most of their propagation time outside the galactic disc, diffusing in the galactic halo. The height of the diffusion region into the halo has been estimated by Molnar and Simon (2003) with measurements of the 10Be/9Be-ratio by the ISOMAX experiment to be a few ( kpc). Direct evidence of cosmic rays propagating in the galactic halo is obtained from the observation of the diffuse -ray background, extending well above the disc, by the EGRET experiment (Strong and Mattox, 1996). The -ray energy spectrum exhibits a structure in the GeV region, which is interpreted as indication for the interaction of propagating cosmic rays with interstellar matter (CR+ISM) (Strong and Moskalenko, 1999).
At energies in the air shower domain measurements of the boron-to-carbon ratio (or other ratios of secondary to primary elements) are not feasible any more. However, in this energy region propagation models can be constrained by information about the arrival direction of cosmic rays.
An anisotropy is expected due to the motion of the observer (at the Earth) relative to the cosmic-ray gas, known as the Compton Getting effect (Compton and Getting, 1935). Such an anisotropy, caused by the orbital motion of the Earth around the Sun has been observed for cosmic rays with energies of a few TeV (Cutler and Groom, 1986; Amenomori et al., 2004a).
The Super-Kamiokande experiment investigated large-scale anisotropies in the arrival direction of cosmic rays with energies around 10 TeV (Oyama, 2006; Guillian et al., 2005). A excess (”Taurus excess”) is found with an amplitude of at right ascension and declination . On the other hand, a deficit (”Virgo deficit”) is found with an amplitude of at and . The anisotropy observed is compatible with a Compton Getting effect caused by a velocity of about 50 km/s relative to the rest frame. This velocity is smaller than the rotation speed of the solar system around the galactic center ( km/s). This implies that the rest frame of cosmic rays (presumably the galactic magnetic fields) is corotating with the Galaxy.
The Tibet experiment reports anisotropies in the same regions on the sky (Amenomori, 2006). For energies below 12 TeV the large-scale anisotropies show little dependence on energy, whereas above this energy anisotropies fade away, consistent with measurements of the KASCADE experiment in the energy range from 0.7 to 6 PeV (Antoni et al., 2004a). A Compton Getting effect caused by the orbital motion of the solar system around the galactic center would cause an excess at , and a minimum at , with an amplitude of 0.35%. However, the measurements at 300 TeV yield an anisotropy amplitude of , consistent with an isotropic cosmic-ray intensity. Hence, a galactic Compton Getting effect can be excluded with a confidence level of about . This implies, similar to the result of the Super-Kamiokande experiment, that galactic cosmic rays corotate with the local galactic magnetic field environment.
Upper limits of anisotropy amplitudes in the PeV region are compatible with the anisotropies expected from diffusion models of cosmic-ray propagation in the Galaxy, while Leaky Box models predict a too high level of anisotropy (e.g. Hörandel et al., 2007). In particular, a model by Candia et al. (2003), based on an approach of Ptuskin et al. (1993), is well compatible with the measurements (Maier et al., 2005).
4 Sources and Acceleration of Cosmic Rays
The energy density of cosmic rays amounts to about eV/cm3. This value is comparable to the energy density of the visible star light eV/cm3, the galactic magnetic fields eV/cm3, or the microwave background eV/cm3. The power required to sustain a constant cosmic-ray intensity can be estimated as erg/s, where is the residence time of cosmic rays in a volume (the Galaxy, or the galactic halo). With a rate of about three supernovae per century in a typical Galaxy the energy required could be provided by a small fraction () of the kinetic energy released in supernova explosions. This has been realized already by Baade and Zwicky (1934). The actual mechanism of acceleration remained mysterious until Fermi (1949) proposed a process that involved interaction of particles with large-scale magnetic fields in the Galaxy. Eventually, this lead to the currently accepted model of cosmic-ray acceleration by a first-order Fermi mechanism that operates in strong shock fronts which are powered by the explosions and propagate from the supernova remnant (SNR) into the interstellar medium (Axford et al., 1977; Krymsky, 1977; Bell, 1978; Blanford and Ostriker, 1978).
Diffusive, first-order shock acceleration works by virtue of the fact that particles gain an amount of energy at each cycle, when a cycle consists of a particle passing from the upstream (unshocked) region to the downstream region and back. At each cycle, there is a probability that the particle is lost downstream and does not return to the shock. Higher energy particles are those that remain longer in the vicinity of the shock and have enough time to achieve the high energy. After a time the maximum energy attained is , where is the velocity of the shock. This results in an upper limit, assuming a minimal diffusion length equal to the Larmor radius of a particle of charge in the magnetic fields behind and ahead of the shock. Using typical values of type II supernovae exploding in an average interstellar medium yields TeV (Lagage and Cesarsky, 1983). More recent estimates give a maximum energy up to one order of magnitude larger for some types of supernovae PeV (Berezhko, 1996; Kobayakawa et al., 2002; Sveshnikova, 2003). As the maximum energy depends on the charge , heavier nuclei (with larger ) can be accelerated to higher energies. This leads to consecutive cut-offs of the energy spectra for individual elements proportional to their charge , starting with the proton component.
The overall similarity between cosmic rays and matter in the solar system, as already seen in Fig. 3, indicates that cosmic rays are ”regular matter”, but accelerated to extreme energies.

Detailed information on the composition at the source can be obtained from measurements of the abundance of refractory nuclei. They appear to have undergone minimal elemental fractionation relative to one another during the propagation process. The derived abundance at the source is presented in Fig. 5 versus the abundance in the solar system (Wiedenbeck et al., 2003). The two samples exhibit an extreme similarity over a wide range. Of the 18 nuclides included in this comparison, only 58Fe is found to have an abundance relative to 28Si that differs by more than a factor of 1.5 from the solar-system value. When uncertainties are taken into account, all of the other abundances are consistent with being within 20% of the solar values. This indicates that cosmic rays are accelerated out of a sample of well mixed interstellar matter.
The time between synthesis of cosmic-ray material and its acceleration to high energies has been estimated by measurements of the abundances of 59Ni and 59Co by the ACE/CRIS experiment (Wiedenbeck et al., 1999). These nucleides form a parent-daughter pair in a radioactive decay which can occur by electron capture only. This decay cannot occur once the nuclei are accelerated to high energies and striped of their electrons. The measured abundances indicate that the decay of 59Ni to 59Co has occurred, leading to the conclusion that a time longer than the yr half-life time of 59Ni elapsed before the particles were accelerated. Such long delays indicate the acceleration of old, stellar or interstellar material rather than fresh supernova ejecta. For cosmic-ray source material to have the composition of supernova ejecta would require that these ejecta not undergo significant mixing with normal interstellar gas before yr have elapsed.
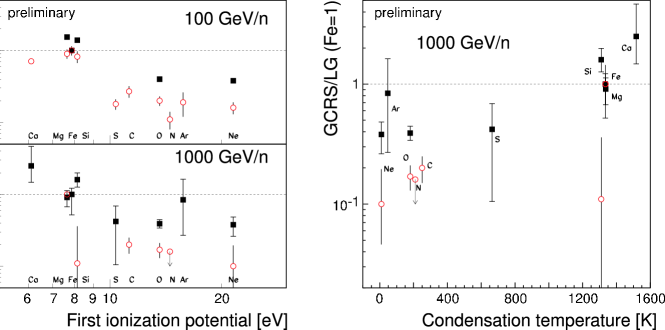
Ratios of individual cosmic-ray elemental abundances to the corresponding solar system abundances seem to be ordered by the first ionization potential (FIP) of the elements. In the GeV energy range elements with a FIP below eV are about ten times more abundant in the cosmic-ray sources than are elements with a higher FIP (Meyer et al., 1997). It has also been found that the abundance ratios of galactic cosmic rays to the solar system values scale with the condensation temperature . Refractory elements ( K) are more abundant than volatile elements ( K). A model which could perhaps account for the FIP effect would have a source ejecting its outer envelope for a long period with a FIP selection effect (as the sun does) followed by a supernova shock which sweeps up and accelerates this material. It has been proposed that the FIP effect is due to non-volatiles being accelerated as grains, while the volatiles are accelerated as individual nuclei (Meyer et al., 1998; Ellison et al., 1998). Recent measurements of the TRACER experiment allow to investigate these effect at higher energies, namely at 100 GeV/n and 1000 GeV/n (Müller et al., 2005). In Fig. 6 the abundance at the cosmic-ray sources relative to the solar system abundances are shown as function of the first ionization potential and as function of condensation temperature. The decreasing ratio as function of FIP and the increase as function of condensation temperature, known from lower energies, is also pronounced at energies as high as 1000 GeV/n, as can be inferred from the figure.
The theory of acceleration of (hadronic) cosmic rays at shock fronts in supernova remnants, mentioned above, is strongly supported by recent measurements of the HESS experiment (Aharonian et al., 2004, 2006), observing TeV -rays from the shell type supernova remnant RX J1713.7-3946, originating from a core collapse supernova of type II/Ib. For the first time, a SNR could be spatially resolved in -rays and spectra have been derived directly at a potential cosmic-ray source. The measurements yield a spectral index for the observed -ray flux. The photon energy spectrum of the supernova remnant RX J1713 is depicted in Fig. 7. Measurements in various energy ranges (ATCA at radio wavelengths, ASCA x-ray, EGRET GeV -ray, CANGAROO and HESS TeV -ray) are compared to predictions of a model by Völk and Berezhko (2006).
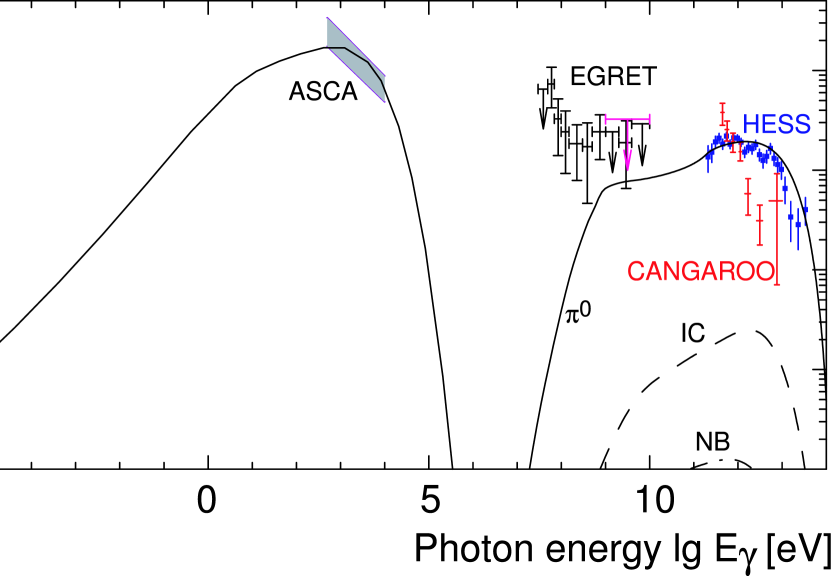
The solid line below eV indicates synchrotron emission from electrons ranging from radio frequencies to the x-ray regime. The observed synchrotron flux is used to adjust parameters in the model, which in turn, is used to predict the flux of TeV -rays. An important feature of the model is that efficient production of nuclear cosmic rays leads to strong modifications of the shock with large downstream magnetic fields (G). Due to this field amplification the electrons are accelerated to lower maximum energy and for the same radio/x-ray flux less electrons are needed. Consequently, the inverse Compton and Bremsstrahlung fluxes are relatively low only. The solid line above eV reflects the spectra of decaying neutral pions, generated in interactions of accelerated hadrons with material in the vicinity of the source (hadr + ISM ). This process is clearly dominant over electromagnetic emission generated by inverse Compton effect and non-thermal Bremsstrahlung, as can be inferred from the figure. The results are compatible with a nonlinear kinetic theory of cosmic-ray acceleration in supernova remnants and imply that this supernova remnant is an effective source of nuclear cosmic rays, where about 10% of the mechanical explosion energy are converted into nuclear cosmic rays (Völk and Berezhko, 2006). Further quantitative evidence for the acceleration of hadrons in supernova remnants is provided by measurements of the HEGRA experiment (Aharonian, 2001) of TeV -rays from the SNR Cassiopeia A (Berezhko et al., 2003) and by measurements of the HESS experiment from the SNR ”Vela Junior” (SNR RX J0852.0-4622) (Völk, 2006).
5 The Knee in the Energy Spectrum
5.1 All-Particle Spectrum
As discussed above, in the standard picture of galactic cosmic rays, it is assumed that the particles gain energy in supernova remnants and propagate diffusively through the Galaxy (e.g. Gaisser, 2005). The nuclei are accelerated up to a maximum energy, being proportional to their charge. During propagation some particles leak out of the Galaxy and the leakage probability is a function of the nuclear charge as well. This implies that the energy spectra for individual elements should exhibit a break (or knee structure) at energies being proportional to the elemental charge.
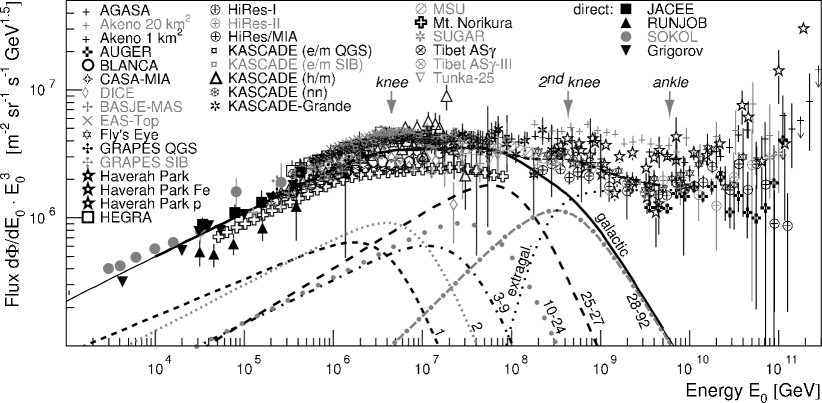
The situation is sketched in Fig. 8. The lines indicate energy spectra for groups of elements following power laws with a break proportional to . In the particular example the cut-off energy is assumed as PeV, according to the poly-gonato model (Hörandel, 2003a) and a possible contribution of ultra-heavy elements () is shown as well. Summing up the fluxes of all elements yields the all-particle flux, indicated as ”galactic” in the figure. The all-particle flux follows a power law with a spectral index up to about 4.5 PeV and then exhibits a kink, the knee in the energy spectrum and continues with an index at higher energies. This scenario agrees well with the flux measured with detectors above the atmosphere and with air shower experiments, shown in the figure as well. In the measured spectrum some structures can be recognized, indicating small changes in the spectral index . The most important are the knee at PeV, the second knee at PeV, where the spectrum exhibits a second steepening to , and the ankle at about 4 EeV, above this energy the spectrum seems to flatten again to . To understand the origin of these structures is expected to be a key element in understanding the origin of cosmic rays.
Various scenarios to explain the knee are proposed in the literature, for an overview see e.g. (Hörandel, 2004, 2005). The most popular approaches (maximum energy attained and leakage), just described above, are modeled with varying details, resulting in slightly different spectra. But, also other ideas are discussed, like the reacceleration of particles in the galactic wind, the interaction of cosmic-ray particles with dense photon fields in the vicinity of the sources, interactions with the neutrino background assuming massive neutrinos, the acceleration of particles in -ray bursts, or hypothetical particle physics interactions in the atmosphere, transporting energy in unobserved channels, thus faking the knee feature. All scenarios result in spectra for individual elements with a break at energies being either proportional to the nuclear charge or to the nuclear mass which yield certain structures in the sum spectrum. To distinguish between the different models, measurements of the (average) mass of cosmic rays as function of energy are required, or – even better – the measurement of spectra of individual elements or at least elemental groups.
5.2 Mean Mass
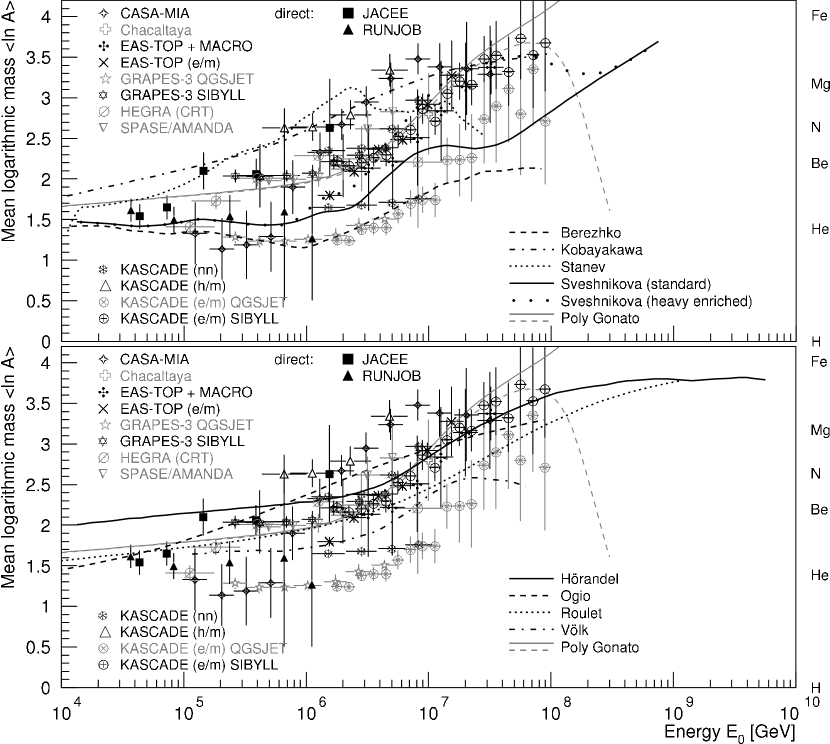
Models: The the grey solid and dashed lines indicate spectra according to the poly-gonato model (Hörandel, 2003a).
Top: The lines indicate spectra for models explaining the knee due to the maximum energy attained during the acceleration process according to Sveshnikova (2003) (—, ), Berezhko and Ksenofontov (1999) (- - -), Stanev et al. (1993) (), Kobayakawa et al. (2002) (--).
Bottom: The lines indicate spectra for models explaining the knee as effect of leakage from the Galaxy during the propagation process according to Hörandel et al. (2007) (—), Ogio and Kakimoto (2003) (- - -), Roulet (2004) (), as well as Völk and Zirakashvili (2003) (--).
Frequently, the ratio of the number of electrons and muons is used to determine the mass composition, see (2). Muons with an energy of several 100 MeV to 1 GeV are used by the experiments CASA-MIA (Glasmacher et al., 1999a), EAS-TOP (Aglietta et al., 2004a), GRAPES-3 (Hayashi et al., 2005), or KASCADE. To study systematic effects two hadronic interaction models are used to interpret the data measured with GRAPES-3 and KASCADE (Antoni et al., 2005). High energy muons detected deep below rock or antarctic ice are utilized by the EAS-TOP/MACRO (Aglietta et al., 2004b) and SPASE/AMANDA (Rawlins et al., 2003) experiments. Also, the correlation between the hadronic and muonic shower components has been investigated, e.g. by the KASCADE experiment (Hörandel et al., 1998). The production height of muons has been reconstructed by HEGRA/CRT (Bernlöhr et al., 1998) and KASCADE (Büttner et al., 2003).

Results from various experiments measuring electrons, muons, and hadrons at ground level are compiled in Fig. 9. The same experimental data are presented in the upper and lower graphs, where they are compared to different models. At low energies the values for the mean logarithmic mass are complemented by results from direct measurements. A clear increase of as function of energy can be recognized. However, individual experiments exhibit systematic differences of about unit. Such fluctuations in are expected according to the simple estimate (2), assuming that the ratio of the electromagnetic and muonic shower components can be measured with an accuracy of the order of 16%. This uncertainty is a realistic value for the resolution of air shower arrays. Of particular interest are the investigations of the KASCADE and GRAPES-3 experiments: interpreting the measured data with two different models for the interactions in the atmosphere results in a systematic difference in of about 0.7 to 1.
The experimental values in Fig. 9 follow a trend predicted by the poly-gonato model as indicated by the grey lines in the figure which implies that the increase of the average mass with energy is compatible with subsequent breaks in the energy spectra of individual elements, starting with the lightest species. The experimental values are compared to astrophysical models for the origin of the knee in the figure. The top panel shows models which explain the knee due to the maximum energy achieved during the acceleration process. In the lower panel predictions from propagation models (including reacceleration during propagation) are compiled. Details of the individual models will be discussed below. In general, all these predictions indicate an increase of the mean mass as function of energy very similar to the measured values.
Another technique to determine the mass of cosmic rays is to measure the average depth of the shower maximum (). The results of several experiments are presented in Fig. 10. It depicts the measured values as function of energy. Two different techniques are used in the measurements, namely the imaging technique, using telescopes to obtain a direct image of the shower using Čerenkov or fluorescence light and the light-integrating method, in which the height of the shower maximum is derived from the lateral distribution of the Čerenkov light measured at ground level. The DICE, Fly’s Eye, and HiRes experiments use the imaging method, while all other experiments belong to the second group. The Haverah Park experiment uses the rise time of the shower front to estimate . The data in Fig. 10 show systematic differences of g/cm2 at 1 PeV increasing to g/cm2 close to 10 PeV. Some of the experimental uncertainties may be caused by changing atmospheric conditions. The imaging experiments measure a geometrical height which has to be converted into an atmospheric depth. Measuring longitudinal atmospheric profiles during different seasons, Keilhauer et al. (2003) found that the atmospheric overburden for a fixed geometrical height (e.g. 8 km a.s.l.) varies by at least 25 g/cm2. The light-integrating technique is rather indirect, requiring an air shower model to convert the observed lateral distribution into . Application of different codes can explain parts of the discrepancies in . For example, Dickinson et al. (2000) found that using different interaction models in the MOCCA code, viz. the original and the SIBYLL model, the systematic error amounts to g/cm2.
The observed values are compared to predictions of air shower simulations for primary protons and iron nuclei using the program CORSIKA (Heck et al., 1998) with the hadronic interaction model QGSJET 01 (Kalmykov et al., 1997) and a modified version with lower cross sections and larger values for the elasticity of the hadronic interactions (model 3a from Hörandel (2003b)). Both variations of QGSJET are compatible with accelerator measurements within their error boundaries, for details see Hörandel (2003b). In principle, the difference between the two cases illustrated in the figure represents an estimate of the projection of the experimental errors from collider experiments on the average depth of the shower maximum in air showers. At GeV the difference between the two scenarios for primary protons is about half the difference between proton and iron induced showers. This illustrates the significance of the uncertainties of the collider measurements for air shower observables. The lower values for the inelastic proton-air cross section (model 3a) are in good agreement with recent measurements from the HiRes experiment (Belov, 2006; Hörandel, 2006c).

Knowing the average depth of the shower maximum for protons and iron nuclei from simulations, the mean logarithmic mass can be derived in the superposition model of air showers from the measured using . This conversion requires to chose a particular interaction model. The influence of different interaction models on the values obtained is discussed in detail elsewhere (Hörandel, 2003b). Taking the two cases shown in Fig. 10 as solid and dashed lines yields differences in as depicted in Fig. 11. As expected, they grow as function of energy and exceed one unit in at energies above GeV. As mentioned above, these differences are projections of the errors of parameters derived at accelerators on air shower measurements. The average depth of proton showers is more increased as the depth of iron induced cascades (see Fig. 10). Since in the energy region between and GeV the measurements indicate a trend towards a heavier composition, the influence of the modifications on the mean mass are slightly smaller in this region, resulting in the dip in Fig. 11.
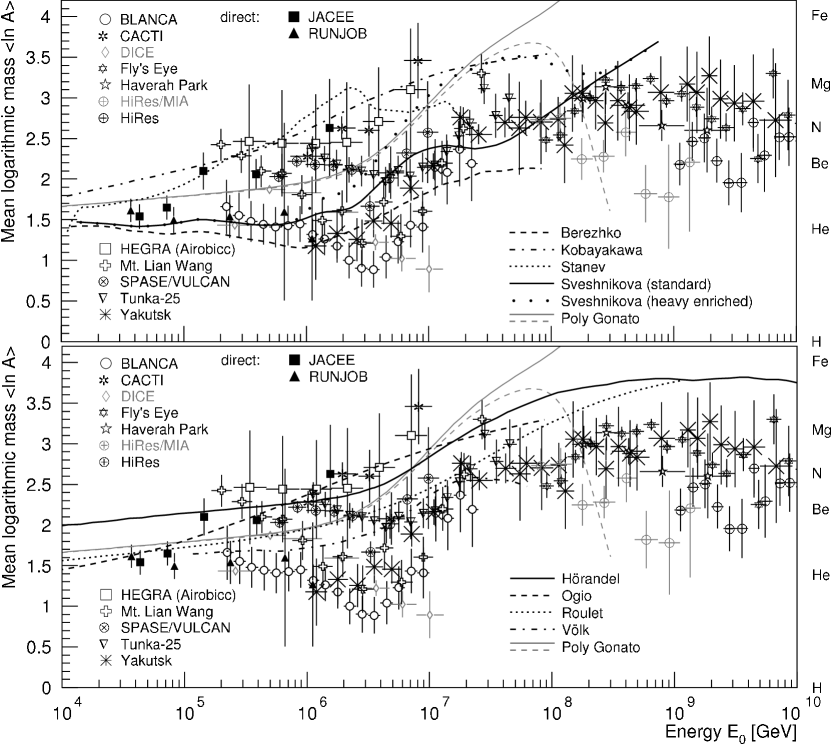
Models: The the grey solid and dashed lines indicate spectra according to the poly-gonato model (Hörandel, 2003a).
Top: The lines indicate spectra for models explaining the knee due to the maximum energy attained during the acceleration process according to Sveshnikova (2003) (—, ), Berezhko and Ksenofontov (1999) (- - -), Stanev et al. (1993) (), Kobayakawa et al. (2002) (--).
Bottom: The lines indicate spectra for models explaining the knee as effect of leakage from the Galaxy during the propagation process according to Hörandel et al. (2007) (—), Ogio and Kakimoto (2003) (- - -), Roulet (2004) (), as well as Völk and Zirakashvili (2003) (--).
Applying the modification of QGSJET 01 (model 3a) to the data shown in Fig. 10 yields values plotted in Fig. 12 as function of energy. According to (1), an uncertainty of about 1 in the determination of yields differences in of about 1 unit. Such a scatter of the experimental values is visible in Fig. 12.
Similar to the results shown in Fig. 9 also the observations of yield an increase of the average mass as function of energy. The same experimental results are shown in the upper and lower panel. The data are compared to astrophysical models proposed to explain the knee due to the maximum energy attained during acceleration (upper panel) and due to leakage from the Galaxy (lower panel). The general trend of the data is seen as well in the models shown. This conclusions, of course, depends on the interaction model used to interpret the measurements.
5.3 Spectra for Individual Elements
A significant step forward in understanding the origin of cosmic rays are measurements of energy spectra for individual elements or at least groups of elements. Up to about a PeV direct measurements have been performed with instruments above the atmosphere (e.g. Wiebel-Soth et al., 1998). As examples, results for primary protons, helium, the CNO group, and iron nuclei are compiled in Figs. 13 and 14. The same experimental data are shown in both figures. They are compared to different models proposed to explain the knee in the energy spectrum as discussed in detail below.
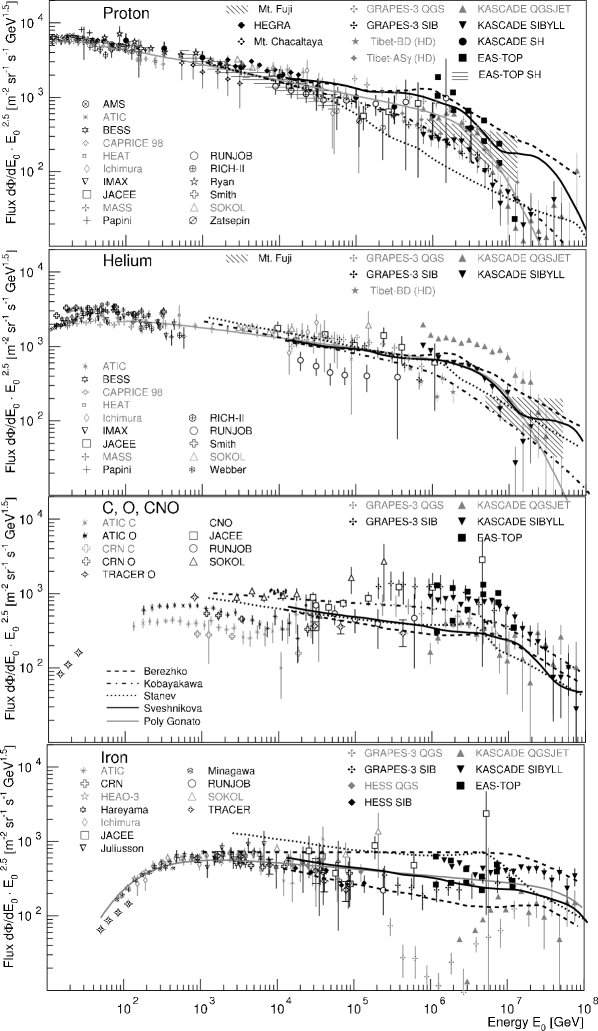
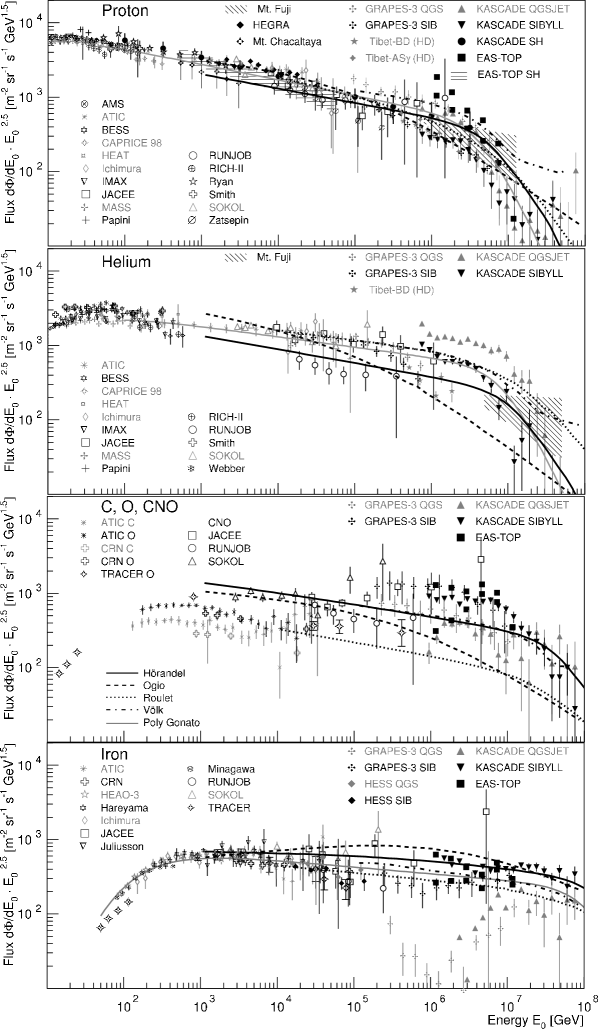
Fig. 13 and 14: Cosmic-ray energy spectra for four groups of
elements, from top to bottom: protons, helium, CNO group, and iron group.
Protons:
Results from direct measurements above the atmosphere by
AMS (Alcaraz et al., 2000),
ATIC (Wefel et al., 2005),
BESS (Sanuki et al., 2000),
CAPRICE (Boezio et al., 2003),
HEAT (Vernois et al., 2001),
Ichimura et al. (1993),
IMAX (Menn et al., 2000),
JACEE (Asakimori et al., 1998),
MASS (Bellotti et al., 1999),
Papini et al. (1993),
RUNJOB (Derbina et al., 2005),
RICH-II (Diehl et al., 2003),
Ryan et al. (1972),
Smith et al. (1973),
SOKOL (Ivanenko et al., 1993),
Zatsepin et al. (1993),
and
fluxes obtained from indirect measurements by
KASCADE electrons and muons for two hadronic interaction models
(Antoni et al., 2005) and single hadrons (Antoni et al., 2004b),
EAS-TOP (electrons and muons) (Navarra et al., 2003) and single hadrons
(Aglietta et al., 2003),
GRAPES-3 interpreted with two hadronic interaction models (Hayashi et al., 2005),
HEGRA (Aharonian et al., 1999),
Mt. Chacaltaya (Inoue et al., 1997),
Mts. Fuji and Kanbala (Huang et al., 2003),
Tibet burst detector (HD) (Amenomori et al., 2000b) and AS (HD)
(Amenomori et al., 2004b).
Helium:
Results from direct measurements above the atmosphere by
ATIC (Wefel et al., 2005),
BESS (Sanuki et al., 2000),
CAPRICE (Boezio et al., 2003),
HEAT (Vernois et al., 2001),
Ichimura et al. (1993),
IMAX (Menn et al., 2000),
JACEE (Asakimori et al., 1998),
MASS (Bellotti et al., 1999),
Papini et al. (1993),
RICH-II (Diehl et al., 2003),
RUNJOB (Derbina et al., 2005),
Smith et al. (1973),
SOKOL (Ivanenko et al., 1993),
Webber et al. (1987),
and
fluxes obtained from indirect measurements by
KASCADE electrons and muons for two hadronic interaction models
(Antoni et al., 2005),
GRAPES-3 interpreted with two hadronic interaction models (Hayashi et al., 2005),
Mts. Fuji and Kanbala (Huang et al., 2003), and
Tibet burst detector (HD) (Amenomori et al., 2000b).
CNO group:
Results from direct measurements above the atmosphere by
ATIC (C+O) (Cherry, 2006),
CRN (C+O) (Müller et al., 1991),
TRACER (O) (Müller et al., 2005),
JACEE (CNO) (JACEE collaboration, 1999),
RUNJOB (CNO) (Derbina et al., 2005),
SOKOL (CNO) (Ivanenko et al., 1993),
and
fluxes obtained from indirect measurements by
KASCADE electrons and muons (Antoni et al., 2005),
GRAPES-3 (Hayashi et al., 2005),
the latter two give results for two hadronic interaction models,
and
EAS-TOP (Navarra et al., 2003).
Iron:
Results from direct measurements above the atmosphere by
ATIC (Cherry, 2006),
CRN (Müller et al., 1991),
HEAO-3 (Engelmann et al., 1985),
Juliusson (1974),
Minagawa (1981),
TRACER (Müller et al., 2005)
(single element resolution) and
Hareyama et al. (1999),
Ichimura et al. (1993),
JACEE (Asakimori et al., 1995),
RUNJOB (Derbina et al., 2005),
SOKOL (Ivanenko et al., 1993)
(iron group),
as well as
fluxes from indirect measurements (iron group) by
EAS-TOP (Navarra et al., 2003),
KASCADE electrons and muons (Antoni et al., 2005),
GRAPES-3 (Hayashi et al., 2005), and
HESS direct Čerenkov light (Aharonian et al., 2007).
The latter three experiments give results according to
interpretations with two hadronic interaction models.
Models:
The the grey solid lines indicate spectra according to the poly-gonato model (Hörandel, 2003a).
Fig. 13:
The lines indicate spectra for models explaining the knee due to the maximum
energy attained during the acceleration process according to
Sveshnikova (2003) (—),
Berezhko and Ksenofontov (1999) (- - -),
Stanev et al. (1993) (), and
Kobayakawa et al. (2002) (--)
Fig. 14:
The lines indicate spectra for models explaining the knee as effect of
leakage from the Galaxy during the propagation process according to
Hörandel et al. (2007) (—),
Ogio and Kakimoto (2003) (- - -),
Roulet (2004) (), as well as
Völk and Zirakashvili (2003) (--).
Recently, also indirect measurements of elemental groups became possible.
A special class of events, the unaccompanied hadrons were investigated by the EAS-TOP and KASCADE experiments (Aglietta et al., 2003; Antoni et al., 2004b). Simulations reveal that these events, where only one hadron is registered in a large calorimeter, are sensitive to the flux of primary protons. The derived proton fluxes agree with the results of direct measurements as can be inferred from Figs. 13 and 14, indicating a reasonably good understanding of the hadronic interactions in the atmosphere for energies below 1 PeV.
At higher energies a breakthrough has been achieved by the KASCADE experiment. Measuring simultaneously the electromagnetic and muonic component of air showers and unfolding the two dimensional shower size distributions, the energy spectra of five elemental groups have been derived (Antoni et al., 2005). In order to estimate the influence of the hadronic interaction models used in the simulations, two models, namely QGSJET 01 and SIBYLL (Engel et al., 1999), have been applied to interpret the measurements. It turns out that the all-particle spectra obtained agree satisfactory well within the statistical errors. For both interpretations the flux of light elements exhibits individual knees. The absolute flux values differ by about a factor of two or three between the different interpretations. However, it is evident that the knee in the all-particle spectrum is caused by a depression of the flux of light elements. The KASCADE results are illustrated in Figs. 13 and 14.
In the figures also results from further air shower experiments are shown: EAS-TOP and GRAPES-3 derived spectra from the simultaneous observation of the electromagnetic and muonic components. HEGRA used an imaging Čerenkov telescope system to measure the primary proton flux (Aharonian et al., 1999). Spectra for protons and helium nuclei are obtained from emulsion chambers exposed at Mts. Fuji and Kanbala (Huang et al., 2003). The Tibet group performs measurements with a burst detector as well as with emulsion chambers and an air shower array (Amenomori et al., 2000b, 2003). The HESS Čerenkov telescope system derived for the first time an energy spectrum measuring direct Čerenkov light (Aharonian et al., 2007). The idea is to register the Čerenkov light of the primary nuclei before the air shower starts (Kieda et al., 2001). Results for iron nuclei are shown.
Despite of the statistical and systematical error of the individual experiments, over the wide energy range depicted, an overall picture emerges: the measurements seem to follow power laws over several decades in energy with a break at high energies. The bends of the spectra at low energies is due to modulation in the heliospheric magnetic fields.
Frequently, the question arises whether the energy spectra of protons and helium have the same spectral index. Due to spallation of nuclei during their propagation and the dependence of the interaction cross section on one would expect a slightly flatter spectrum for helium nuclei as compared to protons. Following Hörandel et al. (2007) the difference should be of the order of . However, a fit to the experimental data yields and (grey lines in Figs. 13 and 14) (Hörandel, 2003a), yielding a diference .
The spectra shown for carbon, oxygen, and the CNO group have a threefold structure in resolution. At the lowest energies, clean spectra could be resolved for carbon and oxygen only (single-element resolution). At intermediate energies, the data represent the CNO group. The ”CNO” group derived from air shower experiments contains probably more elements than just CNO due to the limited resolution in . Thus, there is a slight step in the flux at the transition from direct to indirect measurements.
The results shown for iron are single element spectra (as obtained e.g. by the ATIC, CRN, HEAO-3, and TRACER experiments) as well as iron group data. It may be worth to draw special attention to the behavior of the spectra derived with the model QGSJET from the KASCADE and GRAPES-3 data. Both yield a depression of the flux at GeV. Since both experiments obtain a similar effect there might be some anomaly in the electron muon correlation for QGSJET around 1 PeV. It may be noted as well that for both experiments QGSJET favors a lighter composition with respect to the SIBYLL results (see Fig. 9), i.e. an interpretation of the measured electron-muon distributions with QGSJET yields an increased flux of protons and helium nuclei, while on the other hand, the CNO and iron groups are found to be less abundant in comparison to SIBYLL (see Fig. 13).
For oxygen and iron it should be pointed out that the spectra of the TRACER experiment (with single-element resolution) almost reach the energy range of air shower measurements. It is important to realize that with a next-generation TRACER experiment overlap in energy between direct measurements with single-element resolution and air shower arrays could be reached, which is important for an improvement of the understanding of hadronic interactions in the atmosphere.
The spectra according to the poly-gonato model are indicated in the figures as solid grey lines. It can be recognized that the measured values are compatible with breaks at energies proportional to the nuclear charge PeV.
For the proton component it can be realized that the spectrum exhibits a relatively pronounced knee. The spectral index changes by from at low energies to above the knee. A similarly strong knee is visible for the helium component. For the iron component no clear cut-off is visible yet. An improvement of the situation is expected by the KASCADE-Grande experiment (Navarra et al., 2004), which is expected to unravel the energy spectra for elemental groups up to about eV.
It is of particular interest to compare the measured spectra to various astrophysical scenarios. Spectra for four models, describing the acceleration of cosmic rays in supernova remnants are shown in Fig. 13. In these scenarios the maximum energy attained during the acceleration process is responsible for the knee in the energy spectrum. The models make different assumptions on the properties of supernova remnants and, consequently, yield different spectra at Earth.
The calculations by Berezhko and Ksenofontov (1999) are based on the nonlinear kinetic theory of cosmic-ray acceleration in supernova remnants. The mechanical energy released in a supernova explosion is found in the kinetic energy of the expanding shell of ejected matter. The cosmic-ray acceleration is a very efficient process and more than 20% of this energy is transfered to ionized particles. The resulting spectra at Earth are represented as dashed lines in the figure.
A threefold origin of energetic cosmic rays is proposed by Stanev et al. (1993). In their model particles are accelerated at three different main sites (Biermann, 1993): 1) The explosions of normal supernovae into an approximately homogeneous interstellar medium drive blast waves which can accelerate protons to about GeV. Particles are accelerated continously during the expansion of the spherical shock-wave, with the highest particle energy reached at the end of the Sedov phase. 2) Explosions of stars into their former stellar wind, like that of Wolf Rayet stars, accelerate particles to higher energies. The maximum energy attained depends linearly on the magnetic field and maximum energies GeV for protons and GeV for iron nuclei are reached. 3) For energies exceeding GeV an extragalactic component is introduced by the authors. The hot spots of Fanaroff Riley class II radio galaxies are assumed to produce particles with energies up to GeV. The spectra are indicated as dotted lines in Fig. 13.
A slightly modified version of the diffusive acceleration of particles in supernova remnants is considered by Kobayakawa et al. (2002). Standard first order Fermi acceleration in supernova remnants — with the shock normal being perpendicular to the magnetic field lines — is extended for magnetic fields with arbitrary angles to the velocity of the shock front. The basic idea is that particles are accelerated to larger energies in oblique shocks as compared to parallel shocks. The spectra obtained are plotted as dash dotted lines in the figure.
A usual way to increase is to enlarge the magnetic field , see e.g. the approach by Kobayakawa et al. (2002). On the other hand, as consequence of recent observations also the parameters of the supernova explosion itself can be varied. This is the basic idea of Sveshnikova (2003), to draw up a scenario in which the maximum energy reached in SNR acceleration is in the knee-region of the cosmic-ray spectrum ( PeV), using only the standard model of cosmic-ray acceleration and the latest data on supernovae explosions. Based on recent observations the distribution of explosion energies and their rates of occurrence in the Galaxy are estimated. The observed spectrum in the Galaxy is obtained as sum over all different types of supernova explosions, integrated over the distribution of explosion energies within each supernova group. The corresponding spectra are shown in Fig. 13 as black solid curves. The structures seen in the energy spectra are a consequence of different supernova populations.
Typically, in such models the composition is normalized to direct measurements at energies around to GeV, which explains why the models predict very similar fluxes in this region. On the other hand, approaching the knee, quite some differences are visible. The least pronounced change in the spectrum is obtained in the approach by Stanev et al. (1993), while the most drastic change in the spectra is obtained in the approach by Sveshnikova (2003). The predictions for the mean logarithmic mass of these models are summarized in the upper panels of Figs. 9 and 12.
Examples for a second group of scenarios, in which the knee is caused by leakage of particles out of the Galaxy, are compiled in Fig. 14.
Ogio and Kakimoto (2003) consider a regular magnetic field in the Galaxy following the direction of the spiral arms. In addition, irregularities of roughly the same strength are supposed to exist. It is assumed that the regular and irregular components have about the same field strength G and that both decrease exponentially with a scale hight of 1 kpc. The scale length of the irregularities is estimated to about pc. The spectra obtained are illustrated in Fig. 14 as dashed lines.
Similar to the model discussed previously, Roulet (2004) considers the drift and diffusion of cosmic-ray particles in the regular and irregular components of the galactic magnetic field. Again, a three-component structure of the magnetic field is assumed. The regular component is aligned with the spiral arms, reversing its directions between consecutive arms. This field (with strength ) will cause particles with charge to describe helical trajectories with a Larmor radius . Secondly, a random component is assumed. This will lead to a random walk and diffusion along the magnetic field direction, characterized by a diffusion coefficient . The diffusion orthogonal to the regular magnetic field is typically much slower, however, the energy dependence of is similar to . The third component is the antisymmetric or Hall diffusion, which is associated with the drift of cosmic rays moving across the regular magnetic field. The antisymmetric diffusion coefficient is . For the calculations a source spectrum , with a constant index for all species is assumed. Below the knee, where transverse turbulent diffusion dominates, the observed spectral index will be , while in the drift dominated region above , is obtained. This results in spectra shown in Fig. 14 as dotted curves. The change of the slope for individual components is relatively soft.
A similar approach is followed by Hörandel et al. (2007). This scenario is, as the two models discussed above, based on an idea by Ptuskin et al. (1993). Solutions of a diffusion model are combined with numerically calculated trajectories of particles. While in many models the composition is normalized to values observed at Earth, in this approach the composition at the source is assumed to be equal to the abundance of elements in the solar system weighted with . This choice is arbitrary to a certain extent, but may be motivated by a higher efficiency in the injection or acceleration processes for nuclei with high charge numbers. From the calculations follows a relatively weak dependence of the escape path length on energy , even weaker as the one obtained in the model discussed above (Roulet, 2004). This necessitates relatively steep spectra at the sources . However, taking reacceleration of particles in the Galaxy into account would lead to flatter spectra at the source (Ptuskin, 2006), being again compatible with the standard Fermi picture and the TeV- ray observations. The spectra obtained are represented in Fig. 14 as black solid lines.
Reacceleration of cosmic-ray particles in the galactic wind is discussed by Völk and Zirakashvili (2003). The wind is mainly driven by cosmic rays and hot gas generated in the disk. It reaches supersonic speeds at about 20 kpc above the disk, and is assumed to be very extended (several 100 kpc) before it ends in a termination shock. Due to galactic rotation the differences in flow speed will lead to strong internal wind compressions, bounded by smooth cosmic-ray shocks. These shocks are assumed to reaccelerate the most energetic particles from the disk by about two orders of magnitude in rigidity, ensuring a continuation of the energy spectrum beyond the knee up to the ankle. A fraction of the reaccelerated particles will return to the disk, filling a region around the galactic plane (several tens of kpc thick) rather uniformly and isotropically. A maximum energy eV is obtained and the authors conclude that the knee in the all-particle spectrum cannot be the result of the propagation process, instead it is supposed to be a feature of the source spectrum itself. It is pointed out that it is possible to explain the continuation of the cosmic-ray spectrum above the knee up to the ankle in a natural way, by considering the dynamics of the interstellar medium of the Galaxy and its selfconsistent extension into a large-scale halo by the galactic wind. The authors conclude further that within this picture there is no way to produce higher energy cosmic rays, their sources must be of a different nature.
Comparing the spectra of the different models shown in Fig. 14, it is seen that the approach by Ogio and Kakimoto (2003) yields the weakest change of the spectra in the knee region. More pronounced changes are obtained by Roulet (2004) and Hörandel et al. (2007). The predictions for the mean logarithmic mass of these models are summarized in the lower panels of Figs. 9 and 12. Further models, proposed to explain the knee and their predictions are discussed elsewhere (Hörandel, 2004, 2005).
In general, it may be remarked, that the relatively strong change in the measured spectra (at least for protons and helium) is not reproduced by the theoretical approaches shown in Figs. 13 and 14. It seems to be difficult to reproduced such a relatively pronounced knee as seen in the measurements. Hörandel et al. (2007) tried to model the relatively sharp knee by a combination of the maximum energy attained in the acceleration process and leakage from the Galaxy. This seems to be quite promising, as can be inferred from the figure. This, indeed, maybe a hint that the knee is caused by a combination of two effects, namely, the maximum energy reached during SNR acceleration and leakage from the Galaxy.
6 Transition to Extragalactic Cosmic Rays
All models for the origin of the knee have in common that they predict spectra for individual elements of galactic cosmic rays which exhibit breaks proportional to the charge or mass of each element. This ultimately leads to the fact that above a certain energy no more particles exist. On the other hand, the measured all-particle flux extends up to at least eV, and the highest-energy particles are usually being considered of extragalactic origin. The Larmor radius of a proton with an energy of eV in the galactic magnetic field is kpc, comparable to the diameter of the Galaxy. This emphasizes that such high-energy particles are of extragalactic origin. The transition region from galactic to extragalactic cosmic rays is of particular interest, key features are the origin of the second knee and the ankle.
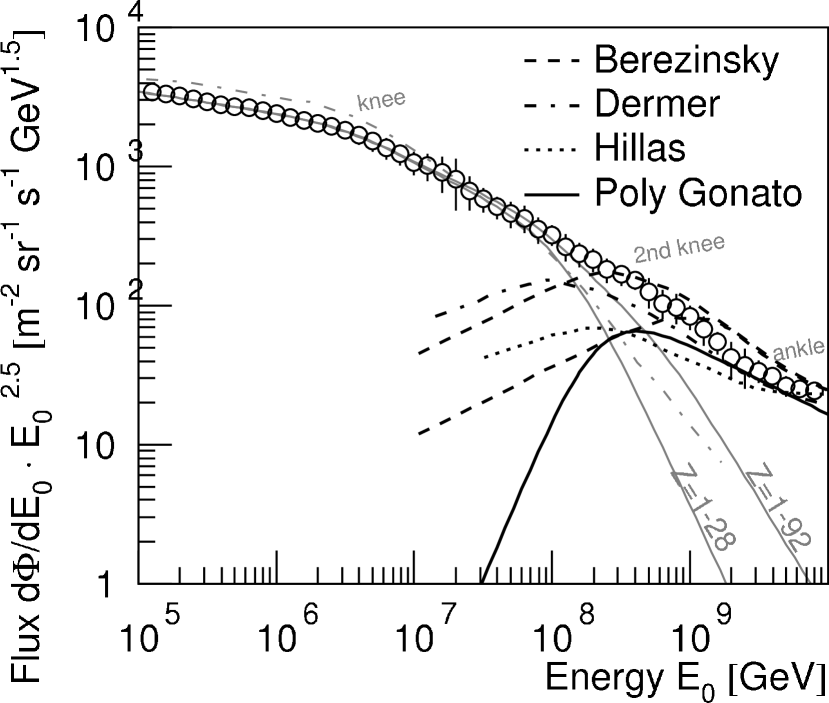
Different scenarios for the transition from galactic to extragalactic cosmic rays are discussed in the literature. Some recent ideas for a possible flux of the extragalactic component are summarized in Fig. 15. In these models a possible contribution of galactic cosmic rays is estimated and subtracted from the observed all-particle flux. The different assumptions on the behavior of the tail of the galactic flux to highest energies yield different estimates for an extragalactic component.
Reviewing the properties of cosmic rays accelerated in supernova remnants, Hillas finds that a conservative estimate of the maximum energy achieved during the acceleration in supernova remnants is not sufficient to explain the all-particle flux up to eV. He introduces a second (galactic) component, accelerated by some type II supernovae, to explain the observed flux at energies above eV (Hillas, 2005). He finds a contribution of extragalactic particles (with mixed composition) as illustrated by the dotted line in Fig. 15.
In the poly-gonato model a significant contribution of ultra-heavy elements (heavier than iron) to the all-particle flux is proposed at energies around 400 PeV (Hörandel, 2003a; Hörandel et al., 2007). In this approach the second knee is caused by the fall-off of the heaviest elements with up to 92. It is remarkable that the second knee occurs at , the latter being the energy of the first knee. The flux of galactic cosmic rays according to the poly-gonato model is shown in Fig. 15 as grey solid lines for elements with (conservative approach) and for all elements (). To explain the observed all-particle flux, assuming a strong contribution of galactic ultra-heavy elements, an extragalactic component, as illustrated by the solid line is required. The galactic and extragalactic contributions according to this scenario are shown as well in Fig. 8 as solid (galactic) and dotted (extragalactic) curves.
The dip seen in the spectrum between and eV, see Fig. 8, is proposed to be caused by electron-positron pair production of cosmic rays on cosmic microwave background photons (Berezinsky, 2005). The flux of galactic cosmic rays is extrapolated from measurements of the KASCADE experiment. Two extreme scenarios are considered by Berezinsky et al. (2004), yielding extreme cases for a possible extragalactic flux, indicated in the figure by two dashed curves.
An alternative scenario is proposed by Atoyan and Dermer (2006). Supposedly, relativistic shocks from a recent ( Myr old) galactic gamma ray burst ( kpc distance to Earth) accelerate galactic cosmic rays up to energies of the second knee. At higher energies extragalactic gamma ray bursts are proposed to sustain the observed all-particle flux. The corresponding galactic and extragalactic components are indicated in the figure as dash dotted grey and black lines.
As seen in Fig. 15 the estimates of the various approaches are quite similar. The extragalactic component reaches its maximum (in this representation) at energies around 100 to 400 PeV with the flux values differing by about a factor of three. The differences are caused by different estimates of the tail of the galactic flux to highest energies.
New measurements of the mass composition in the energy region of the second knee will help to distinguish between the different models.
To reach to energies approaching eV the KASCADE experiment has been enlarged. Covering an area of 0.5 km2, 37 detector stations, containing 10 m2 of plastic scintillators each, have been installed to extend the original KASCADE set-up (Navarra et al., 2004). Regular measurements with this new array and the original KASCADE detectors, forming the KASCADE-Grande experiment, are performed since summer 2003 (Chiavassa et al., 2005). The objective is to reconstruct energy spectra for groups of elements up to eV (Haungs et al., 2006a). First analyses extend the lateral distributions of electrons and muons up to 600 m (Glasstetter et al., 2005; v. Buren et al., 2005). Based on one year of measurements, already energies close to eV are reached.
The Ice Cube/Ice Top experiments are installations presently under construction at the South Pole. Ice Cube is a cubic kilometer scale Čerenkov detector with the main objective to measure very high-energy neutrinos with a threshold of a few 100 GeV (Kestel, 2004). It will consist of 80 strings, each equipped with 60 digital optical modules, deployed in the Antarctic ice at depths of 1450 to 2450 m. The ice Čerenkov detector will also register high-energy muons ( GeV) from air showers in coincidence with a surface array. The latter, the Ice Top experiment, is located on the snow surface above Ice Cube, covering an area of 1 km2. It consists of frozen water tanks, serving as ice Čerenkov detectors to detect the electromagnetic component of air showers. The detectors form an array of 80 detectors on a 125 m triangular grid. It is expected that the installations will be completed in the austral summer 2010/11 and with this set-up air showers up to EeV energies will be investigated.
7 Summary and Outlook
In the last decade substantial progress has been achieved in the understanding of the origin of (galactic) cosmic rays. It has become clear that the knee in the energy spectrum at about 4 PeV is caused by a break in the energy spectra of the light elements and the observed knee is relatively sharp. The mean mass of cosmic rays is found to increase as function of energy in the knee region. The energy spectra for individual elements seem to follow power laws over a wide energy range with breaks at high energies. The position of the breaks are compatible with a rigidity dependent scenario, however, a mass dependent behavior can not be excluded completely. Despite of this progress, the exact astrophysical interpretation of the measured data is limited by the present understanding of hadronic interactions in the atmosphere.
The measurements exhibit qualitative agreement with the ”standard picture”. That means the bulk of galactic cosmic rays is accelerated in shocks of supernova remnants. The particles propagate in a diffusive process through the Galaxy. However, for an exact quantitative description, more detailed models are required. Many contemporary models are very detailed in one aspect (e.g. acceleration), but crude with respect to all other processes (e.g. propagation – and vice versa). One should aim for integrated models, taking into account in detail the injection, acceleration, and propagation of the particles. Most likely, the knee in the energy spectrum is caused by a combination of the maximum energy reached during acceleration and leakage from the Galaxy during propagation. However, at present, some more exotic models cannot be excluded completely.
Within the next decade, new measurements in the energy region around the second knee should be able to clarify the mass composition of cosmic rays in this region. These results are expected to contribute to the understanding of the end of the galactic cosmic-ray spectrum and the transition to extragalactic cosmic rays.
References
- Abbasi et al. (2005) Abbasi, R., et al., 2005. Measurement of the spectrum of UHE cosmic rays by the FADC detector of the HiRes experiment. Astropart. Phys. 23, 157–174.
- Abbasi et al. (2004) Abbasi, R. U., et al., 2004. Measurement of the flux of ultra high energy cosmic rays from monocular observations by the high resolution Fly’s Eye experiment. Phys. Rev. Lett. 92, 151101.
- Abraham et al. (2004) Abraham, J., et al., 2004. Properties and performance of the prototype instrument for the Pierre Auger observatory. Nucl. Instrum. Meth. A523, 50–95.
- Abu-Zayyad et al. (2000) Abu-Zayyad, T., Belov, K., Bird, D., et al., 2000. Evidence for changing of cosmic ray composition between and eV from multicomponent measurements. Phys. Rev. Lett. 84, 4276–4279.
- Abu-Zayyad et al. (2001a) Abu-Zayyad, T., et al., 2001a. Measurement of the cosmic ray energy spectrum and composition from eV to eV using a hybrid fluorescence technique. Astrophys. J. 557, 686–699.
- Aglietta et al. (1999) Aglietta, M., et al., 1999. The EAS size spectrum and the cosmic ray energy spectrum in the region eV - eV. Astropart. Phys. 10, 1–9.
- Aglietta et al. (2003) Aglietta, M., et al., 2003. Measurement of the cosmic ray hadron spectrum up to 30 TeV at mountain altitude: The primary proton spectrum. Astropart. Phys. 19, 329–338.
- Aglietta et al. (2004a) Aglietta, M., et al., 2004a. The cosmic ray primary composition in the ’knee’ region through the EAS electromagnetic and muon measurements at EAS-TOP. Astropart. Phys. 21, 583–596.
- Aglietta et al. (2004b) Aglietta, M., et al., 2004b. The primary cosmic ray composition between eV and eV from extensive air showers electromagnetic and TeV muon data. Astropart. Phys. 20, 641–652.
- Aguirre et al. (2000) Aguirre, C., et al., 2000. Simultaneous observation of families and accompanied air showers at Mt. Chacaltaya. II: Study of hadronic component in air showers. Phys. Rev. D62, 032003.
- Aharonian (2001) Aharonian, F., 2001. Evidence for TeV gamma ray emission from Cassiopeia A. Astron. Astrophys. 370, 112–120.
- Aharonian et al. (1999) Aharonian, F., et al., 1999. The cosmic ray proton spectrum determined with the imaging atmospheric Cherenkov-technique. Phys. Rev. D59, 092003.
- Aharonian et al. (2006) Aharonian, F., et al., 2006. A detailed spectral and morphological study of the gamma- ray supernova remnant RX J1713.7-3946 with HESS. Astron. Astrophys. 449, 223–242.
- Aharonian et al. (2004) Aharonian, F. A., et al., 2004. High-energy particle acceleration in the shell of a supernova remnant. Nature. 432, 75–77.
- Aharonian et al. (2007) Aharonian, F. A., et al., 2007. First ground based measurement of atmospheric Cherenkov light from cosmic rays. astro-ph/0701766.
- Ajima et al. (2000) Ajima, Y., et al., 2000. A superconducting solenoidal spectrometer for a balloon-borne experiment. Nucl. Instrum. Meth. A443, 71–100.
- Alcaraz et al. (2000) Alcaraz, J., et al., 2000. Cosmic protons. Phys. Lett. B490, 27–35.
- Amenomori (2006) Amenomori, M., 2006. Anisotropy and corotation of galactic cosmic rays. Science 314, 439–443.
- Amenomori et al. (2003) Amenomori, M., Ayabe, S., Cui, S., et al., 2003. The energy spectrum of all-particle cosmic rays around the knee region observed with the Tibet air shower array. Proc. 28th Int. Cosmic Ray Conf., Tsukuba 1, 143–146.
- Amenomori et al. (2004a) Amenomori, M., Ayabe, S., Cui, S., et al., 2004a. Observation by an air-shower array in Tibet of the multi-TeV cosmic-ray anisotropy due to terrestrial orbital motion around the sun. Phys. Rev. Lett. 93, 061101.
- Amenomori et al. (2000a) Amenomori, M., et al., 2000a. Measurement of air shower cores to study the cosmic ray composition in the knee energy region. Phys. Rev. D62, 072007.
- Amenomori et al. (2000b) Amenomori, M., et al., 2000b. Primary proton spectrum between 200 TeV and 1000 TeV observed with the Tibet burst detector and air shower array. Phys. Rev. D62, 112002.
- Amenomori et al. (2004b) Amenomori, M., et al., 2004b. Observation by an air-shower array in Tibet of the multi- TeV cosmic-ray anisotropy due to terrestrial orbital motion around the sun. Phys. Rev. Lett. 93, 061101.
- Anchordoqui and Goldberg (2004) Anchordoqui, L., Goldberg, H., 2004. Footprints of super-GZK cosmic rays in the Pilliga state forest. Phys. Lett. B583, 213–221.
- Antoni et al. (2001) Antoni, T., Apel, W., Badea, F., et al., 2001. Electron, muon, and hadron lateral distributions measured in air-showers by the KASCADE experiment. Astropart. Phys. 14, 245–260.
- Antoni et al. (2002) Antoni, T., Apel, W., Badea, F., et al., 2002. A non-parametric approach to infer the energy spectrum and the mass composition of cosmic rays. Astropart. Phys. 16, 245–263.
- Antoni et al. (2003) Antoni, T., Apel, W., Badea, F., et al., 2003. The cosmic ray experiment KASCADE. Nucl. Instrum. Meth. A513, 490–510.
- Antoni et al. (2004a) Antoni, T., Apel, W., Badea, F., et al., 2004a. Large scale cosmic-ray anisotropy with KASCADE. Astrophys. J. 604, 687–692.
- Antoni et al. (2004b) Antoni, T., Apel, W., Badea, F., et al., 2004b. Primary proton spectrum of cosmic rays measured with single hadrons at ground level. Astrophys. J. 612, 914–920.
- Antoni et al. (2005) Antoni, T., Apel, W., Badea, F., et al., 2005. KASCADE measurements of energy spectra for elemental groups of cosmic rays: Results and open problems. Astropart. Phys. 24, 1–25.
- Arqueros et al. (2000) Arqueros, F., et al., 2000. Energy spectrum and chemical composition of cosmic rays between 0.3 PeV and 10 PeV determined from the Cherenkov- light and charged-particle distributions in air showers. Astron. Astrophys. 359, 682–694.
- Asakimori et al. (1995) Asakimori, K., Burnett, T., Cherry, M., et al., 1995. Energy spectra and elemental composition of nuclei above 100 TeV from a series of the JACEE balloon flight. Proc. 24th Int. Cosmic Ray Conf., Rome 2, 707–709.
- Asakimori et al. (1998) Asakimori, K., Burnett, T., Cherry, M., et al., 1998. Cosmic-ray proton and helium spectra: Results from the JACEE experiment. Astrophys. J. 502, 278–283.
- Atoyan and Dermer (2006) Atoyan, A., Dermer, C. D., 2006. High energy cosmic rays from local GRBs. J. Phys. Conf. Ser. 47, 92–101.
- Ave et al. (2003) Ave, M., Knapp, J., Lloyd-Evans, J., Marchesini, M., Watson, A. A., 2003. The energy spectrum of cosmic rays above eV as measured with the Haverah Park array. Astropart. Phys. 19, 47–60.
- Axford et al. (1977) Axford, W., et al., 1977. Proc. 15th Int. Cosmic Ray Conf., Plovdiv 11, 132.
- Baade and Zwicky (1934) Baade, W., Zwicky, F., 1934. Remarks on super-novae and cosmic rays. Phys. Rev. 46, 76–77.
- Bell (1978) Bell, A., 1978. The acceleration of cosmic rays in shock fronts – I. Mon. Not. R. Astr. Soc. 182, 147–156.
- Bellotti et al. (1999) Bellotti, R., et al., 1999. Balloon measurements of cosmic ray muon spectra in the atmosphere along with those of primary protons and helium nuclei over mid-latitude. Phys. Rev. D60, 052002.
- Belov (2006) Belov, K., 2006. p-air cross-section measurement at eV. Nucl. Phys. Proc. Suppl. 151, 197–204.
- Berezhko (1996) Berezhko, E., 1996. Maximum energy of cosmic rays accelerated by supernova shocks. Astropart. Phys. 5, 367–378.
- Berezhko and Ksenofontov (1999) Berezhko, E. G., Ksenofontov, L. T., 1999. Composition of cosmic rays accelerated in supernova remnants. J. Exp. Theor. Phys. 89, 391–403.
- Berezhko et al. (2003) Berezhko, E. G., Puehlhofer, G., Völk, H. J., 2003. Gamma-ray emission from Cassiopeia A produced by accelerated cosmic rays. Astron. Astrophys. 400, 971–980.
- Berezinsky (2005) Berezinsky, V., 2005. Dip in UHECR and transition from galactic to extragalactic cosmic rays. astro-ph/0509069.
- Berezinsky et al. (2004) Berezinsky, V., Grigorieva, S., Hnatyk, B., 2004. Extragalactic UHE proton spectrum and prediction for iron-nuclei flux at GeV. Astropart. Phys. 21, 617–625.
- Bernlöhr et al. (1998) Bernlöhr, K., et al., 1998. Changes of the cosmic-ray mass composition in the eV - eV energy range. Astropart. Phys. 8, 253–264.
- Biermann (1993) Biermann, P., 1993. The cosmic ray spectrum between GeV and GeV. Astron. & Astroph. 271, 649–661.
- Binns et al. (1981) Binns, W., Fickle, R., Garrard, T., et al., 1981. Cosmic-ray abundances of elements with atomic number measured on HEAO-3. Astrophys. J. 247, L115–L118.
- Binns et al. (1989) Binns, W., Garrard, T., Gibner, P., et al., 1989. Abundances of ultraheavy elements in the cosmic radiation: results from HEAO 3. Astrophys. J. 346, 997–1009.
- Blanford and Ostriker (1978) Blanford, R., Ostriker, J., 1978. Particle acceleration by astrophysical shocks. Astrophys. J. 221, L29–L32.
- Boezio et al. (2003) Boezio, M., et al., 2003. The cosmic-ray proton and helium spectra measured with the CAPRICE98 balloon experiment. Astropart. Phys. 19, 583–604.
- Boyle (2006) Boyle, P., 2006. Cosmic ray composition at high energies : The TRACER project. Adv. Space Res., in press.
- Büttner et al. (2003) Büttner, C., Antoni, T., Apel, W., et al., 2003. Muon production height from the muon tracking detector in KASCADE. Proc. 28th Int. Cosmic Ray Conf., Tsukuba 1, 33–36.
- Candia et al. (2003) Candia, J., Mollerach, S., Roulet, E., 2003. Cosmic ray spectrum and anisotropies from the knee to the second knee. J. Cosmol. Astropart. Phys. 5, 3.
- Cha et al. (2001) Cha, M., Cheung, T., Gao, X., et al., 2001. Study of UHE primary cosmic ray composition with atmospheric Cherenkov light observations. Proc. 27th Int. Cosmic Ray Conf., Hamburg 1, 132–133.
- Chernov et al. (2006) Chernov, D., et al., 2006. Primary energy spectrum and mass composition determined with the Tunka EAS Cherenkov array. Int. J. Mod. Phys. A20, 6799–6801.
- Cherry (2006) Cherry, M. L., 2006. Approaching the knee: Balloon-borne observations of cosmic ray composition. J. Phys. Conf. Ser. 47, 31–40.
- Chiavassa et al. (2005) Chiavassa, A., Antoni, T., Apel, W., et al., 2005. Operation, calibration and accuracy of the Grande array of the KASCADE-Grande experiment. Proc. 29th Int. Cosmic Ray Conf., Pune 6, 313–316.
- Compton and Getting (1935) Compton, A., Getting, I., 1935. An apparent effect of galactic rotation on the intensity of cosmic rays. Phys. Rev. 47, 817–821.
- Corbato et al. (1994) Corbato, D. B. S., Dai, H., et al., 1994. The cosmic-ray energy spectrum observed by the Fly’s Eye. Astrophys. J. 424, 491–502.
- Cutler and Groom (1986) Cutler, D., Groom, D., 1986. Observation of terrestrial orbital motion using the cosmic-ray Compton-Getting effect. Nature 322, L434–436.
- Derbina et al. (2005) Derbina, V. A., et al., 2005. Cosmic-ray spectra and composition in the energy range of 10 TeV - 1000 TeV per particle obtained by the RUNJOB experiment. Astrophys. J. 628, L41–L44.
- Dickinson et al. (1999) Dickinson, J., Gill, J., Hinton, J., et al., 1999. Studies of the mass composition of cosmic rays with the SPASE-2/VULCAN instrument at the south pole. Proc. 26th Int. Cosmic Ray Conf., Salt Lake City 3, 136–139.
- Dickinson et al. (2000) Dickinson, J. E., et al., 2000. The new south pole air shower experiment: SPASE-2. Nucl. Instrum. Meth. A440, 95–113.
- Diehl et al. (2003) Diehl, E., Ellithorpe, D., Muller, D., Swordy, S. P., 2003. The energy spectrum of cosmic-ray protons and helium near 100 GeV. Astropart. Phys. 18, 487–500.
- Donelly et al. (1999) Donelly, J., Thompson, A., O’Sullivan, D., et al., 1999. New results on the relative abundance of actinides in the cosmic radiation. Proc. 26th Int. Cosmic Ray Conf., Salt Lake City 3, 109–112.
- Ellison et al. (1998) Ellison, D., Drury, L., Meyer, J.-P., 1998. Cosmic rays from supernova remnants: a brief description of the shock acceleration of gas and dust. Space Sci. Rev. 86, 203–224.
- Engel et al. (1999) Engel, R., Gaisser, T., Lipari, P., et al., 1999. Air shower calculations with the new version of SIBYLL. Proc. 26th Int. Cosmic Ray Conf., Salt Lake City 1, 415–418.
- Engelmann et al. (1990) Engelmann, J., Ferrando, P., Soutoul, A., et al., 1990. Charge comsposition and energy spectra of cosmic-ray nuclei for elements from Be to Ni. results from HEAO-3-C2. Astron. & Astroph. 233, 96–111.
- Engelmann et al. (1985) Engelmann, J., Goret, P., Juliusson, E., et al., 1985. Source spectra of heavy cosmic ray nuclei as derived from the french-danish experiment on HEAO-3. Astron. & Astroph. 148, 12–20.
- Engler et al. (1999) Engler, J., Fessler, F., Hörandel, J., et al., 1999. A warm-liquid calorimeter for cosmic-ray hadrons. Nucl. Instr. & Meth. A 427, 528–542.
- Ferenc (2005) Ferenc, D., 2005. The MAGIC gamma-ray observatory. Nucl. Instrum. Meth. A553, 274–281.
- Fermi (1949) Fermi, E., 1949. On the origin of the cosmic radiation. Phys. Rev. 75, 1169–1174.
- Fomin et al. (1991) Fomin, Y., et al., 1991. Proc. 22nd Int. Cosmic Ray Conf., Dublin 2, 85.
- Fowler et al. (2001) Fowler, J. W., et al., 2001. A measurement of the cosmic ray spectrum and composition at the knee. Astropart. Phys. 15, 49–64.
- Fowler et al. (1977) Fowler, P., Alexandre, C., Clapham, V. M., et al., 1977. High resolution study of nucleonic cosmic rays with . Nucl. Instr. & Meth. 147, 195–199.
- Fowler et al. (1987) Fowler, P., Walker, R., Masheder, M., et al., 1987. ARIEL 6 measurements of the fluxes of ultraheavy cosmic rays. Astrophys. J. 314, 739–746.
- Gahbauer et al. (2004) Gahbauer, F., Hermann, G., Hörandel, J. R., Müller, D., Radu, A. A., 2004. A new measurement of the intensities of the heavy primary cosmic-ray nuclei around 1 TeV amu-1. Astrophys. J. 607, 333–341.
- Gaisser (2005) Gaisser, T., 2005. Outstanding Problems in Particle Astrophysics in Neutrinos and Explosive Events in the Universe. M.M. Shapiro, T. Stanev, J.P. Wefel (eds.) NATO Science Series, Springer, p. 3.
- Garcia-Munoz et al. (1975) Garcia-Munoz, M., Mason, G., Simpson, J., 1975. The cosmic-ray age deduced from the 10Be abundance. Astrophys. J. 201, L141–L144.
- Garzia-Munoz et al. (1987) Garzia-Munoz, M., Simpson, J., Guzik, T., et al., 1987. Cosmic-ray propagation in the Galaxy and in the heliosphere: the path-length distribution at low energy. Astrophys. J. Suppl. Ser. 64, 269–304.
- Glasmacher et al. (1999a) Glasmacher, M. A. K., et al., 1999a. The cosmic ray composition between eV and eV. Astropart. Phys. 12, 1–17.
- Glasmacher et al. (1999b) Glasmacher, M. A. K., et al., 1999b. The cosmic ray energy spectrum between eV and eV. Astropart. Phys. 10, 291–302.
- Glasstetter et al. (2005) Glasstetter, R., Antoni, T., Apel, W., et al., 2005. Shower size reconstruction at KASCADE-Grande. Proc. 29th Int. Cosmic Ray Conf., Pune 6, 293–296.
- Glushkov et al. (2003) Glushkov, A., Egorova, V., Ivanov, A., et al., 2003. Energy spectrum of primary cosmic rays in the energy region of eV by Yakutsk array data. Proc. 28th Int. Cosmic Ray Conf., Tsukuba 1, 389–392.
- Gress et al. (1999) Gress, O. A., et al., 1999. The study of primary cosmic rays energy spectrum and mass composition in the energy range 0.5 PeV to 50 PeV with Tunka EAS Cherenkov array. Nucl. Phys. Proc. Suppl. 75A, 299–301.
- Grigorov et al. (1999) Grigorov, et al., 1999. after Shibata (1999).
- Guillian et al. (2005) Guillian, G., Hosaka, J., Ishihara, K., et al., 2005. Observation of the anisotropy of 10 TeV primary cosmic ray nuclei flux with the Super Kamiokande I detector. preprint astro-ph/0508468.
- Guzik et al. (2004) Guzik, T., et al., 2004. Adv. Space Res., in press.
- Hareyama et al. (1999) Hareyama, M., Ichimura, M., Kamioka, E., et al., 1999. Sub-Fe/Fe ratio obtained by SANRIKU balloon experiment. Proc. 26th Int. Cosmic Ray Conf., Salt Lake City 3, 105–108.
- Haungs et al. (2006a) Haungs, A., Apel, W., Badea, F., et al., 2006a. Investigating the 2nd knee: The KASCADE-Grande experiment. J. Phys. Conf. Ser. 47, 238.
- Haungs et al. (2006b) Haungs, A., Apel, W., Badea, F., et al., 2006b. Investigations of muons in EAS with KASCADE-Grande. Nucl. Phys. B (Proc. Suppl.), in press.
- Hayashi et al. (2005) Hayashi, Y., et al., 2005. GRAPES-3 experiment. Proc. 29th Int. Cosmic Ray Conf., Pune 10, 243–253.
- Heck et al. (1998) Heck, D., Knapp, J., Capdevielle, J., et al., 1998. CORSIKA: a Monte Carlo code to simulate extensive air showers. Report FZKA 6019, Forschungszentrum Karlsruhe.
- Hillas (2005) Hillas, A. M., 2005. Can diffusive shock acceleration in supernova remnants account for high-energy galactic cosmic rays? J. Phys. G31, R95–R131.
- Hinton (2004) Hinton, J. A., 2004. The status of the HESS project. New Astron. Rev. 48, 331–337.
- Hörandel (2003a) Hörandel, J., 2003a. On the knee in the energy spectrum of cosmic rays. Astropart. Phys. 19, 193–220.
- Hörandel (2003b) Hörandel, J., 2003b. On total inelastic cross-sections and the average depth of the maximum of extensive air showers. J. Phys. G29, 2439–2464.
- Hörandel (2004) Hörandel, J., 2004. Models of the knee in the energy spectrum of cosmic rays. Astropart. Phys. 21, 241–265.
- Hörandel (2005) Hörandel, J., 2005. Overview on direct and indirect measurements of cosmic rays: Some thoughts on galactic cosmic rays and the knee. Int. J. Mod. Phys. A20, 6753–6764.
- Hörandel (2006a) Hörandel, J., 2006a. Cosmic-ray abundances and energy spectra at high energies: Measurements with TRACER and KASCADE. Adv. Space Res. 38, 1549–1557.
- Hörandel (2006b) Hörandel, J., 2006b. Cosmic rays from the knee to the second knee: to ev. astro-ph/0611387.
- Hörandel (2006c) Hörandel, J., 2006c. On the mean logarithmic mass of cosmic rays derived from measurements of the average depth of the maximum of extensive air showers. Nucl. Phys. Proc. Suppl. 151, 75–78.
- Hörandel et al. (1999) Hörandel, J., Antoni, T., Apel, W., et al., 1999. First measurement of the knee in the hadronic component of EAS. Proc. 26th Int. Cosmic Ray Conf., Salt Lake City 1, 337–340.
- Hörandel et al. (2007) Hörandel, J., Kalmykov, N. N., Timokhin, A. V., 2007. Propagation of super high-energy cosmic rays in the Galaxy. Astropart. Phys. 27, 119–126.
- Hörandel et al. (1998) Hörandel, J., et al., 1998. Cosmic-ray mass composition in the PeV region determined with the hadronic component of eas. Proc. 16th European Cosmic Ray Symposium, Alcala de Henares, 579–582.
- Huang et al. (2003) Huang, J., Hotta, N., Kasahara, K., et al., 2003. Primary proton spectrum around the knee deduced from the emulsion-chamber data obtained at Mts. Fuji and Kanbala. Astropart. Phys. 18, 637–648.
- Ichimura et al. (1993) Ichimura, M., et al., 1993. Observation of heavy cosmic ray primaries over the wide energy range from approximately 100 GeV / particle to approximately 100 TeV / particle: Is the celebrated ’knee’ actually so prominent? Phys. Rev. D48, 1949–1975.
- Inoue et al. (1997) Inoue, N., Honda, K., Hashimoto, K., et al., 1997. Primary proton spectrum between 1 and 50 TeV observed by hadron detector at 5200 m. Proc. 25th Int. Cosmic Ray Conf., Durban 4, 113–116.
- Ito et al. (1997) Ito, N., Kawakami, S., Hayashi, Y., et al., 1997. The energy spectrum and chemical composition of primary cosmic rays above 100 TeV derived from the size spectrum at Mt. Norikura. Proc. 25th Int. Cosmic Ray Conf., Durban 4, 117–120.
- Ivanenko et al. (1993) Ivanenko, I., Shestoperov, V., Chikova, L., et al., 1993. Energy spectra of cosmic rays above 2 TeV as measured by the SOKOL apparatus. Proc. 23rd Int. Cosmic Ray Conf., Calgary 2, 17–20.
- JACEE collaboration (1999) JACEE collaboration, 1999. after Shibata (1999).
- Jones (2005) Jones, W., 2005. Evolution of scientific research ballooning. Proc. 29th Int. Cosmic Ray Conf., Pune 10, 173–184.
- Juliusson (1974) Juliusson, E., 1974. Charge composition and energy spectra of cosmic-ray nuclei at energies above 20 GeV per nucleon. Astrophys. J. 191, 331–348.
- Kalmykov et al. (1997) Kalmykov, N. N., Ostapchenko, S. S., Pavlov, A. I., 1997. Quark-gluon string model and eas simulation problems at ultra-high energies. Nucl. Phys. Proc. Suppl. 52B, 17–28.
- Kestel (2004) Kestel, M., 2004. Design and status of ICECUBE. Nucl. Instrum. Meth. A535, 139–142.
- Kieda et al. (2001) Kieda, D. B., Swordy, S. P., Wakely, S. P., 2001. A high resolution method for measuring cosmic ray composition beyond 10 TeV. Astropart. Phys. 15, 287–303.
- Knurenko et al. (2001) Knurenko, S., Kolosov, V., Petrov, Z., et al., 2001. Cerenkov radiation of cosmic ray extensive air showers. part 1. lateral distribution in the energy region of eV. Proc. 27th Int. Cosmic Ray Conf., Hamburg 1, 177–179.
- Kobayakawa et al. (2002) Kobayakawa, K., Sato, Y., Samura, T., 2002. Acceleration of particles by oblique shocks and cosmic ray spectra around the knee region. Phys. Rev. D66, 083004.
- Krymsky (1977) Krymsky, G., 1977. Dok. Acad. Nauk USSR 234, 1306.
- Lagage and Cesarsky (1983) Lagage, P., Cesarsky, C., 1983. The maximum energy of cosmic rays accelerated by supernova shocks. Astron. & Astroph. 125, 249–257.
- Lawrence et al. (1999) Lawrence, D., Barbier, L., Beatty, J., et al., 1999. Large-area scintillating-fiber time-of-flight/hodoscope detectors for particle astrophysics experiments. Nucl. Instr. & Meth. A 420, 402–415.
- Lawrence et al. (1991) Lawrence, M., O Reid, R., Watson, A., 1991. The cosmic ray energy spectrum above eV as measured by the Haverah Park array. J. Phys. G: Nucl. Part. Phys. 17, 733–757.
- Lodders (2003) Lodders, K., 2003. Solar system abundances and condensation temperatures of the elements. Astrophys. J. 591, 1220–1247.
- Maier et al. (2005) Maier, G., et al., 2005. Cosmic ray anisotropy with the KASCADE experiment. Int. J. Mod. Phys. A20, 6840–6842.
- Matthews (2005) Matthews, J., 2005. A Heitler model of extensive air showers. Astropart. Phys. 22, 387–397.
- Menn et al. (2000) Menn, M., Hof, M., Reimer, O., et al., 2000. The absolute flux of protons and helium at the top of the atmosphere using IMAX. Astrophys. J. 533, 281–297.
- Meyer et al. (1998) Meyer, J.-P., Drury, L., Ellison, D., 1998. A cosmic-ray composition controlled by volatility and A/Q ratio. SNR shock acceleration of gas and dust. Space Sci. Rev. 86, 179–201.
- Meyer et al. (1997) Meyer, J.-P., Drury, L., Ellison, D. C., 1997. Galactic cosmic rays from supernova remnants. I. A cosmic-ray composition controlled by volatility and mass-to-charge ratio. Astrophys. J. 487, 182–196.
- Minagawa (1981) Minagawa, G., 1981. The abundances and energy spectra of cosmic ray iron and nickel at energies from 1 to 10 GeV per amu. Astrophys. J. 248, 847–855.
- Molnar and Simon (2003) Molnar, A., Simon, M., 2003. A new thought on the energy dependence of the 10Be/9Be ratio. Proc. 28th Int. Cosmic Ray Conf., Tsukuba 4, 1937–1940.
- Müller et al. (2005) Müller, D., Ave, M., Boyle, P., et al., 2005. Measurements with TRACER: Discussion of results and future prospects. Proc. 29th Int. Cosmic Ray Conf., Pune 3, 89–92.
- Müller et al. (1991) Müller, D., Swordy, S., Meyer, P., et al., 1991. Energy spectra and composition of primary cosmic rays. Astrophys. J. 374, 356–365.
- Nagano et al. (1984a) Nagano, M., Hara, T., Hatano, Y., et al., 1984a. Energy spectrum of primary cosmic rays between and eV. J. Phys. G: Nucl. Part. Phys. 10, 1295–1310.
- Nagano et al. (1984b) Nagano, M., Teshima, M., Matsubara, Y., et al., 1984b. Energy spectrum of primary cosmic rays above eV determined from extensive air shower experiments at Akeno. J. Phys. G: Nucl. Part. Phys. 18, 423–442.
- Navarra et al. (2003) Navarra, G., et al., 2003. Study of cosmic ray primaries between and eV from EAS-TOP. Proc. 28th Int. Cosmic Ray Conf., Tsukuba 1, 147–150.
- Navarra et al. (2004) Navarra, G., et al., 2004. KASCADE-Grande: A large acceptance, high-resolution cosmic- ray detector up to eV. Nucl. Instrum. Meth. A518, 207–209.
- Ogio and Kakimoto (2003) Ogio, S., Kakimoto, F., 2003. Advective diffusion propagation model for galactic cosmic rays above eV. Proc. 28th Int. Cosmic Ray Conf., Tsukuba 1, 315–318.
- Ogio et al. (2004) Ogio, S., et al., 2004. The energy spectrum and the chemical composition of primary cosmic rays with energies from eV to eV. Astrophys. J. 612, 268–275.
- Oyama (2006) Oyama, Y., 2006. Anisotropy of the primary cosmic-ray flux in Super- Kamiokande. astro-ph/0605020.
- Paling et al. (1997) Paling, S., Hillas, A., Berley, D., et al., 1997. Results from the CACTI experiment: air-Cherenkov and particle measurements of pev air showers at Los Alamos. Proc. 25th Int. Cosmic Ray Conf., Durban 5, 253–256.
- Papini et al. (1993) Papini, P., Grimani, C., Basini, G., et al., 1993. Observation of proton and helium spectra near solar maximum. Proc. 23rd Int. Cosmic Ray Conf., Calgary 1, 579–582.
- Ptuskin (1997) Ptuskin, V., 1997. Transport of high energy cosmic rays. Adv. Space Res. 19, 697–705.
- Ptuskin (2006) Ptuskin, V., 2006. Cosmic ray transport in the Galaxy. J. Phys. Conf. Ser. 47, 113–119.
- Ptuskin et al. (1993) Ptuskin, V., Rogovaya, S., Zirakashvili, V., et al., 1993. Diffusion and drift of very high energy cosmic rays in galactic magnetic fields. Astron. & Astroph. 268, 726–735.
- Rawlins et al. (2003) Rawlins, K., et al., 2003. Measurement of the cosmic ray composition at the knee with the SPASE-2/AMANDA-B10 detectors. Proc. 28th Int. Cosmic Ray Conf., Tsukuba 1, 173–176.
- Roulet (2004) Roulet, E., 2004. Astroparticle theory: Some new insights into high energy cosmic rays. Int. J. Mod. Phys. A19, 1133–1141.
- Ryan et al. (1972) Ryan, M., Ormes, J., Balasubrahmanyan, V., 1972. Cosmic-ray proton and helium spectra above 50 GeV. Phys. Rev. Lett. 28, 985–988.
- Sanuki et al. (2000) Sanuki, T., et al., 2000. Precise measurement of cosmic-ray proton and helium spectra with the BESS spectrometer. Astrophys. J. 545, 1135.
- Seo et al. (2004) Seo, E., Ahn, H., Beatty, J., et al., 2004. Cosmic-ray energetics and mass (CREAM) balloon project. Adv. Space Res. 33, 1777–1785.
- Shibata (1999) Shibata, T., 1999. Energy spectrum and primary composition from direct measurements. Nucl. Phys. B (Proc. Suppl.) 75, 22–27.
- Shirk and Price (1978) Shirk, E., Price, P., 1978. Charge and energy spectra of cosmic rays with . Astrophys. J. 220, 719–733.
- Simpson (1983) Simpson, J., 1983. Elemental and isotopic composition of the galactic cosmic rays. Ann. Rev. Nucl. Part. Sci. 33, 323–381.
- Simpson et al. (1992) Simpson, J., Anglin, J., Balogh, A., et al., 1992. The Ulysses cosmic ray and solar particle investigation. Astron. & Astroph. Suppl. 92, 365–399.
- Simpson and Garcia-Munoz (1988) Simpson, J., Garcia-Munoz, M., 1988. Cosmic-ray lifetime in the Galaxy: Experimental results and models. Space Sci. Rev. 46, 205–224.
- Smith et al. (1973) Smith, L., Buffington, A., Smoot, G., et al., 1973. A measurement of cosmic-ray rigidity spectra above 5 GV/c of elements from hydrogen to iron. Astrophys. J. 180, 987–1010.
- Sommers et al. (2005) Sommers, P., et al., 2005. First estimate of the primary cosmic ray energy spectrum above 3 EeV from the Pierre Auger observatory. astro-ph/0507150.
- Stanev et al. (1993) Stanev, T., Biermann, P., Gaisser, T., 1993. Cosmic rays IV. the spectrum and chemical composition above GeV. Astron. & Astroph. 274, 902–908.
- Stone et al. (1998) Stone, E., Cohen, C., Cook, W., et al., 1998. The solar isotope spectrometer for the advanced composition explorer. Space Sci. Rev. 86, 357–408.
- Strong and Moskalenko (1999) Strong, A. W., Moskalenko, I. V., 1999. Galactic cosmic rays & gamma rays: a synthesis. astro-ph/9903370.
- Strong and Mattox (1996) Strong, A. W., Mattox, J. R., 1996. Gradient model analysis of EGRET diffuse galactic -ray emission. Astron. Astrophys. 308, L21–L24
- Sveshnikova (2003) Sveshnikova, L. G., 2003. The knee in galactic cosmic ray spectrum and variety in supernovae. Astron. Astrophys. 409, 799–808.
- Swordy (1995) Swordy, S., 1995. Expectations for cosmic ray composition changes in the region to eV. Proc. 24th Int. Cosmic Ray Conf., Rome 2, 697–700.
- Swordy and Kieda (2000) Swordy, S. P., Kieda, D. B., 2000. Elemental composition of cosmic rays near the knee by multiparameter measurements of air showers. Astropart. Phys. 13, 137–150.
- Takeda et al. (2003) Takeda, M., et al., 2003. Energy determination in the Akeno giant air shower array experiment. Astropart. Phys. 19, 447–462.
- Tueller and Israel (1981) Tueller, J., Israel, M., 1981. after Binns et al. (1981).
- v. Buren et al. (2005) v. Buren, J., Antoni, T., Apel, W., et al., 2005. Muon size spectrum measured by KASCADE-Grande. Proc. 29th Int. Cosmic Ray Conf., Pune 6, 301–304.
- Vernois et al. (2001) Vernois, M. D., Beatty, J., Bower, C., et al., 2001. Absolute rigidity spectra of protons and helium from 16 to 260 GV. Proc. 27th Int. Cosmic Ray Conf., Hamburg 5, 1618–1621.
- Völk (2006) Völk, H., 2006. Shell-type supernova remnants. astro-ph/0603502.
- Völk and Berezhko (2006) Völk, H., Berezhko, E., 2006. Theory of cosmic ray production in the supernova remnant RX J1713.7-3946. Astron. & Astroph. 451, 981–990.
- Völk and Zirakashvili (2003) Völk, H., Zirakashvili, V., 2003. Cosmic ray acceleration by spiral shocks in the galactic wind. Proc. 28th Int. Cosmic Ray Conf., Tsukuba 4, 2031–2034.
- Watson (2000) Watson, A., 2000. Ultra-heigh-energy cosmic rays: the experimental situation. Phys. Rep. 333 – 334, 309–327.
- Weaver and Westphal (2001) Weaver, B., Westphal, A., 2001. The extended analysis of the TREK detector. Proc. 27th Int. Cosmic Ray Conf., Hamburg 5, 1720–1723.
- Webber et al. (1987) Webber, W., et al., 1987. Proc. 20th Int. Cosmic Ray Conf., Moscow 1, 325.
- Weekes et al. (2002) Weekes, T. C., et al., 2002. Veritas: The very energetic radiation imaging telescope array system. Astropart. Phys. 17, 221–243.
- Wefel et al. (2005) Wefel, J., Adams, J., Ahn, H., et al., 2005. Energy spectra of H and He from the ATIC-2 experiment. Proc. 29th Int. Cosmic Ray Conf., Pune 3, 105–108.
- Wiebel-Soth et al. (1998) Wiebel-Soth, B., Biermann, P., Meyer, H., 1998. Cosmic rays VII. individual element spectra: prediction and data. Astron. & Astroph. 330, 389–398.
- Wiedenbeck et al. (2003) Wiedenbeck, M., Binns, W., Cummings, A., et al., 2003. Refractory nuclides in the cosmic-ray source. Proc. 28th Int. Cosmic Ray Conf., Tsukuba 4, 1899–1902.
- Wiedenbeck et al. (1999) Wiedenbeck, M., et al., 1999. Constraints on the time delay between nucleosynthesis and cosmic-ray acceleration from observations of 59Ni and 59Co. Astrophys. J. 523, L61–L64.
- Yanasak et al. (2001) Yanasak, N., Wiedenbeck, M., Mewaldt, R., et al., 2001. Measurement of the secondary radionuclides 10Be, 26Al, 36Cl, 54Mn, and 14C and implications for the galactic cosmic-ray age. Astrophys. J. 563, 768–792.
- Zatsepin et al. (1993) Zatsepin, V., Zamchalova, E., Varkovitskaya, A., et al., 1993. Energy spectra of primary protons and other nuclei in energy region 10 - 100 TeV/nucleus. Proc. 23rd Int. Cosmic Ray Conf., Calgary 2, 13–16.