Energy distribution of individual quasars from far-UV to X-rays: I. Intrinsic UV hardness and dust opacities
Abstract
Using Chandra and HST archival data, we have studied the individual Spectral Energy Distribution (sed) of 11 quasars. redshifts . All UV spectra show a spectral break around 1100 Å. 5 X-ray spectra show the presence of a “soft excess” and 7 spectra showed an intrinsic absorption. We found that for most quasars a simple extrapolation of the far-UV powerlaw into the X-ray domain generally lies below the X-ray data and that the big blue bump and the soft X-ray excess do not share a common physical origin. We explore the issue of whether the observed sed might be dust absorbed in the far and near-UV. We fit the UV break, assuming a powerlaw that is absorbed by cubic nanodiamond dust grains. We then explore the possibility of a universal sed (with a unique spectral index) by including further absorption from SMC-like extinction. Using this approach, satisfactory fits to the spectra can be obtained. The hydrogen column densities required by either nanodiamonds or amorphous dust models are all consistent, except for one object, with the columns deduced by our X-ray analysis, provided that the C depletion is . Because dust absorption implies a flux recovery in the extreme UV (Å), our modeling opens the possibility that the intrinsic quasar sed is much harder and more luminous in the extreme UV than inferred from the near-UV data, as required by photoionization models of the broad emission line region. We conclude that the intrinsic UV sed must undergo a sharp turn-over before the X-ray domain.
1 Introduction
The spectra of quasars and Seyfert galaxies show strong emission lines superimposed onto a bright continuum. The continuum contains a significant feature in the optical-ultraviolet region, known as “the Big Blue Bump” (BBB). The emission lines are generally believed to result from photoionization, in which the far-UV part of the BBB is reprocessed into line emission. The shape of the (ionizing) continuum in the far-UV domain is therefore crucial in the modeling of the observed intensities of the emission lines. The continuum of Active Galactic Nuclei (AGN) is furthermore believed to be responsible for the ionization of gas components observed in absorption, either within the AGN environment, the so-called “warm absorbers” (WA) (e.g. Mathur et al., 1994b), or within intergalactic space (e.g. Ly forest and Lyman limit systems). Due to the huge photoelectric opacity of the Galaxy, the Spectral Energy Distribution (sed) of the ionizing continuum, between the Lyman limit and the soft X-rays (EUV-X), is poorly known. Fortunately, owing to the redshift effect and the transparency of the quasar environment, it has been possible to infer the sed of quasars down to Å. From the X-ray side, the quasar sed becomes visible again. The physical relationship between the soft X-rays and the BBB is still a matter of debate (Wilkes, 2004).
Using the same HST-FOS database as Telfer et al. (2002, TZ02), we present a detailed study of eleven quasars for which a good quality far-UV spectra exist as well as archived Chandra ACIS-S data. Our objective in this is to set constraints on the sed behavior in the unknown spectral domain between the UV and the X-rays. Any information about this spectral region, even if indirectly gathered, could improve our understanding of accretion disk physics as well as of the physical conditions of the broad emission line region (BELR) and warm absorbers.
We now briefly review the salient points on what is known about quasar sed, in the near and far-UV as well as in the X-ray domain. We will explore a novel role for dust in the paradigm that the BBB is produced by an accretion disk.
1.1 The far-UV photon crisis
Satellite and ground-based observations of distant quasars showed that the BBB peaks in around Å (rest-frame) (Obrien et al., 1988; Francis et al., 1991; Zheng et al., 1997, hereafter Z97). To characterize the general trends of the continuum shape, various authors co-added spectra from samples of quasars at different redshifts. In Fig. 1 we plot the Sloan Digital Sky Survey (SDSS) composite sed (gray continuous line) constructed by Vanden Berk et al. (2001), using 2200 AGN spectra of redshifts between 0.044 and 4.8. TZ02 showed that the sharp turnover shortward of Å is mostly due to the cumulative effect of unresolved intergalactic Ly forest absorbers, which results in the so-called Lyman valley trough (Moller & Jakobsen, 1990). To correct this absorption, TZ02 (and previously Z97) applied a statistical correction to each spectrum before averaging them. The resulting composite, represented by the red continuous line in Fig. 1, consists of 332 HST-FOS archived spectra of 184 quasars with redshifts between 0.33 and 3.6. In this case, the resulting sed extends into the far-UV, as one would expect if this continuum was responsible for the photoionization of the BELR. A significant break occurs around 1100 Å, followed by a steep flux decrease in the far-UV, equivalent to (). Korista et al. (1997b) pointed out the difficulties in reproducing the equivalent widths of the high ionization lines of He ii 1640, C iv1549 and O vi1035, using a powerlaw as soft as . Note that the TZ02 composite with is somewhat harder than assumed by the aforementioned authors.
A puzzling aspect is the significant variation in the hardness of the far-UV continuum among different quasars. Many quasar spectra reveal an sed significantly steeper than the composite, yet there is little evidence that the emission lines are very different in those objects. For instance, the most extreme case is Ton 34, which shows an ultrasteep continuum but a near-UV line spectrum not very different from other quasars (Binette & Krongold, 2007, hereafter BK07). Binette et al. (2005, B05) proposed that crystalline carbon dust, that is, nanodiamonds111B05 combined two flavors of nanodiamonds, meteoritic (i.e. surface-hydrogenated) and cubic (without surface adsorbates), assuming the small size regime. The resulting extinction curves A1 and D1 are reproduced in Fig. 6., might be responsible for the 1100 Å break, opening the possibility that a rise in flux may take place at energies higher than 20 eV. According to this hypothesis, the absorption trough would indent the continuum only within a relatively narrow spectral region, between 10 and 15 eV, followed by a flux rise at higher energies. Hence, such absorbed sed would still produce more photons in the extreme UV beyond 20 eV than obtained by extrapolating the TZ02 composite. Examples of seds absorbed by nanodiamond dust are represented by the two dotted lines in Fig. 1, corresponding to Models I and II, both defined in § 6. The suggestion that AGN may be a “factory” of dust (Elvis et al., 2002) or nanodiamonds is not new (Rouan et al., 2004a, b).
Korista et al. (1997b) speculated that there could be a second bump peaking near 54 eV that would provide the necessary hard photon luminosity. In any event, state-of-the art photoionization calculations of the BELR show a preference for a much harder ionizing sed compared to what is commonly observed in quasars. To illustrate this, in Fig. 1 we show two distributions used by Korista et al. (1997a, KO97) in their extensive grid of BELR models: the short and long-dashed cyan lines correspond to an exponential cut-off sed of the type , with and 86 eV, respectively. The Locally Optimally emitting Cloud model of Baldwin et al. (1995) and, more recently, of Casebeer et al. (2006) use a similar sed222Although Casebeer et al. (2006) find evidence of a very hard sed in RE 1034+39, they also report that ”the slope appears to become flatter in the FUSE spectrum” shortward of O vi, which they qualify as ”an unexplained feature” that is left out of their analysis.. Also shown in the same figure is the popular quasar sed of Mathews & Ferland (1987) (yellow dashed line). This inconsistency between the sed preferred in photoionization calculations and the sed actually observed in most quasars is unfortunate and requires a solution.
An additional aspect to be taken into account is that nearby, less luminous AGN might possess an intrinsically harder sed, as reported by Scott et al. (2004), who used FUSE data to construct a composite sed comprising AGN of redshifts . These authors did not find evidence of a UV-break, at least for an important fraction of their objects. The 11 quasars reported in this paper, however, are consistent with the presence of a break. As in B05, our analysis will focus on individual spectra rather than on composites.
1.2 Constraints provided by the X-ray domain
Since the X-ray domain undergoes limited absorption as compared to the Lyman continuum, it provides us with constraints on how the BBB might behave in the unobservable extreme-UV domain. This unknown domain is depicted by the shaded area in Fig. 1. Past studies (e.g. Reeves & Turner, 2000, and references therein) revealed that the typical spectrum of a quasar in the hard X-ray band ( keV) is dominated by a powerlaw-like emission flux of index . It has also been found that a gradual upturn occurs below 2 keV, the so-called X-ray soft excess (Comastri et al., 1992). The latest generation of X-ray satellites (XMM-Newton and Chandra), owing to their improved spectral resolution and sensitivity, confirmed the ubiquity of this excess (e.g. Gambill et al., 2003; Porquet et al., 2004; Piconcelli et al., 2005, hereafter PI05). However, its nature as well as its relationship with the BBB are still a matter of debate.
1.2.1 The broken powerlaw X-ray model
Considering a sample of 23 low redshift quasars [the Laor et al. (1997) subsample of PG quasars] observed with XMM-Newton, Brocksopp et al. (2006) favored a broken powerlaw model to fit both the soft energy excess and the harder X-ray segment. They found that the two indices used in their models are well correlated, and they concluded that the X-ray components in the range 0.3–10 keV shared a common origin. These authors also reported that accretion disk parameters responsible for the UV BBB appeared to be independent of the 0.3 keV excess.
We averaged the broken powerlaw fits to 13 AGN () that Brocksopp et al. (2006) reported as ‘good fits’ (see their Table 8). Such average is represented by the two navy blue lines in Fig 1. Each line illustrates a predefined value333Negative indices imply decreasing flux from the UV to the X-rays. of the index ( and ). The flux from the TZ02 composite444Using the observed composite flux rather than that of a continuum model is preferable since it includes the contribution from the ‘small bump’ around 2700 Å, which is believed to be due to unresolved multiplet Fe ii emission (Wills et al., 1985; Yip et al., 2004). at Å was used to determine this index. Laor et al. (1997) and TZ02 suggested that the soft excess might correspond to an extension of the BBB far-UV powerlaw into the X-rays. Our Model II in Fig. 1, for instance, would connect smoothly with the soft excess if extrapolated beyond the shaded area. Although a tempting proposition, we should beware of general conclusions derived from composite seds. A detailed analysis centered on individual quasar seds leads us to reject the above premiss in § 4.
The sed behavior within the data gap (the shaded area in Fig. 1) is not known a priori. In order to establish useful constraints on the different BBB models, we will extrapolate the UV models across this gap and compare them with the X-ray observations.
1.2.2 A thermal model for the X-ray excess
Using a larger subset of 40 PG (Palomar-Green) quasars, PI05 fit five different models to the soft X-rays: either one or two blackbodies (A, E), a multicolor blackbody (B), a bremsstrahlung emission model (C), and a powerlaw (D). Except for one object, all these models require the addition of an underlying powerlaw in order to fit the high energy band. Models A or E were favored for 19 objects, while model D was favored for 6 objects only. The soft excess in some cases shows a top-hat behavior, which favors a thermal interpretation. The green line in Fig. 1 represents an average of 13 model fits (blackbody+powerlaw) of quasars with and of type A and E, using parameters of Table 5 from PI05. This average sed has been arbitrarily scaled to an of , and the mean blackbody temperature describing the excess is eV. PI05 emphasize that the five functional forms they used must be considered as phenomenological and not as physically consistent models.
A well resolved rollover (i.e. decreasing flux towards the UV) of the soft X-ray component, or at least a strong curvature, has also been reported in Ark 120 (Vaughan et al., 2004), Mrk 359 (O’Brien et al., 2001) and NGC 4052 (Collinge et al., 2001). In a similar fashion to PI05, we adopt in this Paper a single blackbody to fit the soft X-ray excess.
1.3 The physical origin of the BBB
Traditionally, the BBB has been interpreted as a manifestation of accretion disk emission (Shields et al., 1998; Malkan, 1983; Edelson & Malkan, 1986) around a supermassive blackhole (BH). The presence of a BH in the nucleus of all grand design galaxies has since been confirmed (e.g. Ferrarese & Merritt, 2000, and references therein). A persisting difficulty, however, is that in the region of the far-UV break, the BBB is not fitted well by ‘bare’ accretion disk models. This is illustrated by a comparison of the composite sed from Z97 with state-of-the-art disk models such as those of Hubeny et al. (2000) (c.f. their Fig. 22), which include H and He opacities and non-LTE transfer. A solution proposed by Z97 and Shang et al. (2005, SBG05) is the comptonization of the disk emission by a hot corona above the disk. This corona would smear the intrinsic disk features such as the Lyman break and result in a sed with a powerlaw tail in the far-UV. Hence accretion disks do not necessarily imply a sharp thermal cut-off, as predicted by bare disk emission models.
For a given sed optical flux, the efficiency in generating ionizing photons is higher for hotter accretion disks, and these imply a fairly hard continuum in the near-UV, with indices . The TZ02 and the Scott et al. (2004) composites, on the other hand, reveal a much softer continuum with a mean index of and , respectively. In this Paper, we explore whether dust might be at the origin of this apparent sed softness in the near-UV. Following the results of Hopkins et al. (2004), who finds evidence of extinction in AGN similar to that encountered in the Small Magellanic Cloud (SMC), we will be considering such extinction in § 6 to deredden the observed seds until they match a target spectral index.
As for the X-rays, a popular physical scenario for the hard X-ray (keV) component is that of a hot corona placed above the accretion disk, which comptonizes the UV to soft X-ray thermal emission from the disk and up-scatters it into the hard X-ray band (Haardt & Maraschi, 1991). On the other hand there are many competing physical mechanisms that have been proposed to explain the soft excess. They are reviewed in PI05, Brocksopp et al. (2006) and Porquet et al. (2004).
1.4 Objectives of this work
The issues that will be tackled in this Paper are the following: using individual spectra rather than composites, we analyze to what extent the extrapolation of the far-UV results in an X-ray flux compatible with Chandra observations. In the event that the UV break was the result of crystalline dust absorption, we wish to know whether the rollover proposed by B05 at 18.5 eV, followed by a powerlaw tail in the extreme-UV, is compatible with the observed X-ray flux. Is this powerlaw tail an acceptable function? Or is a thermal cut-off more natural? Is SMC-type dust able to account for the observed wide range in near-UV spectral indices? Are the columns of material implied by all the dust components compatible with the intrinsic absorption column inferred from the X-rays? What is the impact of the dust-absorbed seds studied in this Paper on the emission spectrum of the Narrow Line Region (NLR)? The framework that we introduce to explore these issues should be useful for follow up studies concerned with the far-UV spectral gap in AGN seds.
2 The observational dataset
In this Paper, we study 11 quasars for which high quality spectral data sets exist in both the HST-FOS and the Chandra archives. Of these, 9 are radio-loud quasars (RLQ) and 2 radio-quiet quasars (RQQ). The larger fraction of RLQs is due to small number statistics of quasars common to both databases. In Table 1, we list the object names (Col. 1) in order of decreasing X-ray counts. The italic letter shown in Col. 2 is used for identification throughout the Paper and in all figures. Other table entries are the redshift (Col. 3), the Galactic H i column density (Dickey & Lockman, 1990) (Col. 4), radio loudness of each source, RQQ vs RLQ (Col. 5), and the UV spectral class according to the nomenclature555Class A spectra show a UV break similar to that seen in the composite sed of TZ02, while class B quasars show a much steeper flux drop shortward of the break (see classification scheme in Fig 2 of B05). of B05 (Col. 6). The X-ray journal of observations is also briefly described and includes the following: the identification number for each source in the Chandra database (Col. 7), the exposure time (ksec) of each observation (Col. 8), the total number of counts for each spectrum (Col. 9), the frame-time information (Col. 10), and Chandra’s observation date (Col. 11). HST’s observation date is also listed (Col. 12).
We have postponed the analysis of the 14 quasars (10 RLQ and 4 RQQ) that showed evidence of a WA in the UV to a future paper, except for 3C351, for which the detailed analysis is presented in Appendix A. Since it is the only object in common with the SBG05 sample, its inclusion is intended to facilitate a comparison of our results with theirs.
2.1 The UV Data
The UV spectra for our sample were extracted from the TZ02 database, which R. C. Telfer was kind enough to provide. It comprises spectra, mostly HST-FOS666Note that the TZ02 sample includes 3 HST-STIS and 6 HST-GHRS spectra., of 184 quasars, already reduced, corrected for Galactic dust extinction, de-redshifted and finally rebinned uniformly. Furthermore, the spectra have been corrected by TZ02 for the presence of Lyman limit absorbers (down to ), as well as for the Ly absorption valley (caused by the cumulative absorption from unresolved Ly forest lines, see § 1.1). We selected spectra that possess the following characteristics: an underlying continuum of acceptable S/N (see Col. 3 in Table 2, sufficient spectral coverage above and below the 1100 Å UV break (see Table 2), and the absence of deep absorption lines or similar features from a BALQSO.
The rest-frame UV spectra and their error bars are plotted in vs. in Fig.2. To increase the S/N and to reduce the smearing from undifferentiated high amplitude scatter, these spectra have been rebinned to group together 10 points per resolution element.
2.2 The X-ray Data.
Our sample includes quasars for which Chandra’s observations were carried out with ACIS-S. The corresponding datasets were freely available from the Chandra X-Ray Center777http://chandra.harvard.edu/.
The files were processed using the CIAO software (version 3.0.2) and following the on-line888http://cxc.harvard.edu/ciao/threads/data.html data analysis ‘threads’ provided by the Chandra X-ray Center in order to extract source and background spectra. Redistribution Matrix Files (RMF) and Auxiliary Response Files (ARF) were generated by using the CIAO tools mkrmf and mkarf, respectively.
We estimated whether each source was affected by pile-up (at a level ) using the expression , where TC is the Total Counts, FT is the frame-time and ET is the Exposure-Time of each observation (see Table 1). If , a pile-up correction was carried out. We found that only quasars , , and showed a significant pile-up. For these, the correction was performed by selecting only counts within an annulus centered on the source and defined by radii 0.6–3 arcsec. We took into account that a proper fit requires at least 1000 counts. For all other objects, we used a circle of 3 arcsec radius centered on the source. The selection of this size aperture guarantees that counts due to extended radio-jets, if present, are avoided999We had no means to remove the contribution from the unresolved X-ray jet component close to the nucleus, which is possibly amplified due to Doppler-beaming (Gambill et al., 2003). The X-rays measured in RLQs might therefore be considered upper limits of the nuclear fluxes. as well as counts from weaker nearby sources. This procedure was performed by using either a box or a circle around each non-nuclear X-ray source. For each source, we generated a background spectrum by considering all the counts within an annulus defined by the radii of 10 and 20 arcsec, again centered on the object.
3 Separate model-fitting of the UV and X-ray segments
We use powerlaw segments to characterize the behavior of the energy distribution in the UV and in the X-rays. We performed spectral fitting101010The commands used for the different fits are described in http://cxc.harvard.edu/ciao/ahelp/xs.html of the 11 quasars, using the Sherpa111111http://cxc.harvard.edu/ciao/ahelp/sherpa.html package in CIAO. Each powerlaw segment is expressed by the form in flux space () or by the form in the customary representation. Since most figures are in vs. , we prefer to use the index throughout most of the text. Such an index directly reflects the apparent slopes of the powerlaw segments seen in the figures. We recall that . A few authors prefer to use an index defined in space (), in which case, we have . For the X-rays, the photon index commonly used in the literature is given by (, note sign convention for ).
3.1 Modeling of the ultraviolet region
As in TZ02, we fitted two broken powerlaws, one for the near-UV and the other for the far-UV, of indices and , respectively121212Note that TZ02 used indices, and that . These preliminary fits assume that no intrinsic dust is present. We employ the superscript ‘dfe’ to label quantities related to the ‘dust-free’ fits. The wavelength at which the two broken powerlaws join is defined as .
Spectral fitting was carried out in two different ways: the first technique consisted of fitting a broken powerlaw (bp) to all the line-free continuum regions, leaving out the important emission lines, in a similar fashion as TZ02 and Scott et al. (2004). This masking is equivalent to excluding the following wavelength intervals from the fit: 750–800, 820–850, 900–1095, 1100–1135, 1150–1265, 1380–1420, 1470–1610, 1830–1950, 2700–2880 Å131313Objects e, g, h, i and k required slight modifications of these blackout intervals, c.f. App. A. The second technique consisted of fitting the continuum and the emission lines together, using a line profile consisting of both a narrow and a broad gaussian component. We found good agreement between the spectral indices derived using each of the two techniques, and therefore we consider both reliable. Since we are primarily interested in the continuum rather than in the lines, we adopted the masking technique due to its simplicity. Because the continuum break occurs near 1100 Å, that is, within the 1100–1135 mask or the Ly mask, the determination of was complicated and required an initial eye-ball estimate. The position of was determined from an initial fit that did not consider any masking. We then froze and proceeded to determine new values of and by least-square-fitting within the unmasked regions only. These values are presented in Table 2. The two segments from the best fitted broken powerlaw are superimposed onto the UV spectra in Fig. 2 a–k. The far-UV break near 1100 Å is apparent in each quasar spectrum. The mean break position characterizing our sample is Å, which is significantly redward of the Lyman limit.
The index difference, , gives us a measure of the steepening across the break. The values we determined range from to , with a mean difference value of . The latter is comparable to the mean index difference of and for the RLQ and RQQ of the TZ02 sample, respectively.
3.2 Modeling the X-ray region
To model the intrinsic X-ray continuum of each quasar, the data were first rebinned in such a way that the number of counts in each bin exceeded 20. This had the advantage of preserving the Poisson statistics when fitting Gaussian profiles and of facilitating the statistical handling of the background substraction. The observed continua with their error bars are shown as counts s-1 keV-1 vs. energy (observer-frame) in the top panels of Figs. 3 a–k.
The X-ray spectra were fitted in the observer-frame by models that were folded into the spectral characteristics of the ACIS-S instrument. We initially fitted a simple powerlaw attenuated by Galactic absorption of column . This initial fit was limited to the range 2.5–6 keV (rest-frame), thereby excluding the soft X-ray region and the Fe K line region around 6.4 keV. It did not consider possible absorption by moderate columns of neutral gas (i.e. ) or by larger columns of ionized gas (i.e. ), both intrinsic to the quasar (Krongold et al., 2003). The residuals of this initial fit are presented in the middle subpanels of Figs. 3 a–k.
For almost all the quasars, such a simple model could not provide a satisfactory fit (see Table 3) over the entire energy range (i.e. 0.3–6 keV observer-frame). The middle subpanels show positive as well as negative deviations (with a significance ). Shortward of 2.5 keV, we find either a soft excess or evidence of absorption gas. Longward of 4 keV, there is some evidence of a line emission feature, which might correspond to a fluorescent transition of neutral iron emission from Fe K at 6.4 keV. The next step was to repeat the fit, leaving the spectral index of the powerlaw frozen to the previous value, but now including a blackbody and/or an intrinsic absorber component in order to account for the observed residuals (see middle panels). We left the normalizations of the powerlaw, blackbody and intrinsic absorption free to vary. We can see in the bottom panels a noticeable reduction of the residuals at low energies. Note that the fit to 3C351 (object ) requires a warm absorber component, as shown in App. A-. In this last model and for the 2 quasars and that do not show a clear evidence of soft excess, we used an f-test to determine the level of significance between models with and without a blackbody. The level of confidence is less than , which confirms that including a blackbody component for both quasars provides a better fit.
The continuous line in the top subpanels of Fig. 3 represents the final best-fit multi-component model, while the corresponding residuals are shown in the bottom subpanels of Fig. 3. In the particular case of PG 1115+080, we had to consider a broken powerlaw that joins at 1.69 keV (see note in App. A). Table 3 lists all the parameters of the final model. Uncertainties at a 2–confidence level regarding the power-law index of all quasars were derived, considering only the 2.5–6 keV (rest-frame) range.
To summarize, the inferred X-ray spectral energy distribution of each quasar includes the following components: thermal emission from a blackbody (zbb) for objects a, e, f, g, i, and a Gaussian Profile (g) representing the Fe K line for objects c, g, i, j. Evidence was found for neutral gas absorption (of column ) intrinsic to the 6 objects a, b, d, e, f, h and a WA in the object , while for the remaining 4 objects, we froze the other parameters at their previous best-fit values and calculated an upper limit for based on a confidence level of 2.
4 Combining the UV and X-ray SEDs in the dust-free case
In this Section, we assume the environment of quasar to be dust-free and make use of a broken powerlaw to describe the UV spectrum of each quasar.
4.1 Matching the UV and X-ray components
We used IDL v. 5.5 to combine the UV and X-ray segments. In Fig.4, we overlay in the UV and X-ray model fits to obtain a single tentative description of each sed, as a function of (rest-frame). In order to avoid any clutter due to undifferentiated scatter and overcrowding, the original data from Figs. 3 and 4 have been left out. Arrows near the top of each panel delineates the spectral extent of the original data.
The near- and far-UV powerlaw fits are shown as dashed lines, while the two crossing dotted lines represent a 2 deviation about the best-fits. We recall that the indices (with = + 1) are explicitly listed in each panel and represent the actual slopes141414The conversion from other index definitions such as and is obtained as follows: and . in plots.
As for the X-ray domain, the previous best-fit models are plotted as dashed lines. The associated limit variations, assuming a 2 uncertainty for the parameters used, are represented by dot-dashed lines. These ‘fluxed’ X-ray models represent the intrinsic sed corrected, not only for Galactic absorption (GA) by column , but also for intrinsic absorption by gas column (§ 3.2). A vertical dotted-line denotes the lower energy boundary of the data.
We determined the energy, , of the intercept that occurs when extrapolating both the far-UV and X-ray segments. In Fig. 4, a small circle denotes the position of the intercept. The mean intercept energy for the sample is eV (this average excludes two objects without a defined intercept, as discussed below). The symbol ‘@’ represents the UV break position . We also derived the index, that is, the spectral index of an imaginary powerlaw joining the two flux values at 2500 Å and 2 keV (as denoted by open triangles). This index is given in Table. 4 and in the inset of Fig. 4 (along with and ). Its value ranges between and , with a mean of . The values from samples of QSOs of comparable luminosities tend to fall in the range to (Anderson & Margon, 1987; Avni et al., 1995; Green et al., 1995; Yuan et al., 1998).
4.2 Discussion I: the dust-free case
We now discuss the issue of whether the extrapolation of the far-UV powerlaw leads to a flux level compatible with the one inferred from the X-ray model. There are two relevant cases to consider: A– the extrapolated far-UV flux model lies below or at the level inferred from the extrapolation of the X-ray model, B– the extrapolated far-UV lies above the level inferred from the extrapolation of the fluxed X-ray model. In case A, at a phenomenological level, the extrapolation leads to a congruent result, that is, the extreme-UV flux either vanishes relative to the soft X-ray component or connects smoothly with it, while in case B, we conclude that a simple extrapolation of the UV powerlaw is nonsensical. The far-UV segment in case B objects must instead undergo an abrupt steepening before reaching the X-ray domain. With case A, the extrapolation of the far-UV segment does not lead to inconsistencies with the X-ray data, while it does with case B, unless further steepening occurs in the extreme-UV, possibly in the form of an exponential turn-over.
The statistics are the following: out of 11 quasars, 9 are case A and only 2 case B (b, k). We conclude that the extrapolation of the far-UV powerlaw leads to a flux level compatible with that measured in the X-rays, except for two sources. This does not entail that the continuum in the unobserved region between the far-UV and the X-rays necessarily behaves as the particular functional form considered. The intrinsic sed may still steepen at some unknown intermediate energy (between 40 and 350 eV), before the soft X-ray excess component takes over. Such a possibility is favored in scenarios in which a thermal distribution is believed to provide a more appropriate description of the BBB. Finally, absorption by dust can strongly affect the observed sed in the far-UV. Correcting for such absorption would lead to a different intrinsic sed and its extrapolation may result in a different balance between case A and case B, as is found in § 6.
Quasar variability is a concern, since the observations in the UV and X-rays were not simultaneous. The characteristic amplitude of continuum variability decreases with source luminosity (Pica & Smith, 1983; Trevese et al., 1994; Hook et al., 1994; Hawkins, 1996; Cristiani et al., 1997). It is smaller for quasars than Seyferts. Giveon et al. (1999) found a B band rms variability of 0.14 mag, following a 7 year monitoring campaign of 42 PG quasars of redshift . Even though such amplitude is relatively small, there are clear indications that the amplitude of variations in the far-UV are larger (e.g. Reimers et al., 2005). As for the X-ray domain, it has been shown in general terms that variability anti-correlates with luminosity (Nandra et al., 1997), and our sample consists of high luminosity quasars. For our sample in particular, Gambill et al. (2003) reported no short-term high-amplitude variability for the quasars , , and . As for longer term variability, these authors reported a decrease of a factor over nine years for quasar and a factor decrease over twenty years for quasar . It is conceivable that when the X-ray and UV observations are not concomitant, the distinction between case A and case B for a particular quasar may depend on the temporal limitations of the data. On the other hand, when a reasonably sized sample is considered, flux variations should have a neutral impact on the relative proportion of case A vs. B. We note that the ratio of the extrapolated far-UV model to the observed X-ray flux, both estimated at the long wavelength limit of the X-ray data, exceeds dex for 7 of the 11 quasars. We therefore consider it unlikely that our results of a majority of case A’s could be reverted owing to AGN variability. The possibility that the X-ray continuum is significantly contaminated by an unresolved jet component, however, might have caused real case B’s to be misclassified as case A’s. This potential obstacle cannot be removed without higher spatial resolution and until the issue of the real nature of the soft excess becomes clearer (see Gambill et al., 2003, and references therein).
As an exercise, we compared our results with those of SBG05, who built comprehensive seds of nearby AGN that extend from the IR up to the X-rays. Their X-ray data were taken from the ROSAT ‘All Sky Survey’ and public PSPC observations. Similarly to us, SBG05 fitted a powerlaw to the far-UV segment. They represented the ROSAT data by a simple powerlaw. Among the 16 AGN, for which they had X-ray data, we determined from their Fig. 3 that 6 are case A and 10 are case B. We do not have a simple explanation for the higher frequency of case B’s in the SBG05 sample. One possible explanation is that the soft X-ray excess is not satisfactorily accounted for by a powerlaw alone. We recall that we added a blackbody to the underlying powerlaw for our sample, in order to fit the excess, and that we found a noticeable soft X-ray bump in 5 objects (§ 3). Alternatively, since the SBG05 sample consists of nearby (less luminous) AGN, systematic differences in the energy distribution could exist (see Scott et al., 2004) that would result in a larger proportion of case B’s in SBG05. Interestingly, we have one object in common with the SBG05 sample, 3C351 (labeled ), which according to their Fig. 3 is case B, while it turns out to be case A in our analysis. A thermal bump appears not to be necessary to model this quasar, but we find evidence of a strong WA, which obviously somewhat complicates a direct comparison with SBG05. The WA model included in our fit is described in Appendix A.
If we consider separately the RQQ or the RLQ composite seds from TZ02, they both fall in the case A category. Therefore, regarding the dominance of case As in the dust-free case, composite seds as well as individually analyzed spectra lead to similar conclusions. Case A does not entail, however, that the X-ray and far-UV components share the same physical origin. This was conjectured in previous works (e.g. Puchnarewicz et al., 1996; Laor et al., 1997), in which the soft excess was considered to be the prolongation of the far-UV component observed in the composite sed. The picture that is emerging from recent works rather suggests the opposite. For instance, using XMM-Newton data, Brocksopp et al. (2006) and PI05 argue that the soft X-rays are a distinct component from the BBB (see discussion in § 1.2). Our analysis supports this interpretation, since a large fraction of objects (5/11) presents a differentiated thermal bump in the soft X-rays, and none is found where the soft X-rays behave as the prolongation of the far-UV powerlaw.
5 Combining the UV and X-ray segments in the ‘break-corrected’ case
5.1 Competing explanations for the UV break
The composite sed inferred by TZ02 appears to be too soft to account for the broad emission lines (see § 1.1 and Korista et al., 1997b). We have initiated an ongoing project to explore alternative solutions to this problem, assuming that the far-UV break is more akin to a localized continuum trough, followed by a marked recovery in the extreme UV, which is the energy region responsible for the high excitation emission lines. Various mechanisms that could generate such a trough are summarized by Binette et al. (2007). State-of-the-art calculations of the SED for standard geometrically-thin optically-thick accretion disks do not reproduce the observed break satisfactorily (§ 1.3), but such models assume a stationary disk with a vertical structure supported only by gas and radiation pressure. To our knowledge, no detailed SED calculations assuming a non-stationary disk or with an accelerating wind have been carried out. Absorption by intergalactic H i or intergalactic dust have been discarded by Binette et al. (2003) and B05, respectively. Eastman et al. (1983) proposed that H i absorption by local clouds accelerated up to 0.8 could generate a steepening of the transmitted continuum. In order to reproduce modern data, this model would need to be fine-tuned and extended to the extreme UV where the flux recovery is expected. More recently, B05 have proposed that the break could be the result of absorption by crystalline dust grains local to the quasars.
More work is needed to falsify some of these competing explanations. However, whatever the physical origin of the break, once we can reasonably reproduce its shape, we can explore the possibility of a universal quasar sed, in which the large variations in observed spectral indices are the result of absorption by standard dust models either SMC-like or Galactic. This possibility of a universal sed is pursued in § 6, assuming that the break is due to crystalline carbon dust, as explained in detail in the current section. We will assume that a sed turnover takes place, not at the observed break, but at shorter wavelengths, around 670 Å, as in B05.
5.2 Crystalline dust to model the far-UV break
B05 showed that absorption by a novel dust component made of crystalline carbon (i.e. nanodiamonds) could reproduce the position and detailed shape of the UV break in 50 objects, out of a total sample of 61 quasars with multi-grating spectra extending down to at least 900 Å (rest-frame). An example of such spectrum is that of PG 1148+549 () shown in Fig. 5. An important prediction of B05 is that a flux rise should take place near 700 Å and this rise was observed in HS 1307+4617, PG 1008+1319 and Pks 023204. BK07 recently presented evidence of a far-UV rise in Ton 34, the quasar with the most extreme break known. The gray dashed-line in Fig. 5 illustrates the far-UV rise predicted by the absorption models of B05. We now review specific features of the crystalline dust model.
Turnover in the EUV-X region.
If the UV-break is the manifestation of dust absorption, the intrinsic continuum (once dereddened) cannot rise indefinitely in , as implied by a single index powerlaw. The intrinsic sed must present a turnover before the X-ray domain. The index provides us with loose constraints on such a turnover. Typically, lies in the range to . The radio-loud quasars are X-ray stronger, with an reaching . This index gives us some clues about the drop in flux between the far-UV and the soft X-rays, but not on where exactly the actual turnover takes place.
B05 reported evidence of a rollover of the continuum in the far-UV sed of the well studied high redshift quasars HS 1700+6416 and HE 23474342 (both at ). They parameterized the shallow turnover observed by using the following multiplicative function: , which produces a steepening centered on . is the powerlaw index increase and a form factor. The cut-off can be progressive or sharp, depending on . When the sed is multiplied by this function, an index change () takes place at wavelength . The values inferred from the above two quasars were , Å (18.5 eV) and an induced steepening of magnitude . By incorporating this rollover into their intrinsic powerlaw seds, B05 found a significant improvement in the synthetic simulation of the TZ02 composite. Furthermore, the fit to the far-UV rise observed in four quasars was also improved (B05, BK07). We will test whether this functional form, which behaves as a powerlaw in the unobserved domain, is at least consistent with the X-ray observations. The rationale behind this form, rather than a thermal/exponential rollover, is the same as that proposed by Z97 to model the composite sed, that is, comptonization of the disk emission by a hot corona.
A simplified nanodiamond dust model.
B05 could reproduce the UV break of quasars, using two kinds of crystalline carbon grains: terrestrial cubic and meteoritic. We hereafter adopt a simplified version of that model, based on a single albeit modified extinction curve consisting of terrestrial cubic diamonds only. This new curve D3, shown in Fig 6, differs from the D1 curve of B05 in that the grain size distribution () covers a wider size range of 3–200 Å (instead of 3–25 Å). The main advantage is that a single extinction curve now suffices to model the break without the need of meteoritic grains151515Infrared re-emission by meteoritic nanodiamonds is expected to generate emission bands at 3.43 and 3.53 (Van Kerckhoven et al., 2002; Jones et al., 2004). Using the spectrum of 3C298 as a test-case, de Diego et al. (2007) found no evidence of this emission.. This is shown in Fig. 5, where the extinction by curve D3 provides a satisfactory fit (continuous line) to the sharp break observed in PG 1148+549. In the same figure, the dotted line represents the intrinsic sed adopted for this quasar, which consists of a powerlaw of index , multiplied by the function defined above, which produces a shallow rollover near 670 Å. The new fit assuming model D3 is quite similar to the one obtained by B05 (dashed gray line), who used a combination of extinction curves A1 and D1. All our dust models were computed assuming solar metallicity for carbon (C/H) and full depletion of carbon onto dust (i.e. = 1.0). This choice is purely for convenience, as is not known a priori in AGN. Diffuse Galactic dust is consistent with a fractional depletion of (Whittet, 2003). Uncertainties about will affect comparisons between columns derived from dust absorption and those inferred from the X-rays, as discussion in § 5.3 and § 6.3.2. The dust-to-gas ratio arising from the C dust is (the solar neighborhood value assuming standard ISM extinction is , Whittet, 2003).
Matching the break-corrected UV segment with the X-ray SED.
For each quasar, the column was varied, until the far-UV break could be reproduced as closely as possible. Even though the curve D3 presents a steep decline redward of the cross-section peak (Fig. 6), the extinction is not totally negligible in the near-UV. To preserve a good fit, one needs to slightly increase the index with respect to the value of the dust-free case. Towards the optical domain, however, the extinction by nanodiamonds rapidly becomes negligible.
In Fig. 7, the thick black line represents the intrinsic (dereddened) sed, separately inferred for each quasar. The ‘fluxed’ X-ray models are the same as before and are represented by the green dot-dashed lines. To facilitate comparisons, the dust-free broken powerlaws of Fig. 4 are repeated (red dashed lines). In Table 4 we list the values of the intrinsic index and other quantities related to the break-corrected sed. All the inferred quantities share the same superscript ‘dia’.
5.3 Discussion II: the break-corrected case
After fitting the UV-break with dust-absorbed seds, we find that only 4 out of 11 quasars are case A (a, e, f, g). Therefore, for a majority of objects, the adopted rollover function , with the same as in B05, results in an extrapolated flux that is incompatible with the X-ray data. The possibility that the X-ray continuum is significantly contaminated by an unresolved jet component would simply reinforce this conclusion. Either the rollover must steepen further than assumed above, or a different functional form for the cut-off should be considered, such as an exponential. For each object found to be case B, we determined the steepening, , that would revert it to case A. The values are listed in Col. 8 of Table 4 and correspond only to upper limits, since further reductions of would still result in case A’s. The mean value of determined for the 7 case B’s is , which is significantly steeper than assumed in B05.
In summary, the dominance of case B objects in the break-corrected case indicates that the functional form adopted for the rollover should be revised. Independently of the adopted form, however, the flux recovery in the extreme-UV results in an ionizing photon luminosity that is higher than with the dust-free broken powerlaw discussed in previous § 4, a property further discussed in § 7.
It is interesting to compare the nanodiamond dust columns in Table 5 with the gas columns, , intrinsic to each quasar and inferred from the X-rays (§ 3.2). In the X-ray domain, it makes relatively little difference whether the metals lie in the dust or consist of free atoms, at the spectral resolution provided by Chandra. If the assumed dust screen covers both the X-ray and the UV source, the crystalline dust column should be less or equal to the column of (intrinsic) gas inferred from the X-rays. A comparison of the two columns show that the condition is satisfied for the 7 objects for which has been measured. It is also in agreement with the upper limits of three other quasars (but not with the upper limit from quasar ). Both column estimates rely on opacities computed for the solar metallicity case. Increasing or decreasing all the metals would not affect the column ratio . Reducing carbon depletion below the assumed value of , however, implies proportionally larger columns. We find that a depletion in the range allows the condition to be realized for the 7 objects for which has been measured.
6 Combining the UV and X-ray segments assuming a universal SED
6.1 The relevance of testing dust-reddened SEDs
Photoionization requires a harder UV continuum.
In their comprehensive review of accretion disks as the ultimate source of the AGN optical-UV continuum, Koratkar & Blaes (1999) noted that ‘bare’ accretion disks, which are sufficiently hot to produce a significant fraction of hard ionizing photons, generally have an optical/UV distribution that is too blue with respect to what is observed. These authors pointed out that the problem of disk models, however, does not lie in being able to fit the “red” optical/UV continuum, but rather in how to explain the extreme-UV emission, needed to power the high excitation emission lines (see § 1.1, § 5.1 and Korista et al., 1997b). To our knowledge, there are no bare disk models that solve both problems simultaneously. This is the starting point for an exploration of whether residual dust extinction might be present in almost all luminous quasars, making their sed appear softer than it really is. This would allow the fitting of bluer accretion disk models, which are more efficient in generating a luminous and hard ionizing continuum.
SMC-type dust favored for SDSS AGN.
An interesting result from the extensive studies of AGN from the SDSS by Hopkins et al. (2004) and Richards et al. (2003) is that the optical properties of the dust in AGN, as inferred from optical and UV colors, are more akin to the properties found in the SMC than to the Galaxy161616The extinction curve of Galactic dust is much shallower than that of the SMC and is characterized by a prominent 2175 Å absorption bump, absent from the SMC curve.. The recent simulations of Willott (2005) supports these findings. We adopted the conclusions of Hopkins et al. (2004) and calculated a SMC-type extinction curve that is based on amorphous carbon (AC) dust grains. The model considers the grains to be spherical, with a size distribution within the range of Å. The complex refraction indices are from Rouleau & Martin (1991) for the AC type. We assumed solar metallicity for carbon and, to be definite, full depletion of carbon onto dust (i.e. , see § 5.2). The dust-to-gas ratio arising from AC dust is . We fine-tuned the size range until our curve closely reproduced the shape of the SMC extinction of Pei (1992), but not its normalization, since the grain composition and metallicity are different. The resulting curve is shown as a continuous line in Fig. 6. For comparison purposes, we also show a silicate (MgFeSiO4) grain model (long dashed-line) normalized to solar Si metallicity171717The dust model of Pei (1992) employed silicate grains but required 2–3 times higher Si abundance than available in the SMC interstellar medium. This one reason why we consider more attractive the amorphous carbon grain composition. We chose to normalize our dust models to solar C abundances (C/H) in order to be consistent with the metal content assumed for the opacities (Morrison & McCammon, 1983) used in the X-ray model fitting (§ 3.2)., but with otherwise the same grain size limits as the Pei model (i.e. 50 – 2500 Å). The two curves are similar in shape.
6.2 The hypothesis of a hard energy distribution in the UV
Assuming SMC-type extinction and a universal sed that is harder in the UV than what is directly observed, we proceed to investigate the amount of AC dust required to provide an acceptable fit of each observed sed. We will keep the above nanodiamond dust component, in order to maintain a satisfactory fit to the UV break. More specifically, the working hypotheses behind the proposed test are the following:
-
i –
A pseudo universal index value for . In their study of radio-quiet and radio-loud AGN, Gaskell et al. (2004) found what appears to be a low end cut-off in the distribution of near-UV indices. The hardest indices found corresponded to . This value is quite similar to the optical-to-UV index of the SDSS composite (Vanden Berk et al., 2001). We define our Model I as a powerlaw with such an index (), multiplied by the function , for consistency with previous analysis. Five quasars with a measured index already harder than could not be included in this test and were left out. The sed from Model I is plotted in Fig. 8 (continuous line). The dotted line represents the same sed absorbed by a crystalline dust screen with . We also defined a Model II based on an even harder sed. B05 encountered a non-negligible fraction of quasars with a much harder181818B05 found a mean index for Class A quasars (see footnote 5) of with a dispersion of 0.21. continuum than the limit proposed by Gaskell et al. (2004), some even harder than . Using the SDSS AGN sample, Vanden Berk et al. (2001) derived four composite seds of increasing hardness in the optical-UV. The hardest sed has . We define Model II as a powerlaw with a similarly hard index of , multiplied by function . It is plotted in Fig. 9 (continuous line) along with the popular AGN sed published by Mathews & Ferland (1987). The dotted line represents Model II after absorption by a crystalline dust screen of thickness .
-
ii –
Determination of the AC dust column. Initially, we adopt for each quasar the same column of crystalline dust required to reproduce the break (§ 5) and then determine the additional column of SMC-type dust needed for the fixed sed Model I or II (with either or , respectively) to fit each observed spectrum satisfactorily. For two objects ( and ) and only in the case of Model II, did we find that the fit to the far-UV break was affected when SMC-like extinction was included. For both, a small reduction in crystalline dust column, , restored the quality of the fit blueward of the break. For all the 9 other quasars, the column was frozen to the values inferred from the break-corrected case of § 5.
6.3 Discussion III: SMC-like extinction in quasars
6.3.1 Results from dust absorbed seds
An interesting result is that, for both seds I or II, a combination of AC and crystalline dust provides a fit to the UV spectra as satisfactory as that from a softer sed with nanodiamond dust only. This is illustrated by the three quasars c, f and g in Fig. 10. The dashed lines represent amorphous carbon + crystalline dust extinction, assuming the ‘universal’ Model II sed, while the dotted line represents absorption by crystalline dust only, assuming the sed index that best fit each individual object (Col. 6 of Table 4). The thin long dashed line represents the intrinsic Model II sed (before extinction) for quasar (3C351). Neither dust model (with and without AC dust) results in a perfect fit of the spectra. However, taking into account that the true continuum level beneath the strong emission lines cannot be uniquely defined, we consider that both models, with and without AC dust, are equally successful. The kink around 1770 Å in the AC extinction curve (Fig. 6) results in a noticeable shoulder shortward of 1750 Å in the transmitted flux of 3C454.3. The data are not inconsistent with such a feature. We conclude that accretion disk seds significantly bluer than observed are an enticing possibility.
Since two seds of quite different hardness (I, II) can be fitted by simply varying the amount of AC dust, we conclude that such a procedure does not lead to a unique description of the intrinsic sed. In Cols. 6 and 9 of Table 5, we list the total191919These columns correspond to the sum of the nanodiamond and AC dust columns. absorption columns and required for a proper fit of each quasar spectrum, assuming either the sed Model I or II, respectively. The corresponding color excesses E(BV) due to intrinsic dust are shown in Cols. 7 and 10. We note that our E(BV) values are relatively small, reaching at most 0.085 (object ), and that they are generally smaller than the Galactic values (Col. 3). Nevertheless, such small color excesses strongly affect the far-UV SED, as previously pointed out by Tripp et al. (1994), who used an heuristic extinction curve that resembles the SMC extinction curve to determine upper limits on the reddening of 7 quasars. The Cols. 8 and 11 list the column ratios of the absorbing material with respect to the one determined in the X-ray domain. In Fig. 7, the thick cyan and yellow lines represent the intrinsic (dereddened) sed corresponding to Models I and II, respectively.
SBG05 also explored the possibility of dust extinction by SMC-type dust. They found that the required extinction cannot remove the UV break without introducing a large scale curvature to the dereddened optical-to-UV region. They report that only 2 of their 17 AGN showed unambiguous evidence of dust extinction. In our study, the break is specifically accounted for by crystalline dust absorption. When additional AC extinction is added, it does introduce some curvature, but not to the extent that it rules out AC extinction altogether. Presumably, the amount of AC dust required for our test is less than the amount probed by SBG05.
As for the quasar sample studied by TZ02, the near-UV domain between 1300 and 2000 Å is characterized by a wide range of spectral indices among quasars. The dispersion is as large as 0.57 about the mean value of . It would be interesting to explore whether variations in the extinction by amorphous carbon might not account for most of these variations in sed softness in the TZ02 sample.
In their study of red and reddened quasars from the SDSS, Vanden Berk et al. (2001) derived one composite sed for significantly reddened AGN and four presumably unreddened composites that differ by the hardness of their continuum. These composites are characterized by optical-UV indices () of 0.75, 0.59, 0.46 and 0.24. The above authors did not rule out that dust extinction may have an important role in explaining the observed variations in among their four composites. However, they favor the idea that the differences are produced by changes in the intrinsic continuum, based on evidence of emission-line trends with color.
6.3.2 Requirements on the rollover shape implied by Models I and II
We find that the extrapolation of the Model I sed results in case A in only 3 objects (a, e, f) out of the 6 quasars for which we could carry out the test. In the case of Model II, however, all 11 quasars turned out to be case B. The conclusion therefore is that, while amorphous carbon extinction favors the existence of an intrinsically harder sed, it also points to the need of a steep sed decline in the extreme-UV, much steeper than the one proposed by B05. Alternatively, we may consider an exponential turnover as a more appropriate solution. Since no sharp bend is observed in the spectra of the two quasars HS 1700+6416 (Fechner et al., 2006) and HE 23474342 (Zheng et al., 2004) down to Å, such a sharp turnover can only take place shortward of this value. Since bare accretion disks predict a significant opacity above the ionizing threshold of He+ (e.g. Hubeny et al., 2000), we may reasonably expect the proposed thermal turnover to occur above the He+ edge (Å).
The ratio of the total dust column (crystalline + amorphous) to the column inferred from the X-rays is given in Col. 8 and 11 of Table 5, for Model I and II, respectively. In the case of Model II, this ratio is smaller than unity for the 7 objects with measured absorption columns . For the remaining 4 quasars, we have only upper limits for . Note that each of them lies among the 5 objects with the smallest accumulated photon counts in the X-rays. Only for the object does the lower limit column ratio exceed unity (by a factor of about two). The inferred / ratio can also be viewed as the minimum value of required to equalize both columns. We conclude that, except for the 4 objects with upper limits, the absorption columns due to dust are overall smaller than those inferred from the X-rays, provided the fractional depletion of C is not far from unity. This is consistent with but does not prove necessarily the concept that the same dust+gas component covers both continuum emission domains. Based on a study of BAL quasars, Gallagher & Everett (2007) have recently argued that the gas in the line-of-sight of the (inner) X-ray source is not the same than the one along the line-of-sight to the UV emitting region.
Since the index is sensitive to extinction of the UV-flux at 2500 Å, we might expect that it correlates with the dust column. In Fig. 11, we plot the column versus . There is no evidence of a correlation. Possibly, the intrinsic (dereddened) varies significantly from object to object, which would tend to mask such a correlation. Assuming an intrinsic value of , the continuous line illustrates the expected behavior of with increasing dust column. The slope is quite steep, which indicates that relatively modest variations in should be expected in any case.
7 Comparison of photoionization models for the extended NLR
In order to quantify the differences between Models I and II and the TZ02 composite, we computed photoionization calculations for the extended NLR (hereafter E-NLR). We favor the low-density regime ( ), because the physics of the emission processes and radiation transfer are simpler and because it is unclear to us where to position the BELR with respect to the crystalline dust screen. The context and parameters of the models are described below.
7.1 The E-NLR of radio-galaxies as a comparison reference
The emission lines of the E-NLR, observed in projection on the sky or on the parent galaxy, are well suited for comparison with simple slab models. The reasons are twofold: i- in the case of the permitted lines, there is no need to perform the difficult task of separating the NLR from the BELR component, ii- the gas densities of the emission regions seen in projection (outside the nucleus) are definitely closer to the low-density regime than the nuclear NLR. The latter is supported by the detailed analysis of Ferguson et al. (1997), who compared a wide range of line ratios from Seyfert I galaxies with those predicted by Locally Optimally emitting Cloud (LOC) models of the NLR. Their models are quite successful in reproducing the high-excitation line strengths, the [O iii] temperature and the correlation between line widths and critical density observed in the (unresolved) NLR. As for the E-NLR, the LOC scenario predicts [S ii] densities consistent with the low-density regime beyond pc and is able to reproduce the radial behavior of the [O ii]/[O iii] ratio in the E-NLR of NGC 4151. These results indicate that spatially resolved emission-line components from the nuclear regions should be operating in the low-density regime.
The orientation-dependent unification scenario proposed by Barthel (1989), in which radio-galaxies and radio-loud quasars belong to the same parent population, justifies our proposed comparison of E-NLR calculations with the observations of the extended emission gas from radio-galaxies. This unification scenario has recently gained further support, following the mid and far-infrared comparative studies of FR2’s and QSRs by Haas et al. (2004, 2005), who used samples that encompass a similar redshift and luminosity range for both classes.
We assume photoionization by the nuclear UV source as the main excitation mechanism of the E-NLR. A potential problem is that shock excitation might be contributing significantly to the emission lines (Dopita & Sutherland, 1996; Binette et al., 1985). How to determine the specific contribution from shocks is still an open question. Laor (1998) expressed strong reservations about the overall efficiency of fast shocks in AGN. Best et al. (2000) proposed a scheme to separate the shock-excited case from the photoionized case, which is based on UV line ratios. In their proposed line-ratio diagram, the photoionized E-NLR of radio-galaxies occupy a region characterized by the ratios C iii]/C ii]/ (1909Å/2326Å) and [Ne iii]/[Ne v] (3869Å/3426Å) . In order to provide an observational dataset for the comparison of our calculations, we chose the spectrum from the z2.36 narrow-line radio-galaxy 4C00.54, which satisfies the first criterium (), so as to minimize the contribution from shocks. The line ratios are listed in Col. 3 of Table 6 and the bibliography appears in footnote of the Table. We emphasize that no attempt has been made to vary any of the model parameters in order to fit these ratios. Our main concern, above all, is to compare different seds with one another.
7.2 Which SED to use: absorbed or unabsorbed?
Since all quasars of redshifts found in the TZ02 sample show a far-UV break, and since the nanodiamond dust columns required to fit the break according to B05 cover a narrow range202020The mean dust column derived by B05 for the dominant Class A quasars was , with a dispersion of 0.29., we infer that the covering factor of the dust is quite uniform and near unity, that is, all line-of-sights are absorbed by similar amounts of dust. Hence, the sed to which the NLR of quasars is exposed must display a UV-break as well. For this reason, we will consider energy distributions from Models I and II that have already been absorbed by nanodiamonds (rather than the dereddened form). Regarding the AC dust postulated in § 6, since the observed UV spectral index varies considerably from quasar to quasar (TZ02), we infer that this hypothetical dust component is not uniform and presumably located further away from the ionizing source than the nanodiamond dust. In this case, it is reasonable to expect that the NLR emission will be dominated by gas photoionized by radiation emerging from the line-of-sights that are least absorbed by the AC dust. For this reason, our E-NLR calculations will not consider seds absorbed by AC dust. The adopted energy distributions corresponding to Models I and II are plotted as dotted lines in Figs 8 and 9, respectively, while the sed that approximates the TZ02 composite is represented by the thick short-dashed line in Fig. 8. Both the TZ02 and the Model I seds include an X-ray component consisting of a powerlaw of index , assuming an of .
7.3 Density stratified slabs
The results of the modeling of the NLR in Seyfert I galaxies by Ferguson et al. (1997) suggest that the partially ionized emission zones contain significant amounts of internal dust, while the fully ionized regions contain very little. When the ionization parameter212121The ionization parameter at the face of the slab is defined as , where is the density of ionizing photons impinging on the slab and the total H density at the face of the slab. at the face of the slab, , is high, radiation pressure becomes significant, and even small amounts of dust will lead to an internal density stratification. We therefore allowed our slab model to contain small amounts of amorphous carbon dust, at a level corresponding to 2% only (i.e. ), so as to remain consistent with the Ferguson et al. (1997) results. Dopita et al. (2002); Groves et al. (2004a, b) showed that for high values, the ensuing density stratification result in an emission line spectrum that is relatively insensitive to the particular adopted value. In this case, ceases to be a determinant parameter. This property of stratified models is particularly useful in the context where we are foremost concerned with the comparison of different seds. To be definite, we chose and a slab face density of . Finally, we adopt the set of solar abundances from Anders & Grevesse (1989)
7.4 Comparison of the three SEDs
To compute line ratios, we have used the code mappings ic (Binette et al., 1985; Ferruit et al., 1997) and assumed a slab geometry illuminated on one side. For each ionizing sed that we considered, we calculated the local equilibrium ionization state of the gas and integrated the ionization structure inward until less than 1% of the gas becomes ionized. We integrated the volume force exerted by radiation pressure within the slab, assuming hydrostatic equilibrium as in Dopita et al. (2002) and Binette et al. (1997). Cols 5 and 6 of Table 6 list the calculated line ratios with respect to H from seds corresponding to Model I and II, absorbed by nanodiamond dust, while Col. 4 represents calculations with the TZ02 composite.
Table 6 shows that the high excitation lines are of similar strengths in the case of Model I and of the TZ02 composite. This is due to the similar hardness of both seds, as reflected by the quantity , which is the ratio of ionizing photons above 1 ryd to those above 4 ryd (see values at bottom of table). The sed from Model II is significantly harder, however, which is reflected in the calculated ratios.
For an equal continuum flux near 1100 Å (the onset of the break), the ionizing photon flux, , for Model I and II, is 23% and 52% higher, respectively, than that from the TZ02 composite. These gains are quite modest, however. If, on the other hand, the observed softer index of the composite were due to AC dust absorption (§ 6), the total gain in would be much higher, reaching values of 62% and 270%, respectively (including previous factors). Increasing the turnover energy beyond 54 eV, as suggested in § 6.3.2, would result in an intrinsically harder sed, which would increase the luminosity of the high excitation lines such as He ii 1640, O vi1035 and C iv1549, and further contribute to resolve the softness problem reported by Korista et al. (1997b). By how much the turnover energy should increase would depend on the precise shape adopted for the turnover, a question that lies beyond the scope of the current study.
8 Conclusions
Using archived data from Chandra and HST-FOS, we have derived the UV to X-ray seds of 11 quasars. The aim of our analysis has been to constrain the behavior of the sed within the domain that is not directly observable, in the extreme UV. We explored the possibility that crystalline dust and amorphous carbon dust may account for the surprising softness of quasar seds. More specifically, we have reached the following conclusions:
-
1-
When we fit the observed UV spectra with a broken powerlaw directly (dust-free case), we do not find a single object for which the soft X-rays is the prolongation of the far-UV powerlaw with the same index. In 9 out of 11 quasars, the extrapolated far-UV powerlaw lies at a flux level below or near the one actually observed in the soft X-rays. We find evidence of soft X-ray excess in 5 objects222222These are Pks 112714, B2 0827+24, Pks 1354+19, 3C454.3 and Pks 113613..
-
2-
We simplify the nanodiamond dust absorption model proposed by B05 to reproduce the far-UV break. Instead of using two kinds of crystalline carbon grains (terrestrial cubic and meteoritic), we obtain a similar fit by using a dust model consisting of cubic diamonds only, but where the grain sizes cover a larger range (3–200 Å). If the fractional depletion within the gas is , the dust columns required by nanodiamond dust models are not excessive, as they fall below the cold gas columns inferred from the X-ray data.
-
3-
Assuming that the far-UV break is due to nanodiamond dust absorption, we explored the possibility of a shallow far-UV turnover at 18.5 eV to connect the far-UV with the X-rays, as proposed originally by B05. We find that for most objects the steepening must be more pronounced than proposed by B05, that is, an index change as steep as . Given that two well studied quasars, HS 1700+6416 and HE 23474342, do not show any sharp break down to 250 Å, we also consider that the proposed rollover should take place at a significantly higher energy ( eV) than proposed by B05.
-
4-
We find that adding SMC-type extinction to the extinction from nanodiamond dust leads to a bluer sed and to a fit of the BBB of quality comparable to the one achieved with nanodiamond dust alone. This opens the possibility that the intrinsic quasar sed is much harder and luminous in the near and far-UV than previously considered.
Appendix A Remarks on individual objects
Additional information and special considerations about each quasar are described as follow:
a.- PKS1127-14. The X-ray observation of this quasar does not show pile-up. Siemiginowska et al. (2002) detected for the first time in the X-ray image of this object the presence of jet emission. For the main source they found a photon index = in the spectral region between 2 and 10 keV, consistent with the best-fit value reported in this work within a level of 2 confidence.
b.- PKS0405-123. (Spinrad et al., 1993; Bahcall et al., 1993b) found the presence of a
Ly absorption line in the UV spectrum of this object. They
associated this absorber with the rich cluster of galaxies where
the source is located. After the Lyman limit ( Hz) there is an unusual excess with respect to a simple
powerlaw model. Lee et al. (1995) found that Comptonization of the accretion
disk cannot account for this excess. In our analysis of this source
we created an additional mask between 717882 Å to avoid the
segment covered by this emission (see 3.1). We note,
however, that this does not produce a considerable change in the FUV
index.
The X-ray of this source shows jet emission (removed from
our analysis). The source presented a level of pile-up of 16.7 %.
We corrected the spectrum with the procedure described in
§ 2.2.
c.- 3C 351 . This quasar
shows the presence of C iv and Ly absorption lines (see
Fig. 2 ) with 1700 and 2200 blueshift,
respectively (Bahcall et al., 1993a). Mathur et al. (1994a) and Nicastro et al. (1999)
find, analyzing ROSAT data, the presence of an associated warm
absorber in the X-ray band. This object provided the first
suggestion for a common UV and X-ray absorber.
Using a Chandra observation, Hardcastle et al. (2002) fit the spectrum of
this object with two power laws, attenuated by Galactic and
intrinsic cold absorption. Hardcastle et al. (2002) rejects a model consisting
of ionized absorption that included only bound-free transitions (the
model absori in XSPEC). One of the power laws in their model is
associated with the nuclear quasar emission, while the other is
assumed to be related to the jet emission.
We analyzed the X-ray spectrum of this object using the approach
described in § 2.2. The X-ray observation has % of pile-up. Three X-ray prominent hot spots at 25 arcsec
north-east from the main source were also detected. Those were
excluded from our analysis to avoid contamination while getting the
X–ray spectrum.
The spectrum of this object, showed the presence
of two data points with deviations larger than 2 near 2.5 keV.
We did not included these points from our initial fit between
2.5–6 keV as they would change the measured value of .
Therefore, for this object, we fit only the range 2.51–6 keV. In this
initial fit (that consists of a single powerlaw attenuated by
galactic absorption) we found a spectral index =0.6, consistent
(within 2) with the index reported by Hardcastle et al. (2002). The
extrapolation of this fit to the whole spectral range (0.3 to 6 keV)
showed that the spectrum is not well described with a single
powerlaw. Strong negative residuals between E keV are
present, indicating the possible presence of ionized absorption, as
previously suggested. The residuals further revealed the presence of
an emission line consistent with the Fe K line. We thus fitted the
spectrum with a powerlaw plus a gaussian (to account for the Fe K line) attenuated by both the WA and Galactic absorption. The WA was
modeled using the code PHASE (Krongold et al., 2003) that includes absorption
by both bound-bound and bound-free transitions. A single warm
absorber could not account for the negative residuals, thus the warm
absorber was modeled with two absorption components. This is
consistent with the findings for Seyfert galaxies
(e.g. Krongold et al., 2005b, a). The best fit parameters for our fit
are reported in Table 3. These model (d.o.f./) showed to be better than a model consisting in two power
laws with intrinsic cold absorption (d.o.f./).
Hardcastle et al. (2002) reported the possible presence of an emission feature
near 3.2 keV. We also notice the presence of this feature, and like
Hardcastle et al. (2002) could not constrain its properties with a gaussian
line. As our main interest is to constrain the continuum properties,
no further effort was made in explaining this feature [see
discussion by Hardcastle et al. (2002)].
The above model for this object was carried out in the range between
0.32 to 6 keV. The region between 0.24 and 0.32 keV showed several
data points above of the power-law level that could not be fit by
any model with a reasonable physical meaning. Furthermore, most of
these points are located in the spectral region below 0.3 keV,
where the spectral calibration for Chandra is not accurate.
Therefore these points were excluded from our analysis.
d.- 3C334. This quasar does not present pileup or jet emission in the X-ray domain.
e.- B2 0827+24. The predefined mask in the UV domain (§ 3.1) was modified for this quasar. The spectral region between Ly and O vi1035, i.e., between 900–980 Å was included to obtain a reliable FUV fit. It was also necessary to ignore the following regions: 926.61–974.4, 896.5 897.5, 1090 to 1110, 1140.5 to 1142, 1310 to 1316 and 1440 to 1446 Å due to the presence of absorption lines. Without these modifications to the mask, a harder FUV index () would be obtained in the fits (we report an index of in Table 2). The X-ray observations of this object show the presence of a jet (removed from our analysis), and no pile-up.
f.- Pks 1354+19. Also called 4C 19.44, this source did not presented pile-up in the X-ray spectrum. Jet emission was removed to avoid any source of contamination. Gambill et al. (2003) analyzed the same observation and found variability by a decreasing factor of 3 during 20 years (elapsed between the Chandra and the ROSAT observations). They reported an and photon indices of +1.39 and +1.88 for the hard and the soft spectrum, respectively. We found values consistent with those within a 2 level of confidence.
g.- 3C454.3 An additional mask was introduced in the UV spectrum of this quasar between 877–885 Å, to remove the absorption features present at a level exceeding 2, and arising from the intergalactic medium. The X-ray spectrum presented 24% of pile-up, in spite the object was observed in use of the sub-array 1/4. The object further shows X-ray jet emission.
h.- OI 363 An additional mask was introduced in the range between 801–824 Å of the UV spectrum to remove absorption features that were present at a level exceeding 2, and arising from the intergalactic medium. In the X-ray region, Siemiginowska et al. (2003) reported no pileup. However, with the pileup definition of this work, we found 16.3% of pileup on the same observation. The source presented evidence of jet emission.
i.- Pks 113613 The UV spectrum presented emission lines by He ii and O iii] in the range between 1640–1664 Å. These were removed from the analysis in order to obtain a reliable fit of the continuum. In the X-ray band, the source does not show pile-up, but jet emission was found.
j.- PG 1634+706 The X-ray observation does not present pile-up or jet emission. Page et al. (2004); Piconcelli et al. (2005) analyzed an XMM spectrum of this source between 0.2 and 10 keV and found a photon index consistent with the one reported by us within a level 2 of confidence. Page et al. (2004) further reported the presence of a soft excess, not required by the Chandra data analyzed here.
k.- PG 1115+080 The UV spectrum of this source presents broad
absorption lines. We then modify the UV mask to ignore these
features in the spectral regions 886 to 892, 1097 to 1105, 1138 to
114 and 1147 to 1149 Å. In the case of considering those spectral
ranges a flatter FUV index would be obtained (,
compared to the one reported in Table 2 ).
In the X-ray region, the observation did not show pile-up or jet
emission. We note that in the X-ray band this quasar has two close
sources [sources B and C in Fig. 4 of Young et al. (1981)] due to
gravitational lensing. These two sources were not present in the
slit aperture of the HST-FOS observation. To be consistent with the
UV data, sources B and C were removed from our analysis.
This is the only quasar in our sample
that required a broken powerlaw to fit the data. We first fit a
single powerlaw between 2.5 to 6 keV (rest-frame) absorbed by
Galactic neutral gas, and obtain a spectral index =0.86. However,
the extrapolation of this model above 2 keV resulted in a poor fit
(d.o.f./). The best continuum model resulted from a
fit with a broken powerlaw attenuated by Galactic absorption
(d.o.f./). The best fit parameters for this model
are: (1) an index =0.86 in the E keV range (the
spectral index was not changed from the previous value); (2) an
index in the E keV
range; and (3) an energy-break at E=1.69 keV.
PI05 analyzed an XMM-Newton observation of this source. They used
a single powerlaw and obtained a spectral index = 0.15
(=1.85). The difference in the models arises from that we first
performed the analysis in the soft X-ray region between 0.92 and 2.2
keV, and then extrapolated our model to the whole range of
0.3–6 keV (see § 3.2). This is clear from middle panel
of Fig. 3 k where the residuals show a break
around 2 keV.
References
- Anders & Grevesse (1989) Anders, E., & Grevesse, N. 1989, Geochim. Cosmochim. Acta, 53, 197
- Anderson & Margon (1987) Anderson, S. F., & Margon, B. 1987, ApJ, 314, 111
- Avni et al. (1995) Avni, Y., Worrall, D. M., & Morgan, W. A. 1995, ApJ, 454, 673
- Bahcall et al. (1993a) Bahcall, J. N. et al. 1993a, ApJS, 87, 1
- Bahcall et al. (1993b) Bahcall, J. N., Jannuzi, B. T., Schneider, D. P., & Hartig, G. F. 1993b, ApJ, 405, 491
- Baldwin et al. (1995) Baldwin, J., Ferland, G., Korista, K., & Verner, D. 1995, ApJ, 455, L119+, astro-ph/9510080
- Barthel (1989) Barthel, P. D. 1989, ApJ, 336, 606
- Best et al. (2000) Best, P. N., Röttgering, H. J. A., & Longair, M. S. 2000, MNRAS, 311, 23, astro-ph/9908211
- Binette et al. (1985) Binette, L., Dopita, M. A., & Tuohy, I. R. 1985, ApJ, 297, 476
- Binette et al. (2007) Binette, L., Haro-Corzo, S., Krongold, Y., & Andersen, A. 2007, ArXiv Astrophysics e-prints, astro-ph/0611011, the Central Engine of Active Galactic Nuclei”, ed. L. C. Ho and J.-M. Wang (San Francisco: ASP). In press.
- Binette & Krongold (2007) Binette, L., & Krongold, Y. 2007, ApJ, submitted
- Binette et al. (2005) Binette, L., Magris C., G., Krongold, Y., Morisset, C., Haro-Corzo, S., de Diego, J. A., Mutschke, H., & Andersen, A. C. 2005, ApJ, 631, 661, astro-ph/0505587, (B05)
- Binette et al. (2003) Binette, L., Rodríguez-Martínez, M., Haro-Corzo, S., & Ballinas, I. 2003, ApJ, 590, 58
- Binette et al. (2006) Binette, L., Wilman, R. J., Villar-Martín, M., Fosbury, R. A. E., Jarvis, M. J., & Röttgering, H. J. A. 2006, A&A, 459, 31, astro-ph/0607289
- Binette et al. (1997) Binette, L., Wilson, A. S., Raga, A., & Storchi-Bergmann, T. 1997, A&A, 327, 909
- Brocksopp et al. (2006) Brocksopp, C., Starling, R. L. C., Schady, P., Mason, K. O., Romero-Colmenero, E., & Puchnarewicz, E. M. 2006, MNRAS, 366, 953
- Casebeer et al. (2006) Casebeer, D. A., Leighly, K. M., & Baron, E. 2006, ApJ, 637, 157
- Collinge et al. (2001) Collinge, M. J. et al. 2001, ApJ, 557, 2, astro-ph/0104125
- Comastri et al. (1992) Comastri, A., Setti, G., Zamorani, G., Elvis, M., Wilkes, B. J., McDowell, J. C., & Giommi, P. 1992, ApJ, 384, 62
- Cristiani et al. (1997) Cristiani, S., Trentini, S., La Franca, F., & Andreani, P. 1997, A&A, 321, 123, astro-ph/9610108
- de Diego et al. (2007) de Diego, J. A., Binette, L., Ogle, P., Andersen, A. C., Haro-Corzo, S., & Wold, M. 2007, A&A, submitted
- Dickey & Lockman (1990) Dickey, J. M., & Lockman, F. J. 1990, ARA&A, 28, 215
- Dopita et al. (2002) Dopita, M. A., Groves, B. A., Sutherland, R. S., Binette, L., & Cecil, G. 2002, ApJ, 572, 753, astro-ph/0203360
- Dopita & Sutherland (1996) Dopita, M. A., & Sutherland, R. S. 1996, ApJS, 102, 161
- Eastman et al. (1983) Eastman, R. G., MacAlpine, G. M., & Richstone, D. O. 1983, ApJ, 275, 53
- Edelson & Malkan (1986) Edelson, R. A., & Malkan, M. A. 1986, ApJ, 308, 59
- Elvis et al. (2002) Elvis, M., Marengo, M., & Karovska, M. 2002, ApJ, 567, L107, astro-ph/0202002
- Fechner et al. (2006) Fechner, C. et al. 2006, A&A, 455, 91, astro-ph/0605150
- Ferguson et al. (1997) Ferguson, J. W., Korista, K. T., Baldwin, J. A., & Ferland, G. J. 1997, ApJ, 487, 122, astro-ph/9705083
- Ferrarese & Merritt (2000) Ferrarese, L., & Merritt, D. 2000, ApJ, 539, L9, astro-ph/0006053
- Ferruit et al. (1997) Ferruit, P., Binette, L., Sutherland, R. S., & Pecontal, E. 1997, A&A, 322, 73
- Francis et al. (1991) Francis, P. J., Hewett, P. C., Foltz, C. B., Chaffee, F. H., Weymann, R. J., & Morris, S. L. 1991, ApJ, 373, 465
- Gallagher & Everett (2007) Gallagher, S. C., & Everett, J. E. 2007, ArXiv Astrophysics e-prints, astro-ph/0701076
- Gambill et al. (2003) Gambill, J. K., Sambruna, R. M., Chartas, G., Cheung, C. C., Maraschi, L., Tavecchio, F., Urry, C. M., & Pesce, J. E. 2003, A&A, 401, 505
- Gaskell et al. (2004) Gaskell, C. M., Goosmann, R. W., Antonucci, R. R. J., & Whysong, D. H. 2004, ApJ, 616, 147
- Giveon et al. (1999) Giveon, U., Maoz, D., Kaspi, S., Netzer, H., & Smith, P. S. 1999, MNRAS, 306, 637, astro-ph/9902254
- Green et al. (1995) Green, P. J. et al. 1995, ApJ, 450, 51
- Groves et al. (2004a) Groves, B. A., Dopita, M. A., & Sutherland, R. S. 2004a, ApJS, 153, 9, astro-ph/0404175
- Groves et al. (2004b) ——. 2004b, ApJS, 153, 75, astro-ph/0404176
- Haardt & Maraschi (1991) Haardt, F., & Maraschi, L. 1991, ApJ, 380, L51
- Haas et al. (2004) Haas, M. et al. 2004, A&A, 424, 531, astro-ph/0406111
- Haas et al. (2005) Haas, M., Siebenmorgen, R., Schulz, B., Krügel, E., & Chini, R. 2005, A&A, 442, L39, astro-ph/0509340
- Hardcastle et al. (2002) Hardcastle, M. J., Birkinshaw, M., Cameron, R. A., Harris, D. E., Looney, L. W., & Worrall, D. M. 2002, ApJ, 581, 948
- Hawkins (1996) Hawkins, M. R. S. 1996, MNRAS, 278, 787
- Hook et al. (1994) Hook, I. M., McMahon, R. G., Boyle, B. J., & Irwin, M. J. 1994, MNRAS, 268, 305
- Hopkins et al. (2004) Hopkins, P. F. et al. 2004, AJ, 128, 1112
- Hubeny et al. (2000) Hubeny, I., Agol, E., Blaes, O., & Krolik, J. H. 2000, ApJ, 533, 710
- Humphrey et al. (2006) Humphrey, A., Villar-Martín, M., Fosbury, R., Vernet, J., & di Serego Alighieri, S. 2006, MNRAS, 369, 1103, astro-ph/0602504
- Iwamuro et al. (2003) Iwamuro, F. et al. 2003, ApJ, 598, 178, astro-ph/0308062
- Jones et al. (2004) Jones, A. P., d’Hendecourt, L. B., Sheu, S.-Y., Chang, H.-C., Cheng, C.-L., & Hill, H. G. M. 2004, A&A, 416, 235
- Koratkar & Blaes (1999) Koratkar, A., & Blaes, O. 1999, PASP, 111, 1
- Korista et al. (1997a) Korista, K., Baldwin, J., Ferland, G., & Verner, D. 1997a, ApJS, 108, 401, (KO97)
- Korista et al. (1997b) Korista, K., Ferland, G., & Baldwin, J. 1997b, ApJ, 487, 555
- Krongold et al. (2003) Krongold, Y., Nicastro, F., Brickhouse, N. S., Elvis, M., Liedahl, D. A., & Mathur, S. 2003, ApJ, 597, 832
- Krongold et al. (2005a) Krongold, Y., Nicastro, F., Brickhouse, N. S., Elvis, M., & Mathur, S. 2005a, ApJ, 622, 842
- Krongold et al. (2005b) Krongold, Y., Nicastro, F., Elvis, M., Brickhouse, N. S., Mathur, S., & Zezas, A. 2005b, ApJ, 620, 165
- Laor (1998) Laor, A. 1998, ApJ, 496, L71+, astro-ph/9802164
- Laor et al. (1997) Laor, A., Fiore, F., Elvis, M., Wilkes, B. J., & McDowell, J. C. 1997, ApJ, 477, 93, astro-ph/9609164
- Lee et al. (1995) Lee, G., Kriss, G. A., Davidsen, A. F., & Zheng, W. 1995, Bulletin of the American Astronomical Society, 27, 846
- Malkan (1983) Malkan, M. A. 1983, ApJ, 268, 582
- Mathews & Ferland (1987) Mathews, W. G., & Ferland, G. J. 1987, ApJ, 323, 456
- Mathur et al. (1994a) Mathur, S., Wilkes, B., Elvis, M., & Fiore, F. 1994a, ApJ, 434, 493
- Mathur et al. (1994b) ——. 1994b, Bulletin of the American Astronomical Society, 26, 885
- Moller & Jakobsen (1990) Moller, P., & Jakobsen, P. 1990, A&A, 228, 299
- Morrison & McCammon (1983) Morrison, R., & McCammon, D. 1983, ApJ, 270, 119
- Nandra et al. (1997) Nandra, K., George, I. M., Mushotzky, R. F., Turner, T. J., & Yaqoob, T. 1997, ApJ, 476, 70, astro-ph/9608170
- Nicastro et al. (1999) Nicastro, F., Fiore, F., Perola, G. C., & Elvis, M. 1999, ApJ, 512, 136
- Obrien et al. (1988) Obrien, P. T., Gondhalekar, P. M., & Wilson, R. 1988, MNRAS, 233, 845
- O’Brien et al. (2001) O’Brien, P. T., Page, K., Reeves, J. N., Pounds, K., Turner, M. J. L., & Puchnarewicz, E. M. 2001, MNRAS, 327, L37, astro-ph/0109346
- Page et al. (2004) Page, K. L., Reeves, J. N., O’Brien, P. T., Turner, M. J. L., & Worrall, D. M. 2004, MNRAS, 353, 133
- Pei (1992) Pei, Y. C. 1992, ApJ, 395, 130
- Pica & Smith (1983) Pica, A. J., & Smith, A. G. 1983, ApJ, 272, 11
- Piconcelli et al. (2005) Piconcelli, E., Jimenez-Bailón, E., Guainazzi, M., Schartel, N., Rodríguez-Pascual, P. M., & Santos-Lleó, M. 2005, A&A, 432, 15, astro-ph/0411051
- Porquet et al. (2004) Porquet, D., Reeves, J. N., O’Brien, P., & Brinkmann, W. 2004, A&A, 422, 85, astro-ph/0404385
- Puchnarewicz et al. (1996) Puchnarewicz, E. et al. 1996, MNRAS, 281, 1243
- Reeves & Turner (2000) Reeves, J. N., & Turner, M. J. L. 2000, MNRAS, 316, 234, astro-ph/0003080
- Reimers et al. (2005) Reimers, D., Hagen, H.-J., Schramm, J., Kriss, G. A., & Shull, J. M. 2005, A&A, 436, 465, astro-ph/0504014
- Richards et al. (2003) Richards, G. T. et al. 2003, AJ, 126, 1131
- Rouan et al. (2004a) Rouan, D., Gratadour, D., Clénet, Y., & Gendron, E. 2004a, in SF2A-2004: Semaine de l’Astrophysique Francaise, 479–+
- Rouan et al. (2004b) Rouan, D. et al. 2004b, A&A, 417, L1, astro-ph/0312094
- Rouleau & Martin (1991) Rouleau, F., & Martin, P. G. 1991, ApJ, 377, 526
- Scott et al. (2004) Scott, J. E., Kriss, G. A., Brotherton, M., Green, R. F., Hutchings, J., Shull, J. M., & Zheng, W. 2004, ApJ, 615, 135
- Shang et al. (2005) Shang, Z. et al. 2005, ApJ, 619, 41, (SBG05)
- Shields et al. (1998) Shields, G. A., Wobus, L., & Husfeld, D. 1998, ApJ, 496, 743, astro-ph/9711210
- Siemiginowska et al. (2002) Siemiginowska, A., Bechtold, J., Aldcroft, T. L., Elvis, M., Harris, D. E., & Dobrzycki, A. 2002, ApJ, 570, 543
- Siemiginowska et al. (2003) Siemiginowska, A. et al. 2003, ApJ, 595, 643, astro-ph/0306129
- Spinrad et al. (1993) Spinrad, H. et al. 1993, AJ, 106, 1
- Telfer et al. (2002) Telfer, R. C., Zheng, W., Kriss, G. A., & Davidsen, A. F. 2002, ApJ, 565, 773, (TZ02)
- Trevese et al. (1994) Trevese, D., Kron, R. G., Majewski, S. R., Bershady, M. A., & Koo, D. C. 1994, ApJ, 433, 494, astro-ph/9407003
- Tripp et al. (1994) Tripp, T. M., Bechtold, J., & Green, R. F. 1994, ApJ, 433, 533
- Van Kerckhoven et al. (2002) Van Kerckhoven, C., Tielens, A. G. G. M., & Waelkens, C. 2002, A&A, 384, 568
- Vanden Berk et al. (2001) Vanden Berk, D. E. et al. 2001, AJ, 122, 549
- Vaughan et al. (2004) Vaughan, S., Fabian, A. C., Ballantyne, D. R., De Rosa, A., Piro, L., & Matt, G. 2004, MNRAS, 351, 193, astro-ph/0402660
- Vernet et al. (2001) Vernet, J., Fosbury, R. A. E., Villar-Martín, M., Cohen, M. H., Cimatti, A., di Serego Alighieri, S., & Goodrich, R. W. 2001, A&A, 366, 7, astro-ph/0010640
- Whittet (2003) Whittet, D. 2003, Dust in the Galactic Enviroment (2d ed.) (Institute of Physics Publishing, Bristol and Philadelphia. Series in Astronomy and Astrophysics)
- Wilkes (2004) Wilkes, B. 2004, in ASP Conf. Ser. 311: AGN Physics with the Sloan Digital Sky Survey, 37
- Willott (2005) Willott, C. J. 2005, ApJ, 627, L101
- Wills et al. (1985) Wills, B. J., Netzer, H., & Wills, D. 1985, ApJ, 288, 94
- Yip et al. (2004) Yip, C. W. et al. 2004, AJ, 128, 2603, astro-ph/0408578
- Young et al. (1981) Young, P., Deverill, R. S., Gunn, J. E., Westphal, J. A., & Kristian, J. 1981, ApJ, 244, 723
- Yuan et al. (1998) Yuan, W., Siebert, J., & Brinkmann, W. 1998, A&A, 334, 498
- Zheng et al. (2004) Zheng, W. et al. 2004, ApJ, 605, 631, astro-ph/0312557
- Zheng et al. (1997) Zheng, W., Kriss, G. A., Telfer, R. C., Grimes, J. P., & Davidsen, A. F. 1997, ApJ, 475, 469, (Z97)
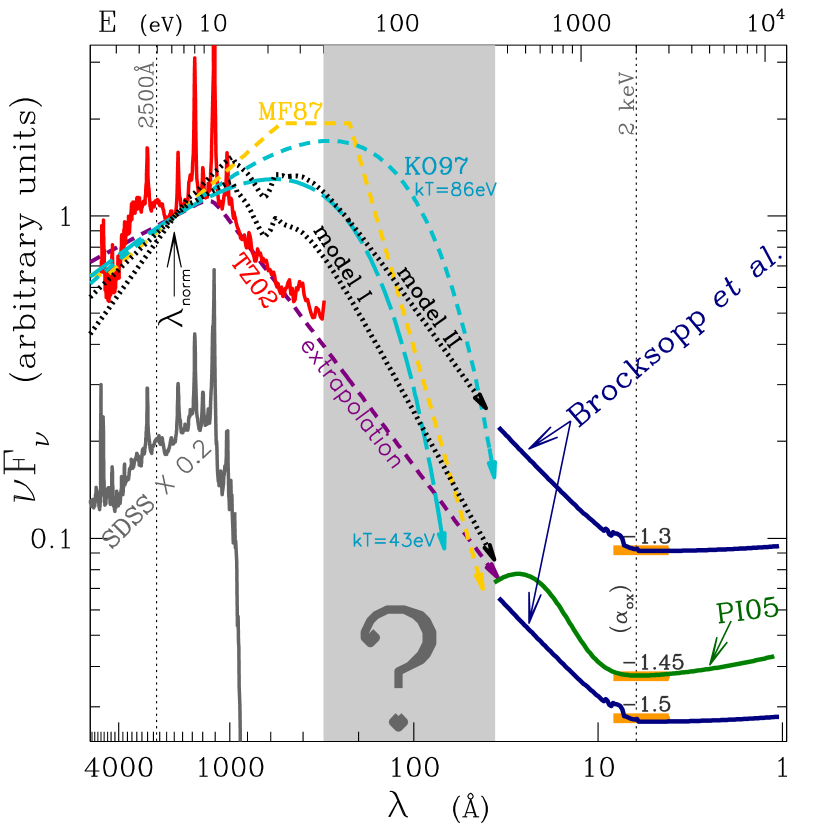
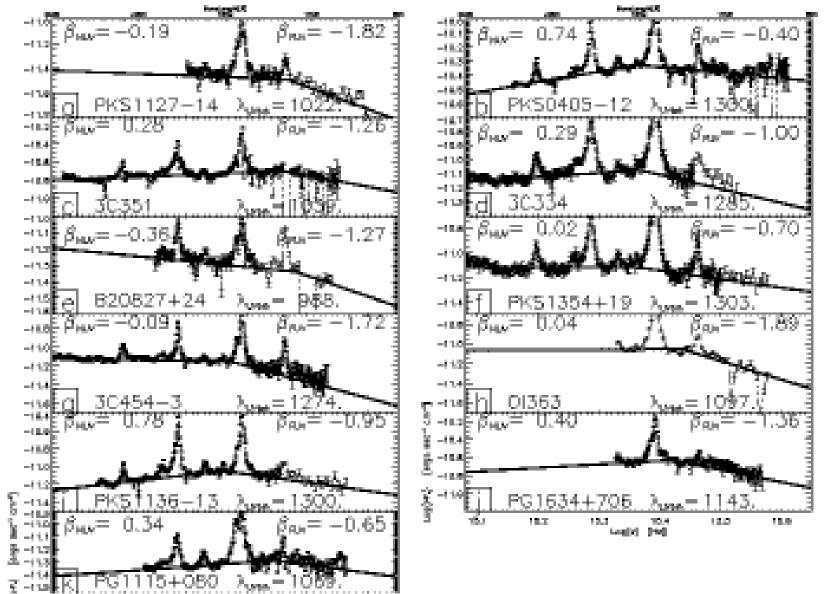
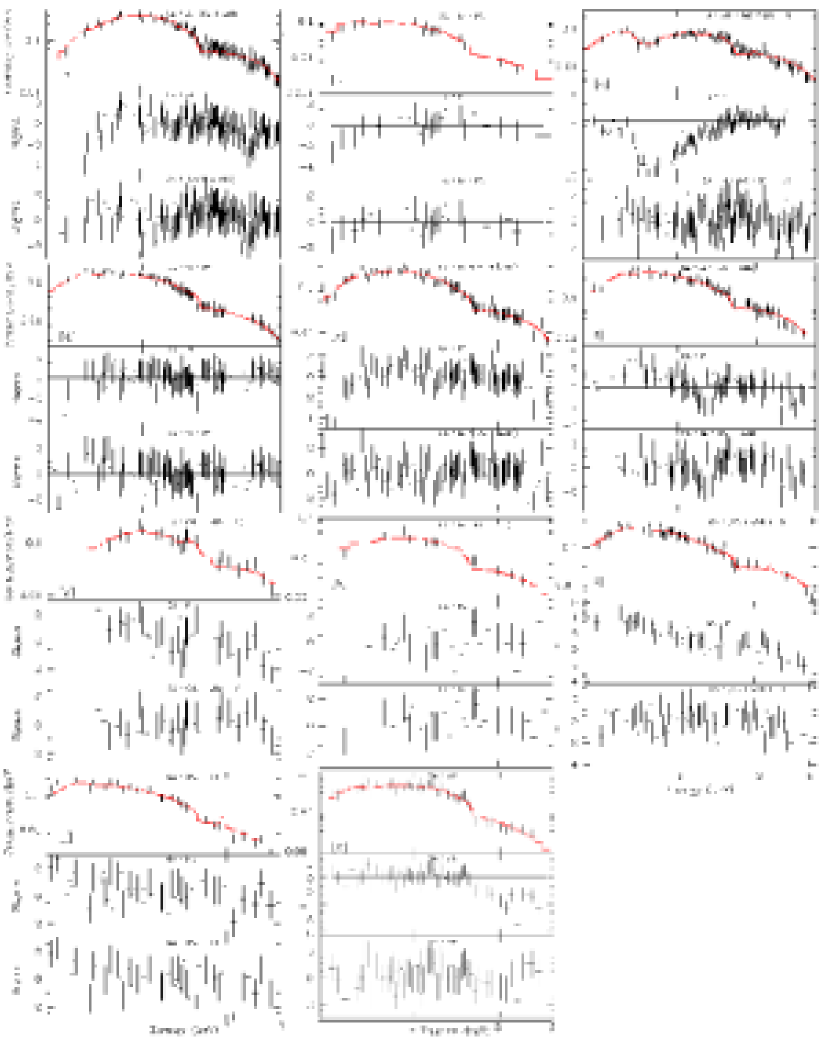
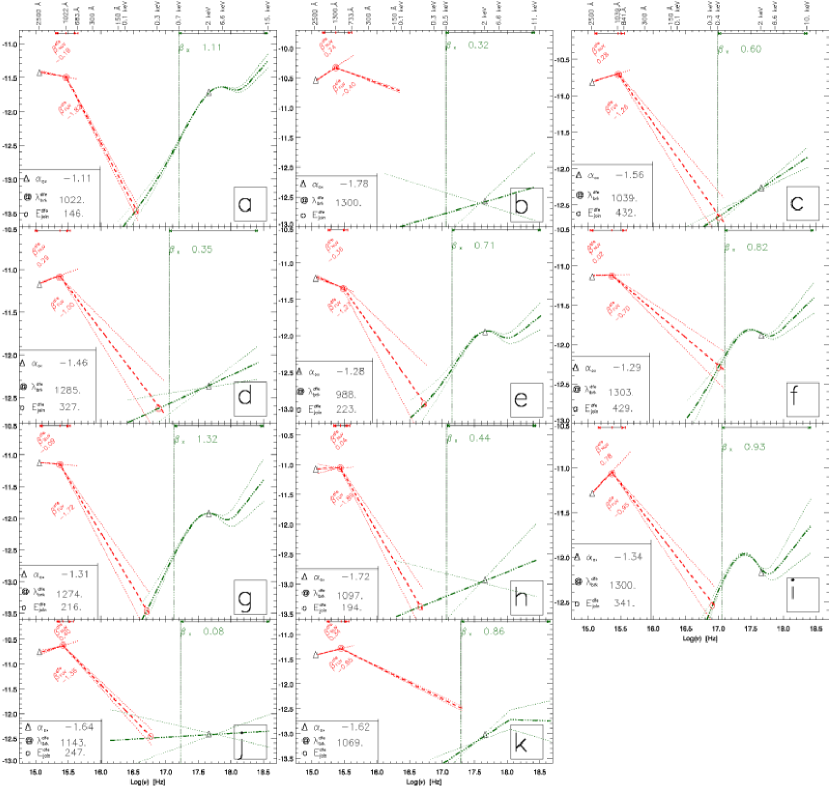
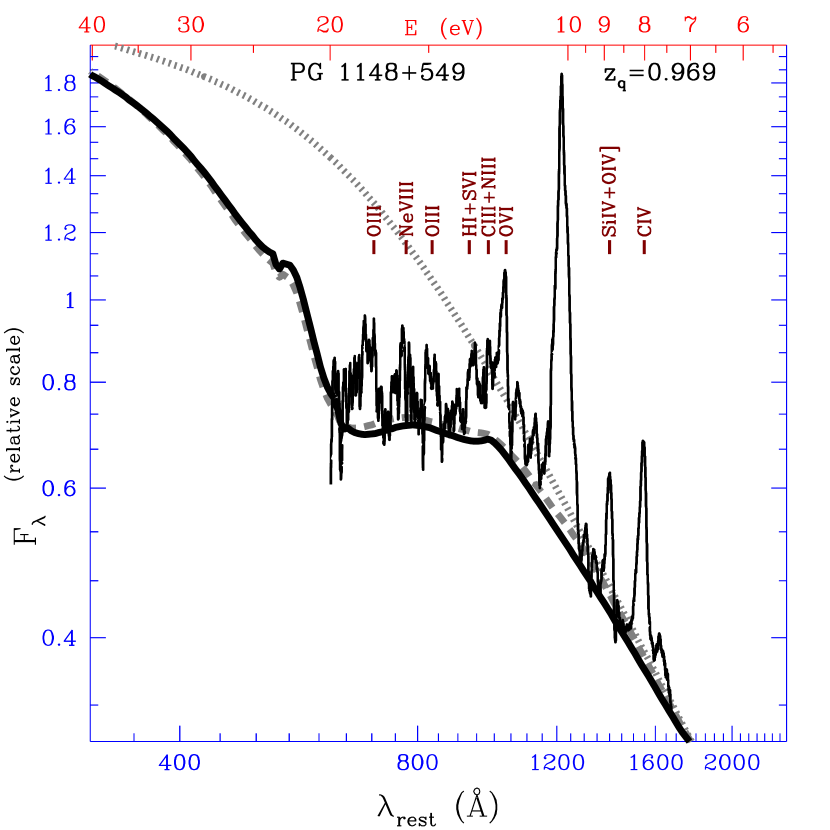
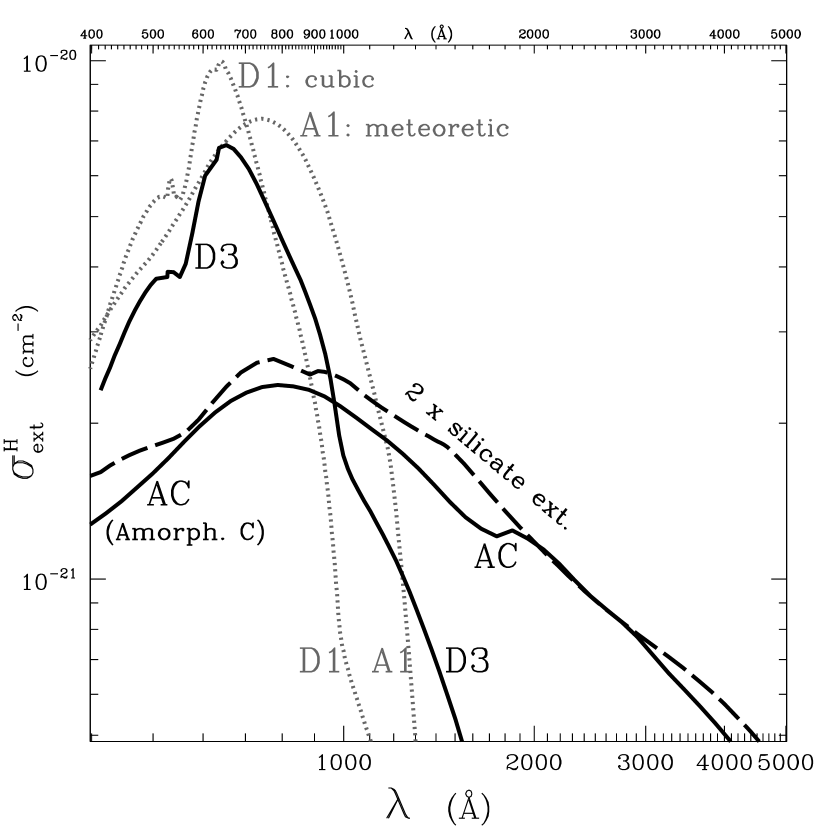
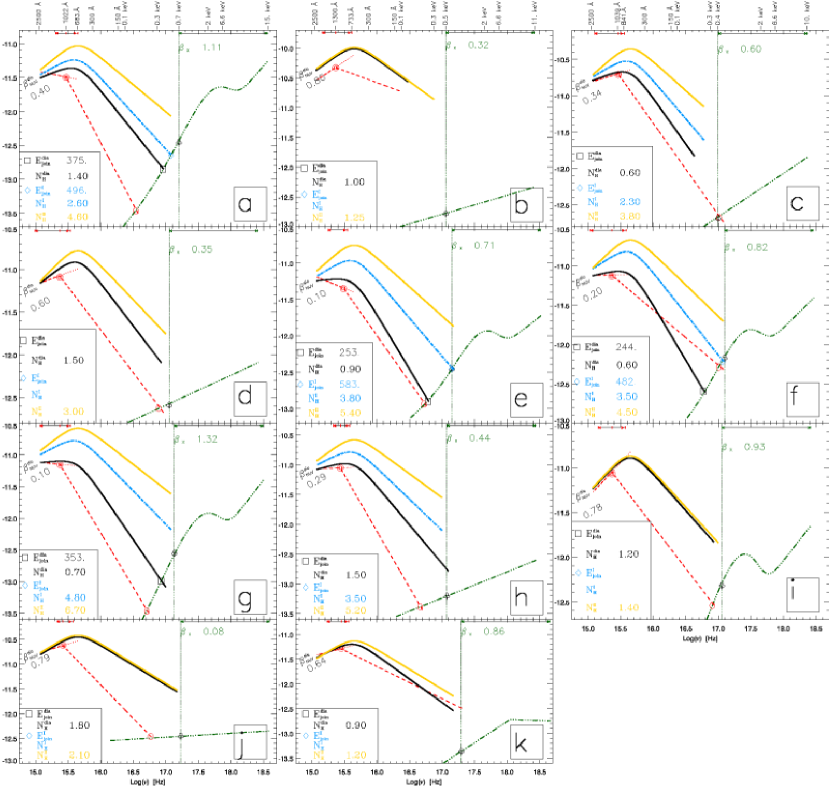
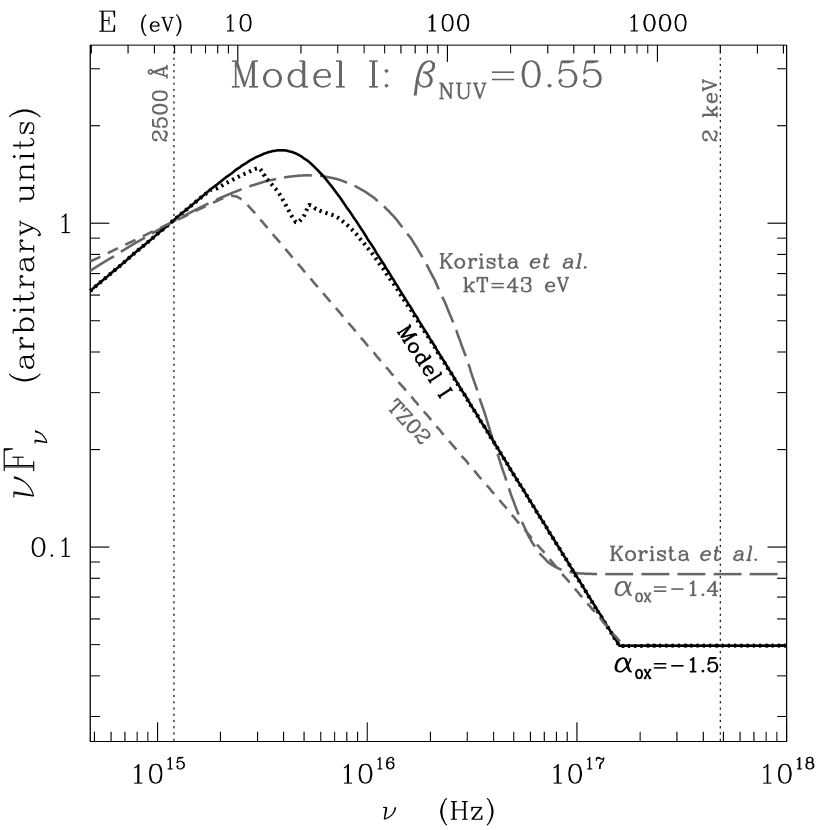
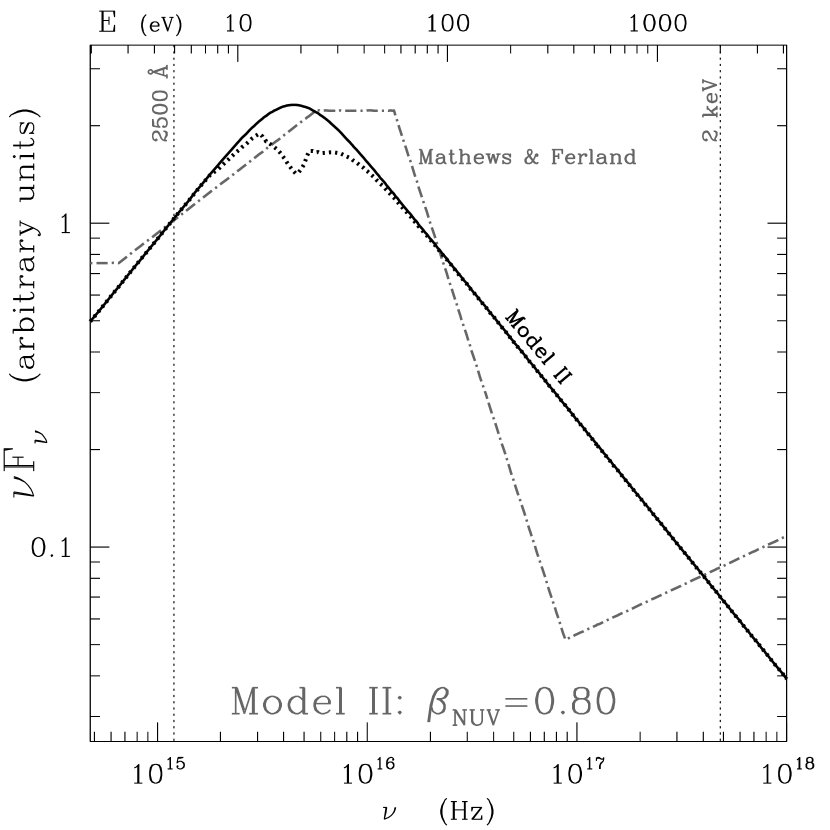
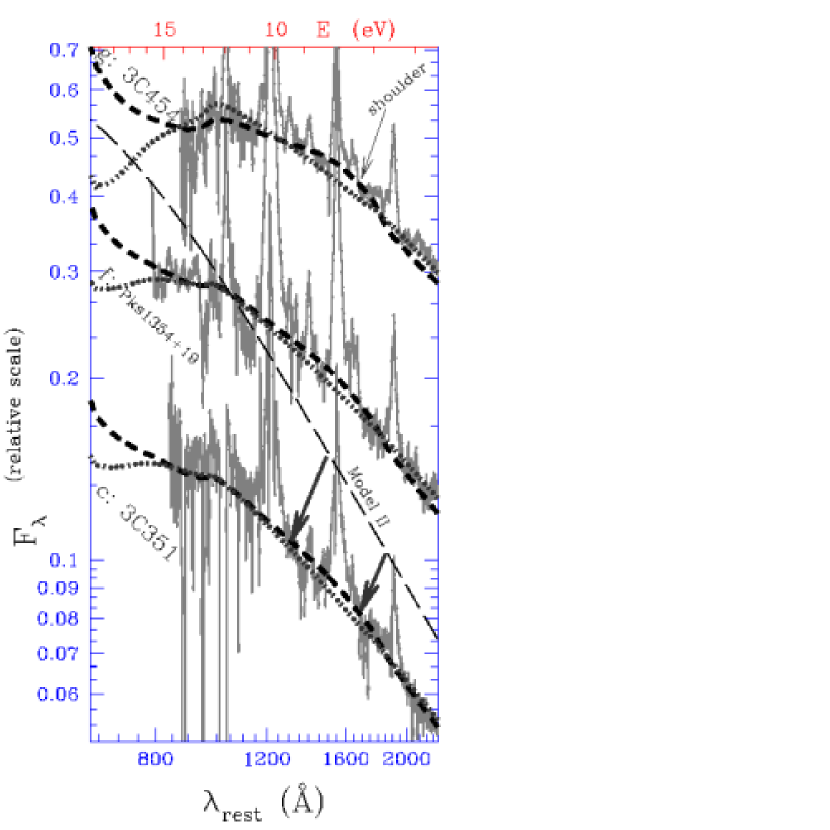
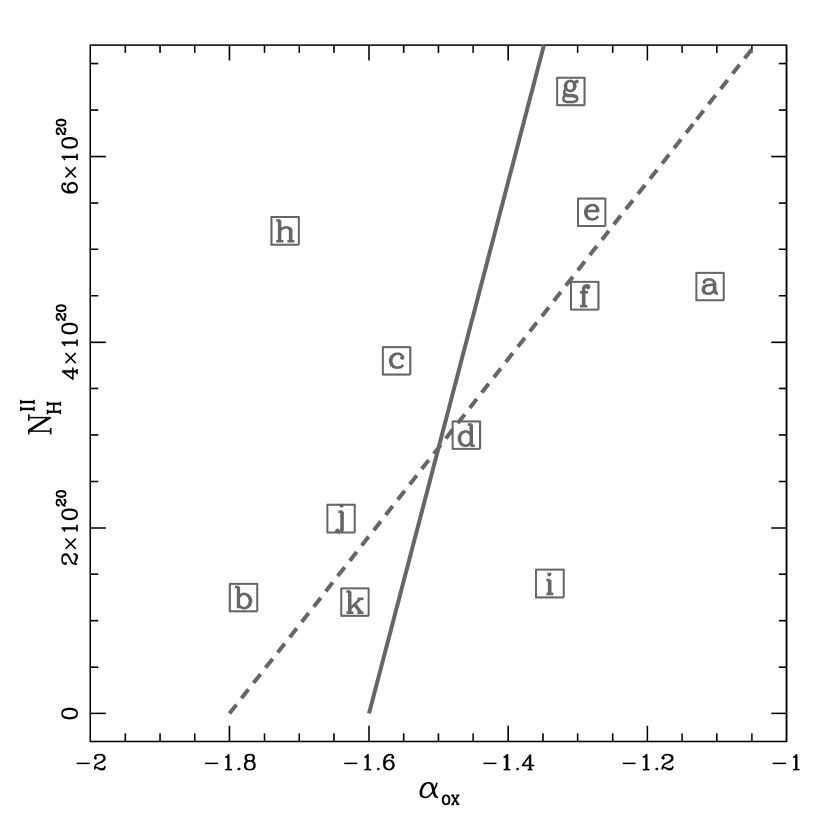
| Common | Fig | z | (a)(a)footnotemark: | Radio- | Spectral | Chandra | Exp. Time | Total | Frame | Chandra | HST |
|---|---|---|---|---|---|---|---|---|---|---|---|
| Name | Label | cm-2 | loudness | Class(b)(b)footnotemark: | ID | (ksec) | CountsccExtracted from Sherpa’s command “show” using a 3 arcsec circle region around the source. | TimeddSee table with CDD frame-time (sec) for standard Subarrays http://cxc.harvard.edu/proposer/POG/. | Date | Date | |
| (1) | (2) | (3) | (4) | (5) | (6) | (7) | (8) | (9) | (10) | (11) | (12) |
| Pks 112714 | a | 1.18 | 4.09 | RLQ | A | 866 | 27.3 | 16370 | 0.4 | 2000-05-28 | 1993-01-01 |
| Pks 0405123 | b | 0.57 | 3.8 | RLQ | A | 2131 | 8.6 | 11994 | 0.4 | 2001-07-22 | 1991-07-01 |
| 3C351 | c | 0.3712 | 2.49 | RLQ | A | 2128 | 50.92 | 9450 | 1.7 | 2001-08-24 | 1991-10-22 |
| 3C334 | d | 0.56 | 4.28 | RLQ | A | 2097 | 32.4 | 8928 | 0.85 | 2001-08-22 | 1991-09-07 |
| B2 0827+24 | e | 0.939 | 3.62 | RLQ | A | 3047 | 18.2 | 6914 | 0.4 | 2002-05-07 | 1997-10-28 |
| Pks 1354+19 | f | 0.720 | 2.23 | RLQ | A | 2140 | 9. | 6445 | 0.4 | 2001-01-08 | 1992-02-26 |
| 3C454.3 | g | 0.850 | 6.41 | RLQ | B | 3127 | 4.9 | 4716 | 0.8 | 2002-11-06 | 1991-09-11 |
| OI 363 | h | 0.63 | 4.18 | RLQ | B | 377 | 27.6 | 4291 | 3.2 | 2000-10-10 | 1997-05-15 |
| Pks 113613 | i | 0.560 | 3.6 | RLQ | A | 2138 | 8.9 | 3720 | 0.4 | 2000-11-30 | 1992-01-30 |
| PG 1634+706 | j | 1.330 | 4.54 | RQQ | A | 1269 | 10.8 | 3113 | 0.4 | 1999-08-21 | 1991-11-03 |
| PG 1115+080 | k | 1.718 | 4.01 | RQQ | A | 363 | 26.4 | 1814 | 3.2 | 2000-06-02 | 1997-01-22 |
| Common | Object | S/NaaWebtool colden http://cxc.harvard.edu/toolkit/colden.jsp, which is based on radio H imaps of Dickey & Lockman (1990). | Spectral | Near-UVbbSpectral class based on the far-UV break, following B05. | Far-UVbbThe powerlaw is normalized as follows: , where cm. We recall that is defined in the plane, with . | bbThe powerlaw is normalized as follows: , where cm. We recall that is defined in the plane, with . | |
|---|---|---|---|---|---|---|---|
| Name | Label | Range | (Å) | () | |||
| (1) | (2) | (3) | (4) | (5) | (6) | (7) | (8) |
| Pks 112714 | a | 8.5 | 681-1498 | 1022 | 3.60 | ||
| Pks0405123 | b | 18.5 | 733-2083 | 1300 | 38.1 | ||
| 3C351 | c | 10.3 | 840-2386 | 1039 | 20.1 | ||
| 3C334 | d | 8.9 | 884-3075 | 1285 | 6.55 | ||
| B2 0827+24 | e | 9.5 | 861-1690 | 988 | 4.87 | ||
| Pks 1354+19 | f | 9.3 | 788-2780 | 1303 | 6.03 | ||
| 3C454.3 | g | 11.9 | 877-2575 | 1274 | 5.32 | ||
| OI 363 | h | 13.6 | 789-1406 | 1097 | 8.73 | ||
| Pks 113613 | i | 12.2 | 815-2100 | 1300 | 6.94 | ||
| PG 1634+706 | j | 12.5 | 809-1412 | 1143 | 21.0 | ||
| PG 1115+080 | k | 15.8 | 817-1759 | 1069 | 4.62 |
| Common | Fig. | Best Fit | PL | Neu. Gas | d.o.f/ (d)(d)footnotemark: | Ionized Gas | zBB | G | d.o.f.//Q | |
|---|---|---|---|---|---|---|---|---|---|---|
| Name | Lab | Model Descr. | aaSignal to Noise (/error-bar) at 1300 Å. | NbbPowerlaw normalization defined at 1 keV in photons . | (c)(c)footnotemark: | Log / / | kT/N(e)(e)footnotemark: | fwhm/pos/A(f)(f)footnotemark: | ||
| (1) | (2) | (3) | (4) | (5) | (6) | (7) | (8) | (9) | (10) | (11) |
| Pks 112714 | a | GA*IA*(PL+zBB) | 4.02 | 285/608 | 0.63/2.44 | 282/272/0.65 | ||||
| Pks 0405123 | b | GA*IA*PL | 1.54 | 49/33 | 48/28/0.99 | |||||
| 3C351 | c | GA*IA1*IA2*(PL+G) | 2.8 | 232/900 | 0.08/2.66/0.23 | 224/214/0.67 | ||||
| 3C334 | d | GA*IA*PL | 2.60 | 177/229 | 176/149/0.93 | |||||
| B2 0827+24 | e | GA*IA*(PL+zBB) | 2.95 | 172/219 | 0.46/1.13 | 169/128/0.99 | ||||
| Pks 1354+19 | f | GA*IA*(PL+zBB) | 4.95 | 166/206 | 0.28/1.54 | 163/143/0.86 | ||||
| 3C454.3 | g | GA*(PL+zBB+G) | 1.89 | 67/117 | 0.43/1.49 | 0.42/2.14/1.20 | 62/44/0.96 | |||
| OI 363 | h | GA*IA*(PL) | 0.66 | 61/54 | 60/46/0.76 | |||||
| Pks 113613 | i | GA*(PL+zBB+G) | 2.30 | 220/396 | 0.25/1.35 | 0.01/ 3.35/2.57 | 115/90/0.71 | |||
| PG 1634+706 | j | GA*(PL+G) | 2.6 | 93/92 | 0.001/2.84/28.92 | 90/88/0.54 | ||||
| PG 1115+080 | k | GA*BP | ggBroken Power Law. Spectral Index after break (1.69 keV) is and energy of reference at 0.5 keV. | 1.67 | 71/77 | 70/49/0.97 |
| Quasars | Dust-free Model | Break-corrected Model | AC Dust Model I | Model II | ||||||||||
|---|---|---|---|---|---|---|---|---|---|---|---|---|---|---|
| Common | Object | |||||||||||||
| Name | Label | eV | eV | eV | ||||||||||
| (1) | (2) | (3) | (4) | (5) | (6) | (7) | (8) | (9) | (10) | (11) | ||||
| Pks 112714 | a | -0.19 | 146 | 0.4 | 375 | -1.21 | 496 | -1.39 | ||||||
| Pks 0405123 | b | 0.74 | 0.8 | -2.73 | (a)(a)footnotemark: | (a)(a)footnotemark: | ||||||||
| 3C351 | c | 0.28 | 432 | 0.34 | -1.87 | -2.22 | ||||||||
| 3C334 | d | 0.29 | 327 | 0.6 | -1.85 | (a)(a)footnotemark: | (a)(a)footnotemark: | |||||||
| B2 0827+24 | e | -0.36 | 223 | 0.1 | 253 | -0.97 | 583 | -1.60 | ||||||
| Pks 1354+19 | f | 0.02 | 429 | 0.2 | 244 | -1.0 | 482 | -1.54 | ||||||
| 3C454.3 | g | -0.09 | 216 | 0.1 | 353 | -1.10 | -1.81 | |||||||
| OI 363 | h | 0.04 | 194 | 0.29 | -1.92 | -2.32 | ||||||||
| Pks 113613 | i | 0.78 | 341 | 0.78 | -1.83 | (a)(a)footnotemark: | (a)(a)footnotemark: | |||||||
| PG 1634+706 | j | 0.40 | 247 | 0.79 | -2.17 | (a)(a)footnotemark: | (a)(a)footnotemark: | |||||||
| PG 1115+080 | k | 0.34 | 0.64 | -2.07 | (a)(a)footnotemark: | (a)(a)footnotemark: | ||||||||
| Quasars | Galactic Abs. | X-rays | ND Dust | AC Dust Model I | AC Dust Model II | ||||||||||
|---|---|---|---|---|---|---|---|---|---|---|---|---|---|---|---|
| Object | E(B-V)GA | E(B-V)I | / | E(B-V)II | / | ||||||||||
| Label | cm-2 | cm-2 | cm-2 | cm-2 | cm-2 | ||||||||||
| (1) | (2) | (3) | (4) | (5) | (6) | (7) | (8) | (9) | (10) | (11) | |||||
| a | 4.09 | 0.069 | 27.3 | 1.4 | 2.6 | 0.017 | 0.095 | 4.6 | 0.045 | 0.17 | |||||
| b | 3.8 | 0.064 | 4.1 | 1.0 | 1.25 | 3.6 | 0.31 | ||||||||
| c | 2.49 | 0.042 | 389 | 0.60 | 2.3 | 0.024 | 0.0059 | 3.8 | 0.045 | 0.010 | |||||
| d | 4.28 | 0.073 | 4.7 | 1.5 | 3.0 | 0.021 | 0.64 | ||||||||
| e | 3.62 | 0.061 | 13.1 | 0.90 | 3.8 | 0.041 | 0.29 | 5.4 | 0.065 | 0.41 | |||||
| f | 2.23 | 0.038 | 6.4 | 0.60 | 3.5 | 0.041 | 0.54 | 4.5 | 0.055 | 0.69 | |||||
| g | 6.41 | 0.11 | 0.70 | 4.8 | 0.053 | 0.11 | 6.7 | 0.085 | 0.15 | ||||||
| h | 4.18 | 0.071 | 7.2 | 1.5 | 3.5 | 0.029 | 0.48 | 5.2 | 0.054 | 0.72 | |||||
| i | 3.6 | 0.061 | 1.2 | 1.4 | 2.3 | 0.58 | |||||||||
| j | 4.54 | 0.077 | 1.8 | 2.1 | 4.3 | 1.8 | |||||||||
| k | 4.01 | 0.068 | 0.90 | 1.2 | 4.3 | 0.031 | |||||||||
| Line ID | E-NLRb | TZ02 | Model Ic | Model IIc | |
|---|---|---|---|---|---|
| (1) | (2) | (3) | (4) | (5) | (6) |
| Ly | 1216 | 7.1d | 12.3 | 13.7 | 13.8 |
| H | 4861 | 1.0 | 1.00 | 1.00 | 1.00 |
| H | 6563 | 2.9 | 2.93 | 2.92 | 2.91 |
| He ii | 1640 | 0.58 | 1.2 | 1.3 | 1.7 |
| He ii | 4686 | – | 0.15 | 0.17 | 0.22 |
| C ii] | 2326 | 0.10 | 0.05 | 0.03 | 0.05 |
| C iii] | 977 | – | 0.029 | 0.020 | 0.042 |
| C iii] | 1909 | 0.26 | 0.5 | 0.5 | 0.8 |
| C iv | 1549 | 0.79 | 1.4 | 1.3 | 2.1 |
| [N ii] | 6583 | 0.83 | 0.21 | 0.18 | 0.23 |
| N iii] | 991 | – | 0.0018 | 0.0012 | 0.0026 |
| N iii] | 1749 | – | 0.024 | 0.023 | 0.038 |
| N iv] | 1485 | – | 0.12 | 0.11 | 0.18 |
| N v | 1240 | 0.34 | 0.36 | 0.33 | 0.54 |
| [O i] | 6300 | 0.29 | 0.19 | 0.09 | 0.16 |
| [O ii] | 3727 | 1.3 | 0.56 | 0.54 | 0.69 |
| [O iii] | 4363 | – | 0.057 | 0.060 | 0.10 |
| [O iii] | 5007 | 9.8 | 10 | 11 | 14 |
| O iii] | 1665 | 0.10 | 0.084 | 0.075 | 0.15 |
| O vi | 1035 | – | 1.3 | 1.1 | 2.6 |
| [S ii] | 6723 | 0.60 | 0.36 | 0.18 | 0.27 |
| Mg ii | 2800 | – | 0.29 | 0.22 | 0.32 |
| Si iii] | 1887 | – | 0.0023 | 0.0022 | 0.0051 |
| [Ne iii] | 3869 | – | 0.57 | 0.66 | 0.87 |
| [Ne iv] | 2424 | 0.61 | 0.2 | 0.2 | 0.27 |
| [Ne v] | 3426 | – | 0.61 | 0.63 | 0.93 |
| [Fe vii] | 6087 | – | 0.00085 | 0.00089 | 0.0011 |
| Fe x] | 6374 | – | 0.0076 | 0.0046 | 0.025 |
| / | – | – | 0.088 | 0.093 | 0.127 |
| (K) | – | 9450 | 9300 | 10100 | |
| () | – | 595 | 565 | 560 |
-
a
Line ratios are expressed relative to H. All models are ionization bounded and assume a ‘front’ density , solar metallicities and dust grains made of amorphous carbon corresponding to a depletion of only (see § 7.2).
-
b
Line fluxes, relative to H, for the narrow-line radio-galaxy 4C00.54, taken from Vernet et al. (2001); Iwamuro et al. (2003) and Humphrey et al. (in prep.). The relatively high-ionization state in the E-ELR of this source () (see § 7.1), taken together with the unperturbed kinematics (FWHM and large radio size ( kpc), suggests that it is not strongly affected by shock-ionization (Humphrey et al., 2006). Since H was not detected in the spectrum of this source, we have assumed that H/H. The line ratios are corrected for Galactic reddening using (Vernet et al., 2001).
- c
-
d
The Ly is most likely absorbed, either by internal dust or possibly by an extended but local H i absorber, which is a common phenomenon in high redshift radio-galaxies (Binette et al., 2006, and references therein).