Confirming the –ray burst spectral–energy correlations in the era of multiple time breaks
We test the spectral–energy correlation including the new bursts detected (mostly) by Swift with firm measurements of their redshifts and peak energy. The problem of identifying the jet breaks is discussed in the complex and multibreak/flaring X–ray light curves observed by Swift. We use the optical data as the most reliable source for the identification of the jet break, since the X–ray flux may be produced by a mechanism different from the external shocks between the fireball and the circumburst medium, which are responsible for the optical afterglow. We show that the presence of an underlying SN event in XRF 050416A requires a break to occur in the afterglow optical light curve at around the expected jet break time. The possible presence of a jet break in the optical light curve of GRB 050401 is also discussed. We point out that, for measuring the jet break, it is mandatory that the optical light curve extends after the epoch where the jet break is expected. The interpretation of the early optical breaks in GRB 050922C and GRB 060206 as jet breaks is controversial because they might instead correspond to the flat–to–steep decay transition common in the early X–ray light curves. All the 16 bursts coming from Swift are consistent with the and correlation. No outlier is found to date. Moreover, the small dispersion of the and correlation, confirmed also by the Swift bursts, strengthens the case of using GRBs as standard candles.
Key Words.:
Gamma rays: bursts — Radiation mechanisms: non-thermal — X–rays: generalgiancarlo.ghirlanda@brera.inaf.it
1 Introduction
Since the launch of the Swift satellite (Gehrels et al. 2004) we are witnessing the discovery of new properties of Gamma Ray Bursts (GRBs), thanks to the “prompt” follow up of the GRB emission from the X–ray to the optical and NIR band (see e.g. Zhang 2007 for a recent review).
In the pre–Swift era several correlations involving the prompt and afterglow properties of long Gamma–Ray Bursts with measured redshifts were reported. Amati et al. (2002), with 12 GRBs detected by BeppoSAX found that the prompt emission (rest frame) spectral peak energy (i.e. the peak of the spectrum) is correlated with the isotropic energy released during the prompt phase ( - so called “Amati” correlation). The inclusion of more bursts detected by BATSE(CGRO), Integral and Hete–II (Ghirlanda, Ghisellini & Lazzati 2004 - GGL04 hereafter, Lamb et al. 2004, Nava et al. 2006 - N06 hereafter) confirmed this correlation. Recently, Amati (2006) confirmed his correlation by adding the 17 bursts, detected in the Swift era (up to GRB 061007), with firm measurements of their and redshift .
The possible jetted nature of GRBs implies that, when the fireball is decelerated by the circumburst medium up to (where is the jet opening angle), an achromatic break should appear in the GRB afterglow light curve at a characteristic time (e.g. Rhoads 1997; Sari, Piran & Halpern 1999). By correcting the GRB prompt emission energy for the collimation factor (), Frail et al. (2001, see also Bloom et al. 2003) showed that the large dispersion of is reduced. Then GGL04 discovered (with a sample of 15 GRBs with jet break times measured from the optical light curves) a tight correlation (so called “Ghirlanda” correlation) between the GRB peak energies and the collimation corrected energy, i.e. (where ) if the circumburst medium has a constant density (homogeneous medium – HM) and the radiative efficiency of the prompt phase is the same for all bursts (a value of 20% was used – e.g. Frail et al. 2001). In the case of a stratified circumburst density (e.g. – wind medium, WM), N06 showed that this correlation (computed with the 17 GRBs of the pre–Swift era plus the Swift burst GRB 050525A) becomes linear: . Furthermore, Liang & Zhang (2005) discovered a completely phenomenological correlation (so called “Liang–Zhang” correlation) involving the three observables , and (all quantities computed in the source frame and estimated from the optical light curve) whose consistency with the model dependent correlations has been demonstrated in N06.
The quantities needed to test the and correlations are the redshift , the peak energy and the jet break time . Despite (i.e. about ) of the Swift GRBs have a measured redshift, both the and the correlations were hardly tested with new bursts due to: (i) the difficulty to measure the peak energy with the relatively small energy band (15–150 keV) of the BAT instrument on–board Swift; and (ii) the unexpected (and unforeseen in the pre-Swift era) complexity of the early (d) afterglow light curves (Nousek et al. 2006; O’Brien et al. 2006; Borrows et al. 2005).
A typical Swift X–ray light curve, in fact, presents at least three phases (Nousek et al. 2006): (a) a steep initial decay followed by (b) a flat phase and finally (c) by a steeper decay (similar to what observed in the the pre–Swift afterglow light curves). These phases are separated by corresponding breaks at s [from (a) to (b)] and between 103 and 104 s [from (b) to (c)]. Also, an intense (long–lasting) flaring activity is superposed to the typical bare power law decay of the afterglow X–ray light curve (Burrows et al. 2007). The optical light curve tracks the X–ray light curve in some cases, but more often it is different. Also in the optical light curve there can be a multiplicity of breaks, also not simultaneous with those of the X–ray light curve (e.g. Panaitescu 2007).
In a recent paper, Willingale et al. (2007, W07 hereafter), studied the Swift GRB X–ray emission and suggested that both the very early and the late (up to 105–106 s) emission can be reproduced with a model having the same functional form, i.e. an exponential smoothly connected with a power law. For the afterglow phase, this functional form allows to define the characteristic time where the power law sets in and dominates the emission, which W07 estimated for a large number of Swift bursts. Intriguingly, they found that if is treated as a jet break time (i.e. with the same formalism which is used to derive the collimation angle from the measure of ), then the collimation corrected energetics correlates strongly with , for those Swift bursts of known and .
Trying to explain the different optical and X–ray behavior, Uhm & Beloborodov (2007) and Grenet, Daigne & Mochkovitch (2007) have proposed that the X–ray flux may be dominated by the reverse shock emission in slow shells, while the optical flux is instead due to the standard forward external shock. In this case only the optical light curve (and even not always, if the reverse shock contributes also in the optical) can show a jet break time. Another possibility is that the X–ray flux is dominated by a late activity of the central engine (late prompt emission model, see Ghisellini et al. 2007).
This complexity requires care when identifying a break with the jet break time. Since the pre–Swift and relations made use of break times found in the optical light curves (typically starting several hours after the GRB trigger), it is safer to use only the optical light curves to find , and relax the requirement that the break should be present also in the X–ray light curve which, as mentioned above, could be produced by a different mechanism. In addition, an early optical break should be tested for being the jet break: if the light curve does not extend to (and even after) the epoch when the jet break is expected (according to the correlation), this early break cannot be claimed to be the jet break. This is, indeed, the case of GRB 050922C and 060206 (discussed below).
The relevance of the (and of its phenomenological form, i.e. the correlation) is twofold: (1) they represent a new tool to understand the GRB physics and some interpretations have already been proposed (see e.g. Eichler & Levinson 2005; Thompson 2006; Thompson, Meszaros & Rees 2007); (2) the tightness of these correlations makes them a new tool to standardize the GRB energetics for a cosmological use (e.g. Ghirlanda, Ghisellini & Firmani 2006 for a review). More recently, Firmani et al. (2006 - F06 hereafter) discovered a new correlation which is based only on prompt emission properties and is a new tool to use GRBs as standard candle which does not require the use of the jet break time (Firmani et al. 2006a, 2006b).
In this paper we update the and correlation by including all the possible GRBs detected in the Swift era. With a sample which is doubled with respect to the original one (GGL04) we find no new outlier with respect to these correlations, despite previous claims of the contrary (Sato et al. 2006 - S06 hereafter; Mundell et al. 2007). We will then discuss these cases in more detail.
In Sec. 2 we present and discuss the sample of GRBs, in Sec. 3 we find (GRB 050416A and GRB 050401) and discuss (GRB 050922C and GRB 060206) some jet break times derived in the optical, while in Sec. 4 we present the results of the statistical analysis of the and correlation. In Sec. 5 we discuss our results.
We use a standard cosmology with and .
2 The sample
Before the Swift mission the jet break time was measured from the optical light curves of GRB afterglows. Since it should be achromatic, we were hoping that the Swift capability to localize and promptly follow the X–ray emission of the burst would greatly help to easily measure several from the X–ray light curve. Indeed, Swift has observed several X–ray afterglows starting seconds after the GRB onset. In a few cases the X–ray emission was measured also simultaneously with the prompt –ray emission (e.g. Butler & Kochevski 2007). But, unexpectedly, these light curves are complex (steep–flat–steep structure with multiple breaks and several superposed early and late time flares). As a consequence, the jet break can be hardly identified using the X–ray data. It is therefore reasonable to rely on the optical light curves to search for possible jet breaks. Also in this case, however, we should keep in mind that the optical emission often shows a complexity similar to what seen in the X–rays.
After having selected all Swift GRBs with measured redshift, we have searched for any published information on their prompt emission spectral properties in order to obtain and to estimate . Finally, we searched for evidence of jet breaks in the optical light curves. In several cases we could only set a lower limit on although the optical emission was fairly well sampled. For the reasons discussed above we did not include in our sample the GRBs for which a jet break was claimed only in the X–ray light curve. We present our sample in Tab. 1 dividing the pre–Swift GRBs from those identified in the Swift era and added in this paper (from GRB 050525A to GRB 061121).
The typical time–averaged spectrum of GRBs (e.g. Preece et al. 2000; Kaneko et al. 2006) is best fitted by a smoothly joint double power law model (the Band model – Band et al. 1993). However, for some bursts detected by Hete–II and included in the pre–Swift sample of N06 and F06, the time–averaged spectrum reported in the literature was fitted with a power law ending with a high–energy exponential cutoff (CPL model). The isotropic energy used to define the Amati correlation as well as the and correlations is derived by extrapolating the best fit spectral model in the rest frame 1–104 keV energy band (e.g. see Eq. 1 in GGL04). As a consequence those bursts whose spectrum is fitted with a CPL model underestimate the value of (see also F06). The same happens for most of the Swift–BAT bursts whose spectra, due to the limited energy range of this instrument, are typically fitted with a CPL model.
In all these cases (i.e. GRB 011211, 020813, 021004, 030226, 030429, 041006, 050318, 050525A, 050820A 050922C, 051109A, 060124, 060206, 060418, 060927) we estimated as the (logarithmic) average between the value obtained assuming the cutoff–power law model that was reported in the literature and the value obtained with the same spectral parameters but with a Band model having the high energy spectral component fixed, i.e (photon spectral index) which is the average value found from the spectral analysis of GRBs (e.g. Kaneko et al. 2006). In these cases we adopted an error on which accounts for these two extreme values.
Note that, among the pre–Swift bursts, we have updated the values of with respect to the sample of N06 and F06 (for GRB 011211, 020813, 021004, 030226, 030429, 041006). Moreover, we have updated the jet break time of GRB 030226 with the most recently published estimate (Klose et al. 2004) and we have corrected a typo in the N06 table on the rest frame value of for GRB 030328 and GRB 050525A. For GRB 061121 and GRB 061007 we averaged the and values found by the analysis of the Konus–Wind and RHESSI spectra (Golenetskii et al., 2006c; Golenetskii et al., 2006b; Bellm et al. 2006). For GRB 050416A we adopted the spectral parameters (and ) calculated by S06.
Finally, in a recent work, Schaefer (2006) used some other bursts with published and which we do not include in our sample. The breaks of GRB 050318, 050505, 051022 and 060210 were in fact identified in the X–ray light curve, so we do not include these cases for the reasons explained above. However, Schaefer (2006), by adopting the jet breaks observed in the X–ray light curves of the bursts above, found that they are consistent with the correlation. Only GRB 060526 (present in the sample of Schaefer 2006) is included in our sample because Dai et al. (2006) have shown the presence of an achromatic optical/X–ray jet break at 2.77 d111GRB 060526 is present also in the sample of Schaefer (2006) but he adopted the early jet break observed in the X–ray light curve (Moretti et al. 2006).. We also considered the most distant GRB 050904 (also included in Schaefer 2006) at which has an achromatic jet break (Tagliaferri et al. 2006). We did not include this burst in our sample because its estimate is still uncertain: Amati (2006) lists a lower limit of 1100 keV (rest frame) while Schaefer (2006) lists a value of 3178 keV (rest frame). Using the latter value and the density inferred in the homogeneous case ( cm-3 – Frail et al. 2006), this burst is consistent with the correlation.
In this search we found two more bursts (i.e. GRB 060115 and GRB 060707, listed by Amati 2006) which, having a firm estimate of and , are candidates to be included in the present sample. However, for these bursts the optical light curves (publicly available at present only in form of GCNs) are poorly sampled222see also http://grad40.as.utexas.edu/grblog.php. Note finally that we did not include in the present sample GRB 060218 (associated with SN2006aj, see e.g. Mazzali et al. 2006; Campana et al. 2006) because the SN dominates the optical emission, making impossible to estimate . It is consistent with the – correlation (Amati et al. 2007), and its possible jet opening angle is discussed in Ghisellini et al. (2006).
| GRB | refa | ||||||||
|---|---|---|---|---|---|---|---|---|---|
| days | keV | erg | deg | erg | deg | erg | |||
| 970828 | 0.958 | 2.2 (0.4) | 583 (117) | 2.96e53 (0.35) | 5.91 (0.80) | 1.57e51 (0.46) | 3.40 (0.18) | 5.21e50 (0.84) | |
| 980703 | 0.966 | 3.4 (0.5) | 499 (100) | 6.90e52 (0.82) | 11.02 (0.80) | 1.27e51 (0.24) | 5.45 (0.26) | 3.12e50 (0.47) | |
| 990123 | 1.600 | 2.04 (0.46) | 2031 (161) | 2.39e54 (0.28) | 3.98 (0.57) | 5.76e51 (1.78) | 1.84 (0.12) | 1.24e51 (0.21) | |
| 990510 | 1.619 | 1.6 (0.2) | 422 (42) | 1.78e53 (0.19) | 3.74 (0.28) | 3.80e50 (0.70) | 3.31 (0.14) | 2.98e50 (0.40) | |
| 990705 | 0.843 | 1.0 (0.2) | 348 (28) | 1.82e53 (0.23) | 4.78 (0.66) | 6.33e50 (1.92) | 3.20 (0.19) | 2.84e50 (0.49) | |
| 990712 | 0.433 | 1.6 (0.2) | 93 (16) | 6.72e51 (1.29) | 9.46 (1.20) | 9.15e49 (2.90) | 8.74 (0.50) | 7.81e49 (1.74) | |
| 991216 | 1.02 | 1.2 (0.4) | 642 (129) | 6.75e53 (0.81) | 4.44 (0.70) | 2.03e51 (0.68) | 2.36 (0.21) | 5.72e50 (1.22) | |
| 011211 | 2.140 | 1.56 (0.16) | 185 (25) | 6.64e52 (1.32) | 5.25 (0.65) | 2.78e50 (0.88) | 4.03 (0.23) | 1.64e50 (0.37) | |
| 020124 | 3.198 | 3.0 (0.4) | 390 (113) | 2.15e53 (0.73) | 5.19 (0.69) | 8.82e50 (3.80) | 3.29 (0.30) | 3.54e50 (1.36) | |
| 020405 | 0.695 | 1.67 (0.52) | 617 (171) | 1.25e53 (0.13) | 6.27 (1.03) | 7.47e50 (2.57) | 4.08 (0.33) | 3.17e50 (0.62) | |
| 020813 | 1.255 | 0.43 (0.06) | 478 (95) | 6.77e53 (1.00) | 2.74 (0.35) | 7.74e50 (2.28) | 1.77 (0.10) | 3.24e50 (0.58) | |
| 021004 | 2.335 | 4.74 (0.5) | 267 (117) | 4.09e52 (0.71) | 8.27 (1.02) | 4.25e50 (1.28) | 5.91 (0.30) | 2.18e50 (0.44) | |
| 030226 | 1.986 | 0.84 (0.10) | 290 (63) | 6.7e52 (1.2) | 4.23 (0.53) | 1.83e50 (0.56) | 3.49 (0.19) | 1.24e50 (0.26) | |
| 030328 | 1.520 | 0.8 (0.1) | 328 (35) | 3.61e53 (0.40) | 3.59 (0.45) | 7.08e50 (1.93) | 2.36 (0.10) | 3.06e50 (0.42) | |
| 030329 | 0.169 | 0.5 (0.1) | 79 (3) | 1.66e52 (0.20) | 5.67 (0.50) | 8.13e49 (1.75) | 5.49 (0.32) | 7.60e49 (1.28) | |
| 030429 | 2.656 | 1.77 (1.0) | 128 (37) | 1.73e52 (0.31) | 6.15 (1.49) | 9.95e49 (5.13) | 5.60 (0.83) | 8.26e49 (2.86) | |
| 041006 | 0.716 | 0.16 (0.04) | 108 (22) | 8.3e52 (1.3) | 2.72 (0.41) | 9.38e49 (3.17) | 2.51 (0.18) | 7.94e49 (1.71) | |
| 050318 | 1.44 | 0.26 (0.13) | 115 (27) | [1]1 | 2.00e52 (0.31) | 3.42 (0.76) | 3.57e49 (1.67) | 3.70 (0.48) | 4.17e49 (1.27) |
| 050401 | 2.9 | 1.5 (0.5) | 501 (117) | [2]2 | 4.1e53 (0.8) | 3.8 (0.65) | 9.0e50 (3.5) | 2.40 (0.23) | 3.59e50 (0.98) |
| 050416A | 0.653 | 1.0 (0.7) | 28.6 (8.3) | [3]3 | 8.3e50 (2.9) | 9.77 (2.83) | 1.2e49 (0.8) | 12.66 (2.47) | 2.02e49 (1.05) |
| 050525A | 0.606 | 0.3 (0.1) | 127 (5.5) | [4]4 | 2.89e52 (0.57) | 4.03 (0.69) | 7.16e49 (2.83) | 3.88 (0.38) | 6.63e49 (1.83) |
| 050603 | 2.821 | 2.5 (1.25) | 1333 (107) | [5]5 | 5.98e53 (0.4) | 4.42 (0.97) | 1.78e51 (0.79) | 2.49 (0.31) | 5.65e50 (1.47) |
| 050820A | 2.612 | 15.2 (8) | 1325 (277) | [6]6 | 9.75e53 (0.77) | 6.65 (1.53) | 6.55e51 (3.05) | 3.50 (0.47) | 1.82e51 (0.51) |
| 050922C | 2.198 | 1.2 (0.6) | 417 (118) | [7]7 | 4.53e52 (0.78) | 4.95 (1.09) | 1.69e50 (0.80) | 4.13 (0.55) | 1.18e50 (0.37) |
| 051109A | 2.346 | 0.64 (0.32) | 539 (381) | [8]8 | 7.52e52 (0.88) | 3.61 (0.80) | 1.49e50 (0.68) | 3.08 (0.39) | 1.08e50 (0.31) |
| 060124 | 2.297 | 1.1 (0.1) | 636 (162) | [9]9 | 4.3e53 (0.34) | 3.61 (0.43) | 8.55e50 (2.15) | 2.30 (0.06) | 3.47e50 (0.34) |
| 060206 | 4.048 | 2.3 (0.11) | 381 (98) | [10]10 | 4.68e52 (0.71) | 5.31 (0.63) | 2.00e50 (0.6) | 4.3 (0.2) | 1.32e50 (0.23) |
| 060418 | 1.489 | 5.0 (2.5) | 572 (114) | [11]11 | 1.28e53 (0.10) | 8.16 (1.80) | 1.30e51 (0.58) | 4.85 (0.61) | 4.58e50 (1.21) |
| 060526 | 3.21 | 2.77 (0.30) | 105 (21) | [12]12 | 2.58e52 (0.3) | 6.56 (0.80) | 1.70e50 (0.5) | 5.47 (0.20) | 1.18e50 (0.15) |
| 060614 | 0.125 | 1.38 (0.04) | 55 (45) | [13]13 | 2.5e51 (1.0) | 11.12 (1.4) | 4.71e49 (2.22) | 11.47 (1.15) | 5.01e49 (2.23) |
| 060927 | 5.6 | 0.16 (0.08) | 473 (116) | [14]14 | 9.55e52 (1.48) | 1.62 (0.36) | 3.79e49 (1.78) | 1.73 (0.23) | 4.35e49 (1.32) |
| 061007 | 1.261 | 1.74 (0.87) | 902 (43) | [15]15 | 8.82e53 (0.98) | 4.47 (1.00) | 2.69e51 (1.22) | 2.35 (0.30) | 7.4e50 (2.1) |
| 061121 | 1.314 | 3.87 (1.9) | 1289 (153) | [16]16 | 2.61e53 (0.3) | 6.97 (1.52) | 1.93e51 (0.87) | 3.87 (0.49) | 5.96e50 (1.65) |
3 Optical breaks
In order to rely on published data we have considered all bursts with a published optical light curve and we have checked for the presence of jet breaks. In two cases (GRB 050401 and GRB 050416A), discussed below, we present our estimate of the jet break time from the fitting of the available optical data. Sato et al. 2006 claimed that these two bursts are outliers for the correlation. We show that, instead, our estimate of the jet break time makes them consistent with this correlation.
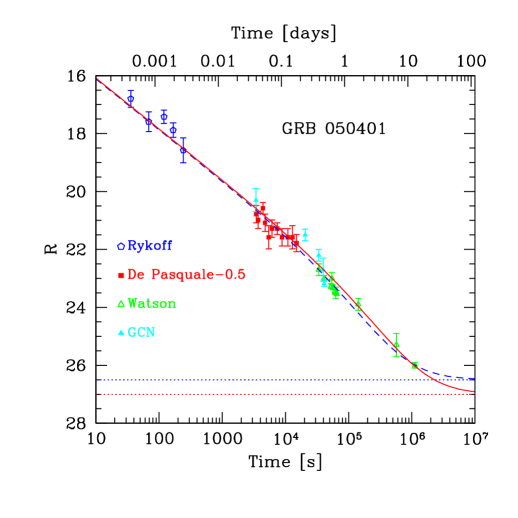
3.1 GRB 050401
We have collected the photometric data for this bursts from the literature, including the magnitude Subaru observation reported in Watson et al. (2006). In that paper, it is not specified if this magnitude is inclusive or not of the host galaxy. We have assumed this magnitude corresponds to the sum of the afterglow plus the host galaxy fluxes. De Pasquale et al. (2006) pointed out that the data in their list, while internally consistent, may have up to 0.5 magnitude uncertainty in absolute normalization when compared with data of other sources, due to the differences in the used reference stars. We have then “renormalized” these data to have a rough agreement with other observations made close in time. In addition, the magnitudes given in De Pasquale et al. (2006) were de–reddened by galactic extinction. For consistency with the other data, we have instead taken the observed magnitudes. We have then fitted a broken power law plus a constant to the data:
| (1) |
The dashed line in Fig. 1 corresponds to d; ; and ; while the solid line corresponds to d; ; and .
These results do not greatly change by adopting a different renormalization for the data of De Pasquale et al. (2006). We conclude that the data show the existence of a possible break in the optical light curve of GRB 050401, and set days.
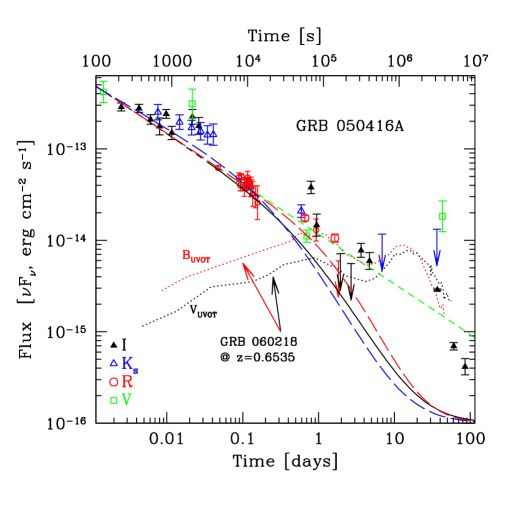
3.2 GRB 050416A
In Fig. 2 we show the optical and near IR light curve of GRB 050416A, with data taken from Soderberg et al. (2006) and Holland et al. (2007). Since the rebrightening at 10 days is most likely due to an underlying supernova (Soderberg et al. 2006), in Fig. 2 we also show the light curve of GRB 060218 (from Campana et al. 2006, dotted lines), assuming to lie at the same redshift of GRB 050416A (). It can be seen that its flux can contribute to the light curve of the afterglow even much earlier than 10–20 days. Note that the rest frame wavelengths of the and filters for GRB 0504016A roughly corresponds to the rest frame wavelengths of the and bands for GRB 060218 ().
Using Eq. 1, we have fitted these data assuming three different break times: 0.3 and 2 days (long dashed lines) and 0.8 day (solid line). The values of the decay indices changes little in all cases, being in the ranges and . Note that an unbroken power law clearly exceeds late time data (short–dash line).
We conclude that the data require the light curve to break, but the uncertainties due to the paucity of data and to the contribution from the supernova allow to determine only with a large error, therefore we set days.
3.3 GRB 050922C & GRB 060206
These two bursts have an optical light curve showing early breaks at 0.110.03 (Li et al. 2005) for GRB 050922C and days (Monfardini et al. 2006, Stanek et al. 2006) for GRB 060206. The jet breaks predicted by the correlation are instead days for GRB 050922C and days for GRB 060206 (in the HM case – to be consistent with the correlation within its 1 scatter) and for GRB 050922C and for GRB 060206 (in the WM case). The available optical light curve, in both cases, does not extend to such epochs and therefore it is not possible to say if they really have a jet break when it is expected according to the correlation.
For this reason these two bursts cannot be considered outliers of the correlation (as they would be, adopting the early optical break as the jet break) nor as lower limits for this correlation (by adopting the latest optical observation available).
3.3.1 On the possible nature of the optical breaks in GRB 050922C & GRB 060206
The early optical break in GRB 050922C (at 0.110.03 days after the BAT trigger) is 25 times larger than the break that W07 derive ( s) from a multi–component fit to the BAT–XRT light curve up to s (solid line in Fig. 3).
With s the burst is an outlier with respect to the correlation derived by the same authors, which uses as a jet break time.
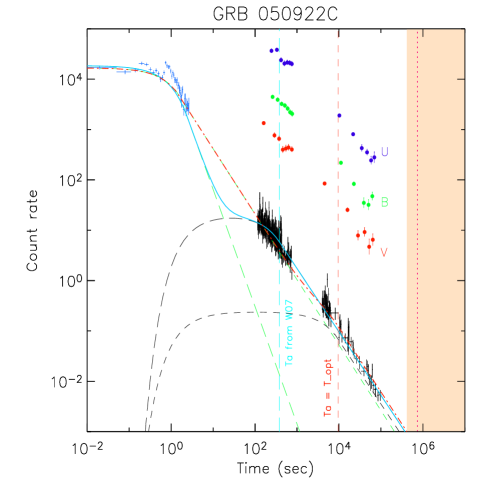
In Fig. 3 we show the early BAT light curve and the XRT light curve starting 100 s and extending to 1 day after the trigger333Data are taken from the public archive of Butler http://astro.berkeley.edu/nat/swift/.
We tried to “match” the X–ray light curve with the functional form proposed by W07 by assuming equal to the break observed in the optical light curve ( = 0.11 days – Li et al. 2005). This is shown by the dot–dashed curve in Fig. 3 (while the functional form fitted by W07 is the solid line in the same figure). We note that the two fits are consistent with the available data and suggest that might lie between the two values, i.e. 380 s (derived by W07) and the break observed in the optical (at 0.11 days). With s GRB 050922C is not an outlier with respect to the correlation defined by W07.
The published optical data of GRB 050922C end at days (Covino et al. 2005). If, according to the above interpretation, the early optical break is , we are authorized to assume days and treat this as a lower limit for the correlation.
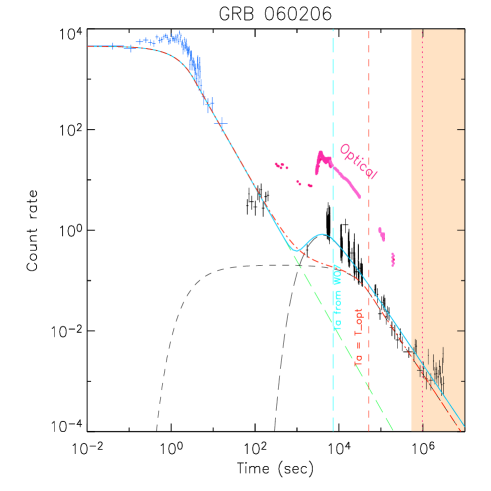
For GRB 060206 the observed early optical break (Monfardini et al. 2006, Stanek et al. 2006) in only 10 times larger than the derived by W07. However, as shown by Monfardini et al. (2006) and Stanek et al. (2006), the optical light curve presents a strong flare peaking at 3 – 4 s. The same flaring structure is present in the X–ray light curve.
We show the X–ray and optical light curve of GRB 060206 in Fig. 4 and the model function of W07 (solid line) which gives s. Similarly to the case of GRB 050922C we fitted the X–ray data by assuming days (dot-dashed line in Fig. 4) but excluding the X–ray flare coincident with that observed in the optical.
The optical data of GRB 060206 (Stanek et al. 2006) end at 2.33 days, i.e. before the epoch at which the jet break is predicted by the correlation (shaded region in Fig. 4). Therefore we assume this value as a lower limit on the jet break time of this burst.
3.4 GRB 061007
Mundell et al. (2007) claim that GRB 061007 is an outlier with respect to the and correlations because no break is observed up to 106 s in the X–ray light curve. For the arguments detailed above (see also Sec. 5) we do not consider the X–ray light curve. We instead take the lower limit on the jet break set by the latest optical observation at 1.7 d (Mundell et al. 2007; Shady et al. 2006). In this case the correlation predicts a jet break between 0.7 and 2.2 days (1 in the HM case) and 0.8 and 2.4 days (1 in the WM case).
4 Results
We first recomputed the – correlation in the case of a homogeneous and wind–like medium and then the phenomenological correlation following the method described in N06.
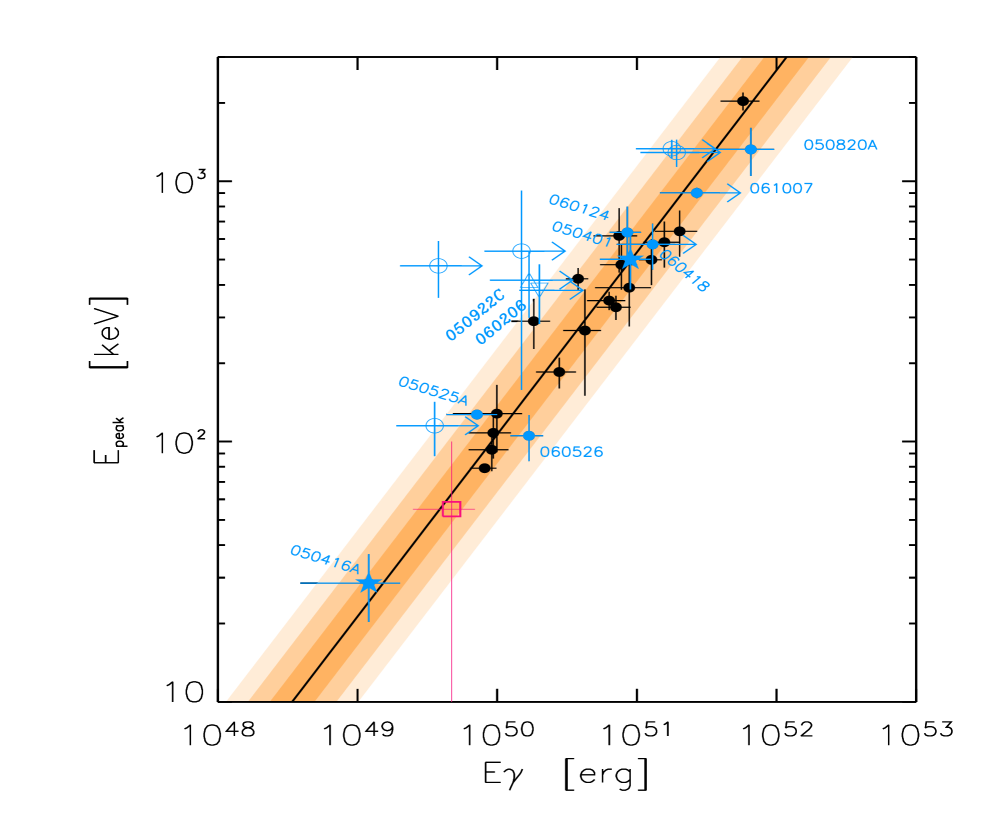
To the pre–Swift bursts included in the N06 sample (17 GRBs – excluding GRB 050525A which is a Swift burst – with measured jet break time) we add 16 new Swift GRBs. The results using our total sample of 33 GRBs are presented in Fig. 5, Fig. 6, and Fig. 7: all points and lower limits are consistent with these correlations and there are no outliers.
Following the discussion of Sec. 2 and Sec. 3 we found 9 (out of 16) bursts which have only a lower limit on their jet break (as discussed at the end of Sec. 3 we include in the subsample of lower limits also GRB 050922C and GRB 060206). Among these 9 lower limits there are 2 GRBs (i.e. 061007 and 060418) which lie on the right side of the correlation (see Figg. 5, 6, 7). These 2 bursts were used for the statistical analysis of the correlations.
In 7 cases (out of 16) the jet break was measured in the optical light curve (in 5 cases was already published in the literature and in 2 bursts it is found for the first time in this work - Sec. 3). However, we did not consider in the statistical analysis GRB 060614. This bursts, in fact, although fully consistent with both these correlations444 Note that the published spectral parameters of GRB 060614 make its peak energy poorly constrained. This is the reason of the shown large uncertainties. (as shown by the open square symbol in Figg. 5, 6, 7), was claimed to represent a new class of bursts (see Gehrels et al. 2006; Della Valle et al. 2006b). Therefore, the sample of Swift GRBs added to the correlations and effectively used in their statistical analysis is composed by 6 bursts with firm jet break measurements (GRB 050401, 050416A, 050525A, 050820A, 060124, 060526) and 2 bursts with lower limits on (GRB 060418 and 061007). These, added to the pre–Swift sample of 17 bursts, bring to 25 the total number of GRBs used for the statistical analysis.
We fitted the correlations by weighting for the errors on the involved quantities (with the fitexy routine of Press et al. 1999). We also evaluated the scatter of the data points computed perpendicularly to the best fit line.
4.1 The correlation in the HM case
We recomputed the – correlation in the homogeneous medium case. The jet opening angle is:
| (2) |
where is the redshift, is the radiative efficiency and is the break time measured in days of the afterglow light curve555 Here we adopt the notation , and use cgs units unless otherwise noted.. The efficiency relates the isotropic kinetic energy of the fireball after the prompt phase, , to the prompt emitted energy , through . This implicitly assumes that otherwise the remaining kinetic energy after the prompt emission is instead . This efficiency, in principle, could be different from burst to burst, but in the absence of any hints of how its value changes as a function of other properties of the bursts and favored by its low power in Eq. 2, one assumes a constant value for all bursts, i.e. (after its first use by Frail et al. 2001, following the estimate of this parameter in GRB 970508).
The values of and in the HM case are reported, for all GRBs, in Tab. 1. With these values the correlation (shown in Fig. 5) is
| (3) |
with a reduced for 23 degrees of freedom. The errors on its slope and normalization are calculated in the “barycenter” of and , where the slope and normalization errors are uncorrelated (Press et al. 1999). The scatter of the data points around this correlation is distributed as a Gaussian with .
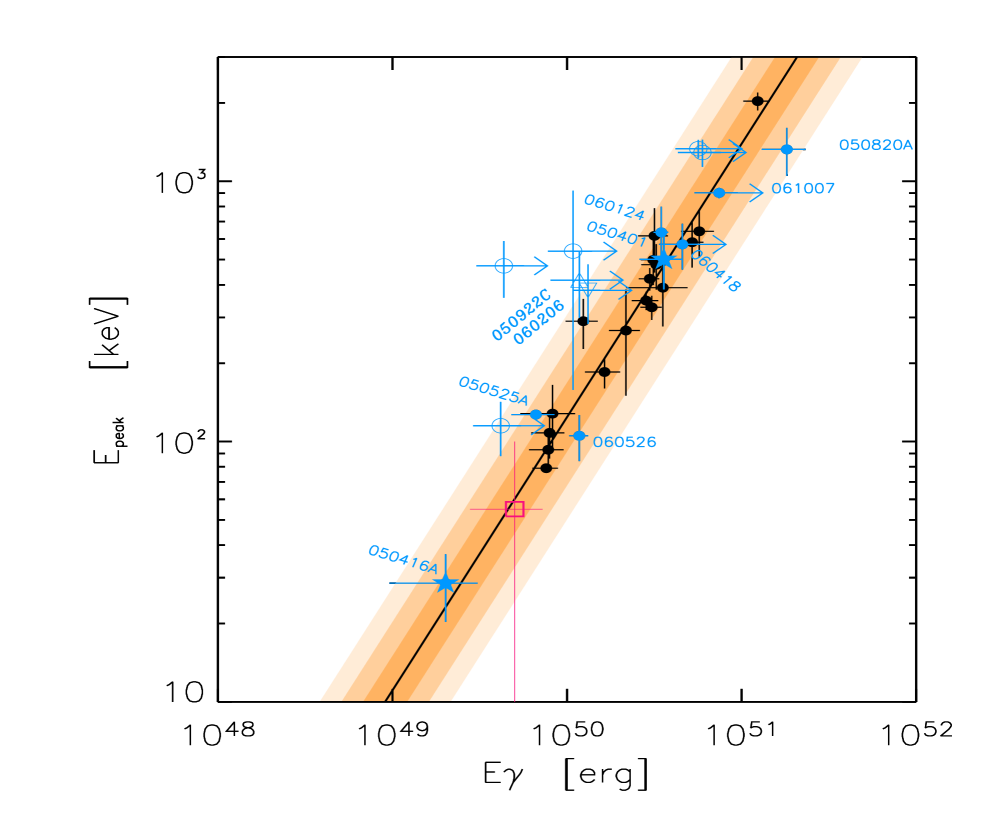
4.2 The correlation in the WM case
If the external medium is distributed with an density profile the semiaperture angle of the jet is related to the achromatic jet break through (Chevalier & Li 2000):
| (4) |
where we assume and is the value of ( g cm-1 ) when setting the mass loss rate due to the wind yr-1 and the wind velocity km s-1, according to the typical Wolf–Rayet wind physical conditions. Given the few still uncertain estimates of the parameter, we assume a constant value (i.e. ) for all bursts neglecting the unknown uncertainty on this parameter.
The fit with a power law model gives
| (5) |
with a reduced for 23 degrees of freedom (see Fig. 6). Note that the slope of this relation is entirely consistent with unity. The scatter of the points around the best fit correlation is fitted by a gaussian with .
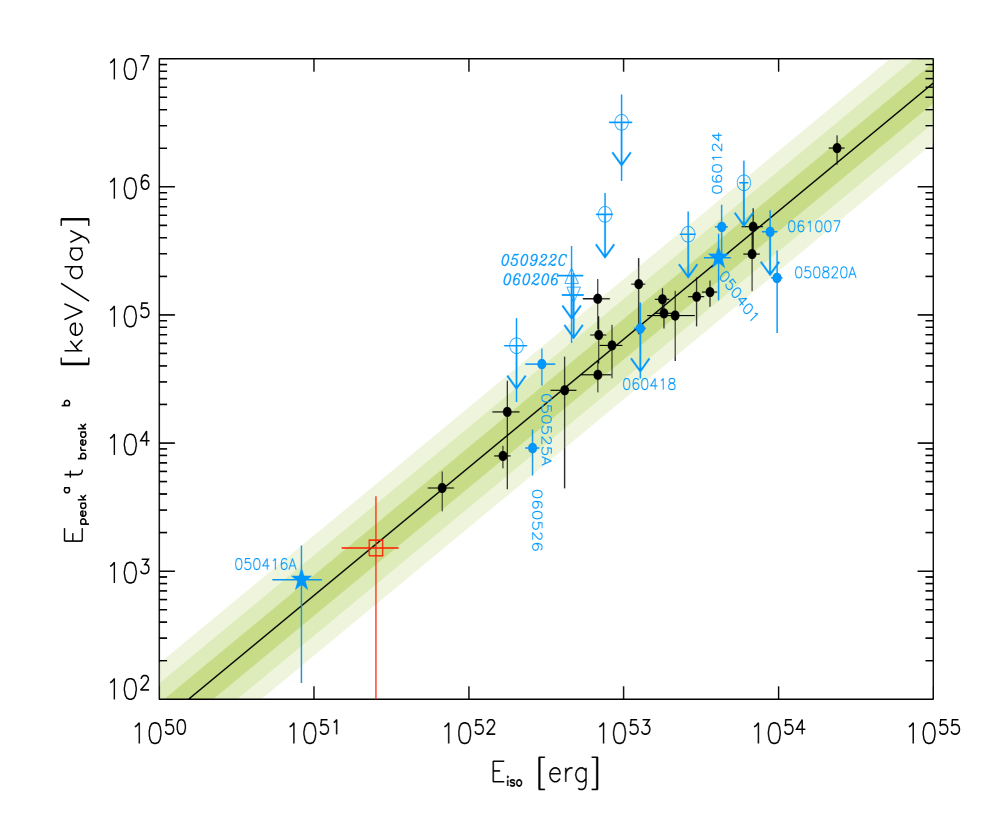
4.3 The correlation
We have extended the 2D fit which weights for the errors on two quantities to the 3D case for the correlation. This fit weights the multidimensional errors on the three independent variables , and , where the peak energy and the jet break time are computed in the source rest frame. We find
| (6) |
with a reduced for 22 degrees of freedom. The scatter of the data points around the correlation is .
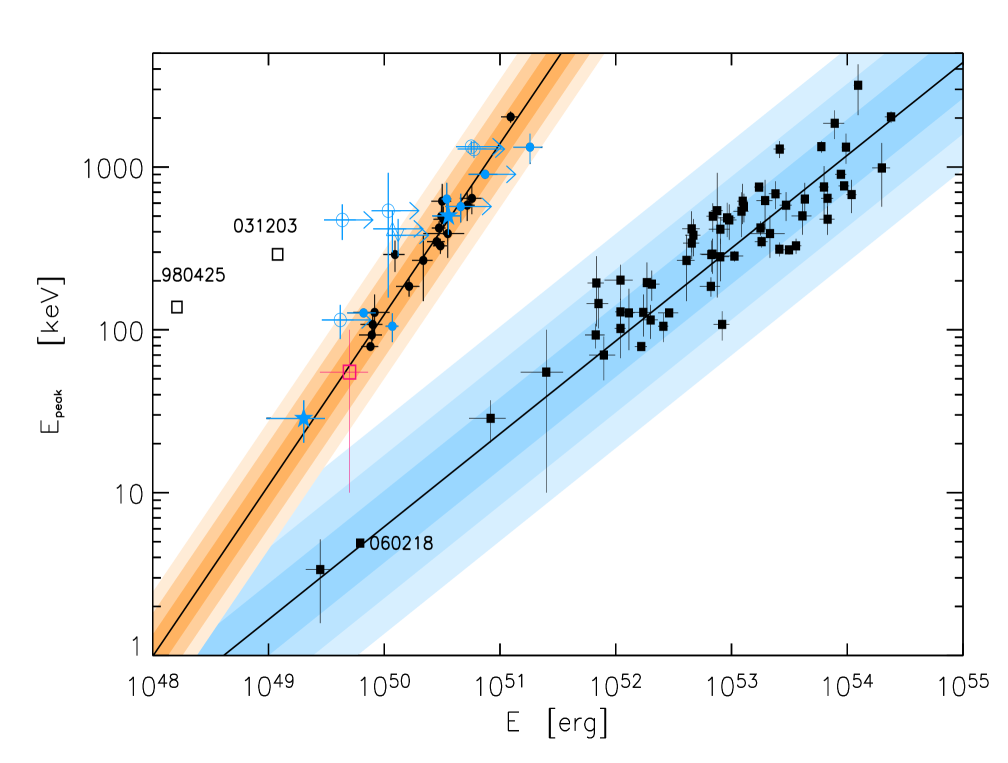
4.4 The Amati versus Ghirlanda correlation
Since we have discussed the most updated correlation we also compare it with the most updated (up to Jan. 2007) correlation. Besides the GRBs in Tab.1 we have added those GRBs with and known (excluding upper/lower limits) taken from the lists of Amati (2006) and Nava et al. (2007). We found a total of 64 GRBs. They are shown in Fig.8 (squares) with the correlation in the wind case. The fit of the correlation (using the fitexy routine and excluding the two outliers GRB 980425 and GRB 031203) is:
| (7) |
with a reduced for 60 dof. The scatter of the data points around the best fit is distributed as a Gaussian with .
From the comparison of the two correlations and their scatter it is noticeable how the dispersion of the data points is reduced from the Amati to the Ghirlanda relation, especially considering bursts with similar . Note that the different slopes of the Amati and Ghirlanda correlation imply that they intersect at some small value of corresponding to truly isotropic bursts. The intersection value, however, depends on the circumbursts density profile: it is below erg in the WM and smaller for the HM case.
5 Discussion and conclusions
In the era of multiple breaks of the X–ray and optical afterglow light curves the identification of the jet break time is complex. Even more so when flares (more often in the X–rays, but sometimes also in the optical) occur, and the lightcurve is not densely sampled. In the following, for clarity, we list some points which we believe are particularly important for the correct identification of the jet break time.
-
•
The jet break should be observed in the optical.
-
•
The light curve in the optical should extend up to a time longer than the jet break time predicted by the correlation.
-
•
The host galaxy and a possible supernova flux should be subtracted off.
-
•
The break should be achromatic in the optical, but we should relax the requirement of a simultaneous break in the X–ray light curve, since the X–ray flux may be due to another component.
-
•
If a simultaneous X–ray and optical break is present, one should check that this is not the time break ending the plateau phase ( in Willingale et al. 2007). If this is the case, and the optical and X–ray flux continue to track one another, it is possible that the component dominating the X–ray flux is also contributing in the optical, hiding any jet–break.
-
•
A steep [i.e. , with ] optical decay in a limited time interval is not necessarily an indication of a jet break occurred earlier. A steep decay can in fact be the tail of a flare. A densely sampled light curve is required to disentangle this case from a post–break light curve.
-
•
The bolometric luminosity should be calculated between 1 keV and 10 MeV in the rest frame of the GRB, using the spectral parameters. It is also useful, when a cut-off power law is used instead of the Band function, to give limits by using a Band model with a fixed –value.
-
•
Sometimes the Swift/BAT and the Konus–Wind data give different spectral fits. Given the limited energy range of BAT, one should take the result of spectral fitting the BAT data with care.
-
•
An outlier for the correlation which is also an outlier for the - correlation, while being an outlier, is “recognizable” and should be put in the same category of GRB 980425 and GRB 031203.
-
•
When deriving jet–angles from the jet break times, the same values of the efficiency should be used. One should also allow for a range in possible densities of the interstellar medium (taken in the range 1–10 cm-3 in GGL04), when this is not derived by other means. Of course this does not apply to the correlation.
Following these rules we have selected, among all Swift long bursts with firm redshift measurements (46 long GRBs up to Dec. 2006), those with measured peak energy and some information about a jet break in the optical light curve. We have found 16 Swift bursts that can be added to the pre–Swift sample of 17 GRBs (N06). In the present sample of 33 events there is no outlier with respect to the and correlations (besides GRB 980425 and GRB 031203 – but see Ghisellini et al. 2006 for the possibility that even these two GRBs are not outliers). Indeed, these correlations are strengthened by the new Swift bursts. In particular we added 6 firm bursts (i.e. with defined , and ) and 2 lower limits (on ) which enlarge to 25 the original sample of pre–Swift busts used to fit these correlations. With this sample we re–analyzed the correlation in the two possible scenarios of a homogeneous and wind medium (HM and WM). The updated correlations are completely consistent with those found in the pre–Swift era and their fits are statistically improved (i.e. and in the HM and WM case, respectively). We also re–analyzed the phenomenological correlation which turns out to be consistent with what found before Swift (Liang & Zhang 2005; N06). The dispersion around these correlations (computed with 25 GRBs) is described by a Gaussian with 0.08–0.1 in all the three cases. Such dispersions are consistent with being due to measurement errors only.
The confirmation of the and correlations by the Swift GRBs also supports the possibility, with an increasingly larger sample of GRBs, to use them as standard candles to constrain the cosmological parameters (e.g. Ghirlanda, Ghisellini & Firmani 2006).
The complexity of the afterglow light curves, disclosed by the Swift observations, certainly makes less direct and unambiguous the determination of the jet break time, with respect to the pre–Swift era. There are GRBs with multiple breaks and flares, even in the optical band, and this makes mandatory to have well sampled light curves beyond the jet break timescale predicted by the and the correlations.
Acknowledgements.
We thank the referee, J. Norris, for his constructive and encouraging comments, and F. Tavecchio for useful discussion. This work made use of processed Swift data obtained from the public archive of N. Butler (http://astro.berkeley.edu/nat/swift/). We thank a PRIN–INAF 2005 grant for funding.References
- (1) Amati, L., Frontera, F., Tavani, M., et al. 2002, A&A, 390, 81
- (2) Amati, L., 2006, MNRAS, 372, 233
- (3) Amati, L., Della Valle, M., Frontera, F., Malesani, D., Guidorzi, C., Montanari, E., Pian, E., 2007, A&A, in press (astro–ph/0607148)
- (4) Atoniuk et al. 2006, GCN, 5647;
- (5) Band D. L., et al., 1993, ApJ, 413, 281
- (6) Bloom J. S., Frail D. & Kulkarni S., 2003, ApJ, 594, 674
- (7) Blustin, A.J., Band, D., Barthelmy, S., et al. 2006, ApJ, 637, 901
- (8) Burrows D. N., et al., 2005, Sci, 309, 1833
- (9) Burrows D. N., et al., 2007, preprint (astro-ph/0701046)
- (10) Butler, N.R. & Kocevski, D., 2007, subm. to ApJ (astro–ph/0612564)
- (11) Campana, S., et al., Nature, 442, 1008
- (12) Cenko, S.B., Kasliwal, M., Harrison, F.A., et al. 2006, ApJ, 652, 490
- (13) Covino S. et al., 2005, GCN, 4046
- (14) Crew, G., Ricker, G., Atteia, J-L., et al. 2005, GCN, 4021
- (15) Curran P. A., et al., 2006, subm. to A&A, (astro–ph/0610067)
- (16) D’Avanzo, P., Fugazza, D., Masetti, N. & M. Pedani, M., 2005, GCN 3171
- (17) Dai et al., 2006, subm. to ApJ (astro-ph/0609269);
- (18) Della Valle M., et al., 2006b, Nature, 444, 1050
- (19) Della Valle et al., 2006a, ApJ, 642, L103
- (20) De Pasquale, M., Beardmore, A.P., Barthelmy, S.D., et al., 2006, MNRAS, 365, 1031
- (21) Frail D. et al., 2001, ApJ, 562, L55
- (22) Firmani et al., 2006, MNRAS, 370, 185 (F06)
- (23) Firmani et al., 2006a, MNRAS, 372, L28
- (24) Firmani et al., 2006b, RMAA in press (astro-ph/0605267)
- (25) Gehrels, N., Chincarini, G., Giommi P., et al., 2004, ApJ, 611, 1005
- (26) Gehrels, N., et al., Nature in press (astro-ph/0610635)
- (27) Ghirlanda, G., Ghisellini, G. & Lazzati, D. 2004, ApJ, 616, 331 (GGL04)
- (28) Ghirlanda, G., Ghisellini, G. & Firmani, C., 2006, Focus on Gamma-Ray Bursts in the Swift Era New J. Phys. 8 123 ( http://www.iop.org/EJ/abstract/1367-2630/8/7/123 )
- (29) Ghisellini, G., Ghirlanda, G., Mereghetti, S., Bosnjak, Z., Tavecchio, F., & Firmani C., 2006, MNRAS, 372, 1699
- (30) Ghisellini, G., Ghirlanda, G., Nava, L., & Firmani, C., 2007, subm. to ApJ (astro-ph/0701430)
- (31) Golenetskii, S., Aptekar, R., Mazets, E., Pal’shin, V., Frederiks, D., & Cline, T. 2005a, GCN, 3179
- (32) Golenetskii, S., Aptekar, R., Mazets, E., Pal’shin, V., Frederiks, D., & Cline, T. 2005b, GCN, 3518
- (33) Golenetskii, S., Aptekar, R., Mazets, E., Pal’shin, V., Frederiks, D., & Cline, T. 2005c, GCN, 4238
- (34) Golenetskii, S., Aptekar, R., Mazets, E., Pal’shin, V., Frederiks, D., Ulanov, M., & Cline, T. 2006a, GCN, 4989
- (35) Golenetskii, S., Aptekar, R., Mazets, E., Pal’shin, V., Frederiks, D., & Cline, T. 2006b, GCN, 5837
- (36) Golenetskii, S., Aptekar, R., Mazets, E., Pal’shin, V., Frederiks, D., & Cline, T. 2006c, GCN, 5722
- (37) Greco, G., Bartolini, C., Guarnieri, A., Piccioni A., Pizzichini, G., Bernabei, S. & Marinoni, S., 2005, GCN 3319
- (38) Grenet, F., Daigne, F. & Mochkovitch, R., 2007, subm. to MNRAS (astro–ph/0701204)
- (39) Grupe et al., 2006, ApJ, 645, 464
- (40) Halpern J. P. & Armstrong E., 2006, GCN, 5853
- (41) Holland, S.T., Boyd, P.T., Gorosabel, J., et al., 2007, AJ, 133, 122
- (42) Kahharov, B., Ibrahimov, M., Sharapov D., A.Pozanenko, A., Rumyantsev, V. & Beskin G., 2005, GCN 3174
- (43) Kaneko Y. et al., 2006, ApJ, 166, 298
- (44) Karimov et al., 2005, GCN, 5112;
- (45) Lamb et al. 2004, NewAR, 48, 423
- (46) Li, W., Jha, S., Filippenko, A.V., Bloom, J.S., Pooley, D., Foley, R.J. & Perley, D.A., 2005, GCN 4095
- (47) Liang, E. & Zhang, B., 2005, ApJ, 633, L611
- (48) McNaught, R. & Price, P.A., 2005, GCN 3163
- (49) Mirabal et al. 2005, GCN, 3488
- (50) Misra, K., Kamble, A.T., & Pandey, S.B., 2005, GCN 3175
- (51) Nava, L., Ghisellini, G., Ghirlanda, G., Tavecchio, F. & Firmani, C. 2006, A&A, 450, 471 (N06)
- (52) Nava, L. et al., 2007, subm. to MNRAS (astro–ph/0701705)
- (53) Nousek J., et al., 2006, ApJ, 642, 389
- (54) O’Brien et al., 2006,, ApJ, 647, 1213
- (55) Palmer, D., Barbier, L., Barthelmy, S., et al. 2006, GCN, 4697
- (56) Panaitescu, A., 2007, Il Nuovo Cimento, in press (astro–ph/0607396)
- (57) Pavlenko et al., 2005, GCN, 4273;
- (58) Perri, M., Giommi, P., Capalbi, M., et al. 2005, A&A, 442, L1
- (59) Preece R. D., et al., 2000, ApJSS, 126, 19
- (60) Press, W.H. et al. 1999, Numerical Recipes in C, Cambridge University Press, 661
- (61) Rhoads J., 1997, ApJ, 487, L1
- (62) Romano, P., Campana, S., Chincarini, G., et al. 2006, A&A, 456, 917
- (63) Rykoff, E.S., Yost, S.A., Krimm, H.A., et al., 2006, ApJ, 631, L121
- (64) Sari R., Piran T. & Halpern J. P., 1999, ApJ, 519, L17
- (65) Sato, G., Yamazaki, R., Ioka, K., et al. 2006, ApJ in press (astro-ph/0611148) (S06)
- (66) Schaefer, B.E. 2006, astro-ph/0612285
- (67) Shady et al., 2006, subm. to MNRAS (astro-ph/0611081)
- (68) Soderberg, A.M., Nakar, E., Cenko, S.B., et al., 2006, subm. to ApJ (astro–ph/0607511)
- (69) Stamatikos, M., Barbier, L., Barthelmy, S., et al. 2006, GCN, 5639
- (70) Still et al., 2005, ApJ,365, 1187
- (71) Thompson, C., 2006, ApJ, 651, 333
- (72) Thompson, C., Meszaros, P. & Rees, M.J., 2007, subm. to ApJ, (astro–ph/0608282)
- (73) Uhm, L.Z. & Beloborodov, A.M., 2007, subm. to ApJ, (astro–ph/0701205)
- (74) Vergani S. et al., 2007, in preparation
- (75) Zhang B., 2007, Adv. in Space Res. in press (astro-ph/0611774)
- (76) Watson, D., Fynbo, J.P.U., Ledoux, C., et al., 2006, ApJ, 652, 1011
- (77) Willingale, R., O’Brien, P.T., Osborne, J.P., et al., 2007, subm. to ApJ (astro–ph/0612031) (W07)