A Common Explosion Mechanism for Type Ia Supernovae
Type Ia supernovae, the thermonuclear explosions of white dwarf stars composed of carbon and oxygen, were instrumental as distance indicators in establishing the acceleration of the universe’s expansion. However, the physics of the explosion are debated. Here we report a systematic spectral analysis of a large sample of well observed type Ia supernovae. Mapping the velocity distribution of the main products of nuclear burning, we constrain theoretical scenarios. We find that all supernovae have low-velocity cores of stable iron-group elements. Outside this core, nickel-56 dominates the supernova ejecta. The outer extent of the iron-group material depends on the amount of nickel-56 and coincides with the inner extent of silicon, the principal product of incomplete burning. The outer extent of the bulk of silicon is similar in all SNe, having an expansion velocity of and corresponding to a mass of slightly over one solar mass. This indicates that all the supernovae considered here burned similar masses, and suggests that their progenitors had the same mass. Synthetic light curve parameters and three-dimensional explosion simulations support this interpretation. A single explosion scenario, possibly a delayed detonation, may thus explain most type Ia supernovae.
When a white dwarf (WD) composed of carbon and oxygen accreting mass from a companion star in a binary system approaches the Chandrasekhar mass [ solar masses ()], high temperature causes the ignition of explosive nuclear burning reactions that process stellar material and produce energy. The star explodes leaving no remnant, producing a Type Ia supernova (SNIa) (?). At high stellar material densities, burning yields nuclear statistical equilibrium (NSE) isotopes, in particular radioactive 56Ni which decays to 56Co and 56Fe making the SN bright (?). At lower densities intermediate mass elements (IME) are synthesised. Both groups of elements are observed in the optical spectra of SNeIa (?). An empirical relation between an observed quantity, the B-magnitude decline over the first 15 days after maximum luminosity [] and a physical quantity, the SN maximum luminosity (?), can be used to determine the distance to a SNIa. This method was applied to very distant SNeIa leading to the discovery of the accelerating Universe (?, ?). How the explosion actually proceeds is however debated (?, ?, ?), as is the nature of the progenitor system: Accretion may occur either from a more massive companion (e.g. a giant) or via the merging of two carbon-oxygen WDs (?). This casts a shadow on the reliability of SNeIa as distance indicators, as intrinsically very different explosions may result in the observed correlation.
We derive the distribution of the principal elements in 23 nearby SNeIa (distances ) with good spectral coverage extending from before maximum to the late nebular phase, about one year later. The sample (table S1) covers a wide range of light-curve decline rates and includes peculiar objects like SN2000cx, which violates the luminosity-decline-rate relation.
Because of the hydrodynamic properties of the explosion, the expansion velocity of the ejecta is proportional to radius and serves as a radial coordinate. As the SN expands, deeper layers are exposed. The outer layers, visible in the first few weeks after the explosion, are dominated by IME. Because silicon is the most abundant IME, we measured its characteristic expansion velocity from the blueshift of the absorption core of the strong SiII line in all spectra where it was visible. This velocity decreases with time. Fitting the postmaximum velocity evolution and extrapolating it to the earliest times, when the outermost parts of the ejecta are visible, we derived the outer extension of the bulk of Si. This represents a lower limit of the outer extent of burning. The Si velocity is similar in all SNeIa, regardless of their luminosity: .
A few SNe, defined as High Velocity Gradient (HVG) SNe (?), are responsible for most of the dispersion. They have a rapidly decreasing (Si) before maximum and very high-velocity CaII lines, possibly the result of high-velocity blobs that carry little mass and kinetic energy but cause High-Velocity absorption Features (HVF, (?)) that can abnormally broaden the SiII line profile (?, ?). Although excluding them from the sample decreases the dispersion in (Si) significantly [], we include all these SNe in our discussion.
The maximum Si velocity thus measured is a conservative estimate. The deep absorption core is produced in layers of high silicon abundance. Silicon is present at higher velocities, indicated by the wavelength of bluest absorption in the earliest spectrum of each SN. However, measuring the bluest absorption velocity yields a large scatter because the earliest spectra have different epochs and may be affected by HVFs (?). Our method reliably determines the outer location of the bulk of IMEs.
The inner extent of Si, determined from the asymptotic velocity of the SiII 6355 Å line in post-maximum spectra [fig. 1 in (?)], is a steep function of . The brightest (slowest declining) SNe have the thinnest Si zones.
The inner ejecta, dominated by NSE elements, are best observed 1 year after the explosion, when dilution caused by expansion makes the SN behave like a nebula, exposing the deepest layers. Collisions with the fast particles produced by the decay 56Ni56Co56Fe heat the gas, which cools emitting radiation mostly in forbidden lines.
We modeled the nebular spectra using a code that computes line emission balancing heating and cooling in non-local thermodynamic equilibrium (NLTE) (?), including density and abundance stratification. We adopted the density-velocity distribution of the standard, one-dimensional, explosion model W7 (?), (fig. S1). In the nebular phase the gas is transparent, and line emissivity depends on the mass of the emitting ion. Accurately estimating this mass requires determining the ionization state of the gas. Forbidden lines of FeII and FeIII dominate SNIa nebular spectra, reflecting the high abundance of NSE material. Fe is mostly the product of 56Ni decay, which provides heating. The stable, neutron-rich isotopes 54Fe and 58Ni do not contribute to heating, but do contribute to cooling, because they also emit forbidden lines. Their presence affects the ionization balance. Both are mostly produced deep in the WD, at the highest densities. The 54Fe nebular lines have wavelengths indistinguishable from those of 56Fe.
We determined the mass and distribution in velocity of the Fe isotopes (and thus of 56Ni) simultaneously fitting the ratio of the two strongest Fe emissions(fig. S1). One, near 4700 Å includes both FeII and FeIII lines, while the other, near 5200 Å, is only due to FeII. A low upper limit to the mass of 58Ni is set by the absence of strong emission lines (in particular at 7380 Å).
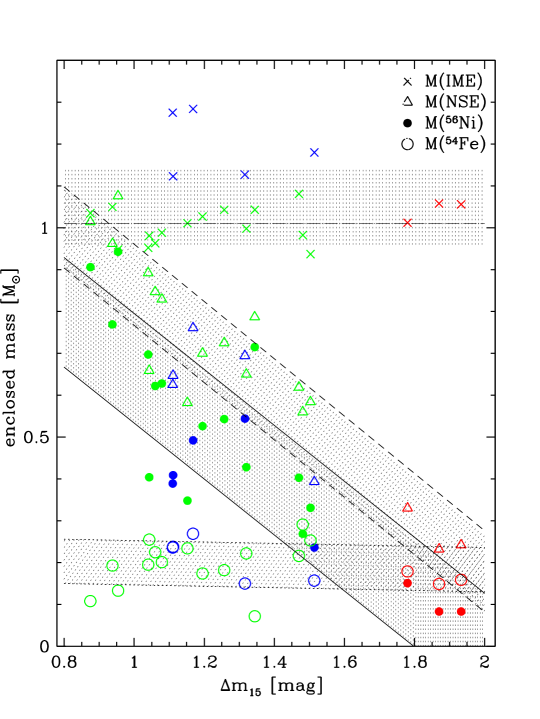
In the deepest layers (Fig. 1), all SNe contain 0.1 to of stable NSE isotopes, with a large scatter and no dependence on [see also (?)].
As expected, the 56Ni mass correlates inversely with , ranging from for the slowest declining (most luminous) SNe to for the fastest declining (dimmest) ones. The root mean square (rms) dispersion is , but SNe with intermediate decline rates [ to ] show variations of almost a factor of 2 for the same value of . These SNe could cause scatter about the mean luminosity-decline-rate relation (?).
Once the contributions of 56Ni, 54Fe, and 58Ni are added together to evaluate the total NSE mass, the dispersion decreases to . If SNe with different amounts of 56Ni, and thus presumably different temperatures, but similar NSE content have similar , it is likely that abundances (?) rather than temperature (?) primarily determine the opacity and light-curve shape.
The outer velocity of the NSE region, determined from the width of the Fe lines, correlates with SN luminosity (?). It coincides with the innermost silicon velocity, marking the transition from complete to incomplete burning: the difference between these two velocities, , is consistent with zero. Remarkably, this results from two different methods applied to data obtained almost 1 year apart.
Thus, while the mass of 56Ni, and consequently the SN luminosity, can differ significantly, other characteristics of SNeIa are remarkably homogeneous. In particular, the narrow dispersion of the outer Si velocity indicates a similar extent of thermonuclear burning in all SNeIa: SNe that produce less 56Ni synthesize more IMEs.
The simplest interpretation of these seemingly antithetic results is that thermonuclear burning consumes similar masses in all SNeIa. We explore whether this scenario is consistent with the model (?). Applying the density-velocity structure of model W7 (?), we transform (Si) to mass (Fig. 1). We find that the outer shell of silicon encloses a mass of at least (, excluding HVG SNe), independently of . This is a lower limit to the burned mass.
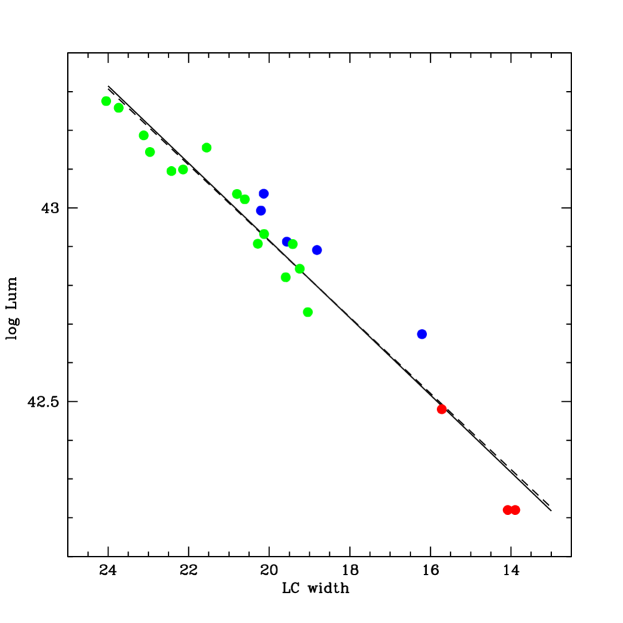
The light-curve width is related to (?) and depends on the ejected mass , the kinetic energy , and the opacity as (?). We test our assumption computing parametrized light-curve widths and comparing them to observed values. The resulting luminosity-decline-rate relation (Fig. 2) is very tight, and practically identical to the observed one. This result supprots our opacity parametrization, corroborating our hypothesis that the mass burned is similar in all SNeIa. Given its weak dependence on , the light-curve width is not much affected if more of the outer part of the WD is burned to IME, as these do not contribute much to the opacity.
If SNeIa burn a similar mass, the progenitor mass is also likely to be the same, namely . Because the outcome of the burning depends essentially on fuel density, a variation in iron-group elements production in WDs requires different WD expansion histories. This in turn depends on the details of the burning. Once the WD reaches , a thermonuclear flame is ignited near the center. The flame must start as a subsonic deflagration (?), mediated by microphysical transport and accelerated by turbulence. As it propagates outwards, it could undergo a deflagration-to-detonation transition (DDT) and continue as a shock-driven supersonic detonation wave, in a so-called delayed detonation (?). This constitutes the most extreme explosion scenario admissible, exploring the limits of explosions.
model ) (s) () D800 1.004 0.638 0.547 0.675 2.40 D20 1.237 0.833 0.435 0.724 1.92 D5 1.524 1.141 0.220 0.731 1.33
We modeled the explosion using a three-dimensional level-set approach (?). The ignition of the deflagration flame was treated as a stochastic process generating a number of ignition spots placed randomly and isotropically within of the WD centre (?).
What would cause the DDT is unclear. We assumed that it occurs as turbulence penetrates the internal flame structure: the onset of the so-called distributed burning regime (?). This happens at low fuel densities, after some WD pre-expansion in the deflagration phase. The detonation is triggered artificially where the chosen DDT criterion is first satisfied, typically near the outer edges of the deflagration structure (Table 1 shows DDT parameters). Three simulations, with 800, 20, and 5 ignition spots, termed D800, D20, and D5, respectively, were performed on a moving cellular Cartesian grid (?) comprising the full star. Model D800, with its dense distribution of ignition points, exhausts the carbon-oxygen fuel at the WD centre almost completely in the deflagration phase. The energy release quickly expands the star, and the subsequent detonation mainly transforms low density outer material to IME. In contrast, the few ignition spots of model D5 consume little material during the deflagration, leaving more fuel at high densities which is converted mostly to NSE isotopes in the vigorous detonation phase. Model D20 provides an intermediate case.
The ejecta compositions of the model explosions agree grossly with the results derived from the spectra. The NSE mass produced ranges from 0.638 to 1.141. The weakest explosions result from optimal burning in the deflagration phase (?), and subluminous SNeIa are not reached in our parametrization. However, the conditions for DDT need further investigation. Eventually these events may be explained within a single framework. Some extremely luminous SNeIa may come from very rapidly rotating WDs whose mass exceeds (?), but these are rare.
The distribution derived from observations of burning products inside SNeIa could result from the variation of a single initial parameter, the flame ignition configuration, in MCh delayed detonations. The luminosity-decline-rate relation can be reproduced using this distribution and a simple opacity parametrization. Our results support the MCh scenario for most SNeIa, adding confidence to their use as distance indicators.
References and Notes
- 1. K. Nomoto, F.-K. Thielemann, K. Yokoi, ApJ 286, 644 (1984).
- 2. M. J. Kuchner, R. P. Kirshner, P. A. Pinto, B. Leibundgut, ApJ 426, L89 (1994).
- 3. D. Branch, J. B. Doggett, K. Nomoto, F.-K. Thielemann, ApJ 294, 619 (1985).
- 4. M. M. Phillips, ApJ 413, L105 (1993).
- 5. A. G. Riess, et al., AJ 116, 1009 (1998).
- 6. S. Perlmutter, et al., ApJ 517, 565 (1999).
- 7. M. Reinecke, W. Hillebrandt, J. C. Niemeyer, A&A 391, 1167 (2002).
- 8. V. N. Gamezo, A. M. Khokhlov, E. S. Oran, Physical Review Letters 92, 211102 (2004).
- 9. T. Plewa, A. C. Calder, D. Q. Lamb, ApJ 612, L37 (2004).
- 10. W. Hillebrandt, J. C. Niemeyer, ARA&A 38, 191 (2000).
- 11. S. Benetti, et al., ApJ 623, 1011 (2005).
- 12. P. A. Mazzali, et al., ApJ 623, L37 (2005).
- 13. M. Tanaka, P. A. Mazzali, K. Maeda, K. Nomoto, ApJ 645, 470 (2006).
- 14. P. A. Mazzali, K. Nomoto, F. Patat, K. Maeda, ApJ 559, 1047 (2001).
- 15. S. E. Woosley, D. Kasen, S. Blinnikov, E. Sorokina, ArXiv Astrophysics e-prints astro-ph/0609562 (2006).
- 16. P. A. Mazzali, P. Podsiadlowski, MNRAS 369, L19 (2006).
- 17. P. A. Mazzali, et al., ApJ 547, 988 (2001).
- 18. D. Kasen, S. E. Woosley, astro-ph/0609540 (2006).
- 19. P. A. Mazzali, E. Cappellaro, I. J. Danziger, M. Turatto, S. Benetti, ApJ 499, L49 (1998).
- 20. G. Goldhaber, et al., ApJ 558, 359 (2001).
- 21. W. D. Arnett, ApJ 253, 785 (1982).
- 22. A. M. Khokhlov, A&A 245, 114 (1991).
- 23. I. Golombek, J. C. Niemeyer, A&A 438, 611 (2005).
- 24. S. E. Woosley, S. Wunsch, M. Kuhlen, ApJ 607, 921 (2004).
- 25. J. C. Niemeyer, S. E. Woosley, ApJ 475, 740 (1997).
- 26. F. K. Röpke, W. Hillebrandt, J. C. Niemeyer, S. E. Woosley, A&A 448, 1 (2006).
- 27. D. A. Howell, et al., Nature 443, 308 (2006).
- 28. M. Stritzinger, B. Leibundgut, A&A 431, 423 (2005).
- 29. G. Contardo, B. Leibundgut, W. D. Vacca, A&A 359, 876 (2000).
- 30. A. W. A. Pauldrach, et al., A&A 312, 525 (1996).
-
1.
We thank Elena Pian and Daniel Sauer for help with data analysis.
This work was partly supported by the European Union’s Human Potential Programme under contract HPRN-CT-2002-00303, “The Physics of Type Ia Supernovae”.