X-RAY SPECTRAL VARIABILITY
IN INITIAL RISE OF XTE J1550-564
Abstract
X-ray variability of the microquasar XTE J1550-564 is studied with time domain techniques for the data from the RXTE/PCA observation in September 8, 1998. The 2–60 keV averaged shot is obtained from superposing shots with one millisecond time bin through aligning their peaks. The spectral behavior during the averaged shot exhibits prominent differences from that observed in Cyg X-1. The hardness ratio of (13–60 keV)/(2–13 keV) or (16–60 keV)/(13–16 keV) during a shot is lower or higher than that of steady emission respectively. The correlation coefficient between intensity and hardness ratio of (13–60 keV)/(2–13 keV) or (16–60 keV)/(13–16 keV) is negative or positive respectively. These results may indicate that physical processes in the low state of XTE J1550-564 are different from those in Cyg X-1.
1 INTRODUCTION
The X-ray transient XTE J1550-564 (Galactic longitude and latitude ) was discovered by the All-Sky Monitor (ASM) aboard the Rossi X-ray Timing Explorer (RXTE) on September 7, 1998 (Smith, 1998). Shortly afterwards, its optical (Orosz et al., 1998) and radio (Cambell-Wilson et al., 1998) counterparts were identified.
Observations with the Proportional Counter Array (PCA) aboard were performed between September 7, 1998 and May 20, 1999, during which XTE J1550-564 went through multiple canonical states (Sobczak et al., 1999; Homan et al., 2001). The light curve of 1998/1999 outburst of XTE J1550-564 was complex and included a slow (10 days) rise to maximum, an intense and brief (one day) flare that occurred early in the outburst (Sobczak et al., 2000b), and a ”double-peaked” profile that roughly separated the outburst into two halves of comparable intensity. Low frequency (0.08-18Hz) X-ray quasi-periodic oscillations (QPOs) as well as high frequency variable (100-285Hz) QPOs were detected during some of the RXTE observations (Cui et al., 1999; Remillard et al., 1999; Wijnands et al., 1999; Sobczak et al., 2000a; Homan et al., 2001). Based on its strong aperiodic variability, QPOs and X-ray spectrum, XTE J1550-564 was considered as a promising black hole candidate. Radio jets with apparent superluminal velocities were observed after the strong X-ray flare in 1998 September (Hannikainen et al., 2001), indicating that XTE J1550-564 was another microquasar.
Subsequent optical observations showed that the dynamical mass of the compact object is solar masses, indicating that the compact object in XTE J1550-564 is a black hole, its binary companion was found to be a low-mass star and its distance was estimated as about 5.3 kpc (Orosz et al., 2002). With Chandra Observatory, Corbel et al. (2002) discovered a large-scale, relativistically moving and decelerating radio and X-ray emitting jet from XTE J1550-564.
After the major and complex outburst in 1998–1999, the source experienced subsequent dim outbursts in 2000 (Smith et al., 2000; Masetti & Soria, 2000), 2001 (Tomsick et al., 2001; Jain et al., 2001), 2002 (Swank et al., 2002) and 2003 (Dubath et al., 2003).
X-ray temporal and spectral variabilities carry valuable information about the emission and propagation process of high-energy photons around the central black hole in a black hole X-ray binary system. Negro et al. (1994) constructed the averaged peak-aligned shot profile with Ginga observation data of the galactic black hole Cyg X-1 in the hard state. With RXTE/PCA data and an improved shot detection algorithm, Feng, Li & Chen (1999) studied the evolution of hardness ratio of (13–60 keV)/(2–6 keV) in the hard, soft, and transition states of Cyg X-1. With the identical method of obtaining the averaged peak-aligned shot profile, Liu & Li (2004) studied the spectral variability in the energy band above keV in different states of Cyg X-1. To obtain statistically significant results with the shot search technique in time domain by Feng, Li & Chen (1999), sufficiently long observation and high source flux are necessary in order to suppress noise, thus limiting the application of the algorithm in other X-ray sources. Fortunately XTE J1550-564 was an exceptionally bright X-ray source in its 98/99 outburst and it was intensively observed a series of almost daily pointed RXTE observations, which produce a rich dataset appropriate for applying the above mentioned shot searching and analysis method.
In this work we make energy resolved temporal analysis of XTE J1550-564 with the RXTE/PCA observation performed in September 8, 1998, just after the source was discovered and in the initial X-ray rising phase. We present temporal and spectral property of averaged superposed shot, which has been studied in Cyg X-1 (Negro et al., 1994; Feng, Li & Chen, 1999; Negro et al., 2001; Liu & Li, 2004) but almost no statistically significant result has been obtained in other sources. Energy resolved timing analysis of correlation is also made. We compare the different spectral variabilities of XTE J1550-564 and Cyg X-1, and discuss the possible physical interpretations related with such phenomenon.
2 SHOT PROPERTIES
2.1 Spectral State on the Rise to 98/99 Outburst
The shot analysis has been progressed for different states of Cyg X-1. We find it is not easy to do the same with the data in other sources, especially in their low/hard state (LS), due to the lack of the observations with sufficiently high count rates, high signal to noise ratio and long exposure which are capable of producing statistically significant results. The rise to 98/99 outburst in XTE J1550-564, however, gives an uncommon LS of comparable brightness to Cyg X-1, which is appropriate for shot analysis and comparison with the results from Cyg X-1 in LS.
The 98/99 outburst of XTE J1550-564 exhibits a ”double-peaked ” profile, separated by a minimum occurring around December 3, 1998. Sobczak et al. (1999) conclude that XTE J1550-564 is observed in the very high (VHS), high/soft (HS) and intermediate canonical outburst (IS) states of black hole X-ray novae. Accurately, the first half of the outburst from September 18 to October 27, 1998 has the spectra dominated by the power-law component with large photon index, and is identified as VHS. After October 27 the power-law component weakens rapidly and the disk component begins to dominate, which is consistent with HS. However, during this time the source occasionally exhibits QPOs and those observations are considered as IS.
In more detail, Wu et al. (2002) divide the first peak of 98/99 outburst into five phases, named after the corresponding stages in the RXTE/PCA X-ray light curve: (1) fast rising, (2) slow rising, (3) flare, (4) postflare plateau and (5) X-ray decline. The first phase, which lasts from September 7 to 8, is the onset of the outburst and characterized by an impulsive rise in the hard X-rays (above 20 keV) and an exponential-like rise in the soft X-ray (2-12 keV for RXTE/PCA). Wilson & Done (2001) study the spectral properties of the first 14 observation of the rise to outburst phase from September 7 to September 16. Using both the PCA and HEXTE instrument aboard RXTE, they find that the 3–200 keV spectra smoothly pass from standard LS to VHS without encountering classic HS. Initial spectrum can be fitted adequately by a disk black body and a thermal Comptonization model which includes reflection, and it is very similar to the classic LS spectrum seen in many Galactic Black Holes (little or no Black Body and a large Compton component). The power spectrum of these data shown by Cui et al. (1999) is also vary similar to LS power spectra. With the further comparison with the hardest LS spectrum of Cyg X-1 observed by , they conclude that in the first part of the rise, XTE J1550-564 was in a classic LS.
Therefore, the first two observations on the initial rise in September 7 to 8, fulfill our necessary of LS with high flux. They are similar in terms of their spectra (Wilson & Done, 2001) and power spectra (Cui et al., 1999). We pick the second one because of its longer exposure time ( s) than the first ( s). So that the data chosen by this work are just from the observation in the next day of the detection of source while in its LS. The Obs. ID of data is 30188-06-03-00, which is part of a guest observer program with results reported by Cui et al. (1999).
2.2 Shot and Spectral Variability
Light curves with 1 ms time bin in different energy bands are extracted from RXTE/PCA Event mode (covering 13–60 keV) and Single-Bit mode (covering 2–13 keV) of Obs. ID 30188-06-03-00, with FTOOLS package. GTI criteria in the standard product by RXTE Guest Observer Facility (GOF) is applied, which means the data are selected for analysis when the source is observed at the elevation angle larger than , the offset pointing is less than , at least one PCU is on, and after thirty minutes since the peak of SAA (South Atlantic Anomaly) passage. The 98/99 outburst of XTE J1550-564 is bright, and the averaged background contribution for high energy band ( keV) is at 10% lever and less than 1% for low energy band ( keV). Therefore the background is negligible for the study of averaged shot features. The effect of dead time is also neglected since the count rate is not very high and the time bin is much larger than RXTE dead time of .
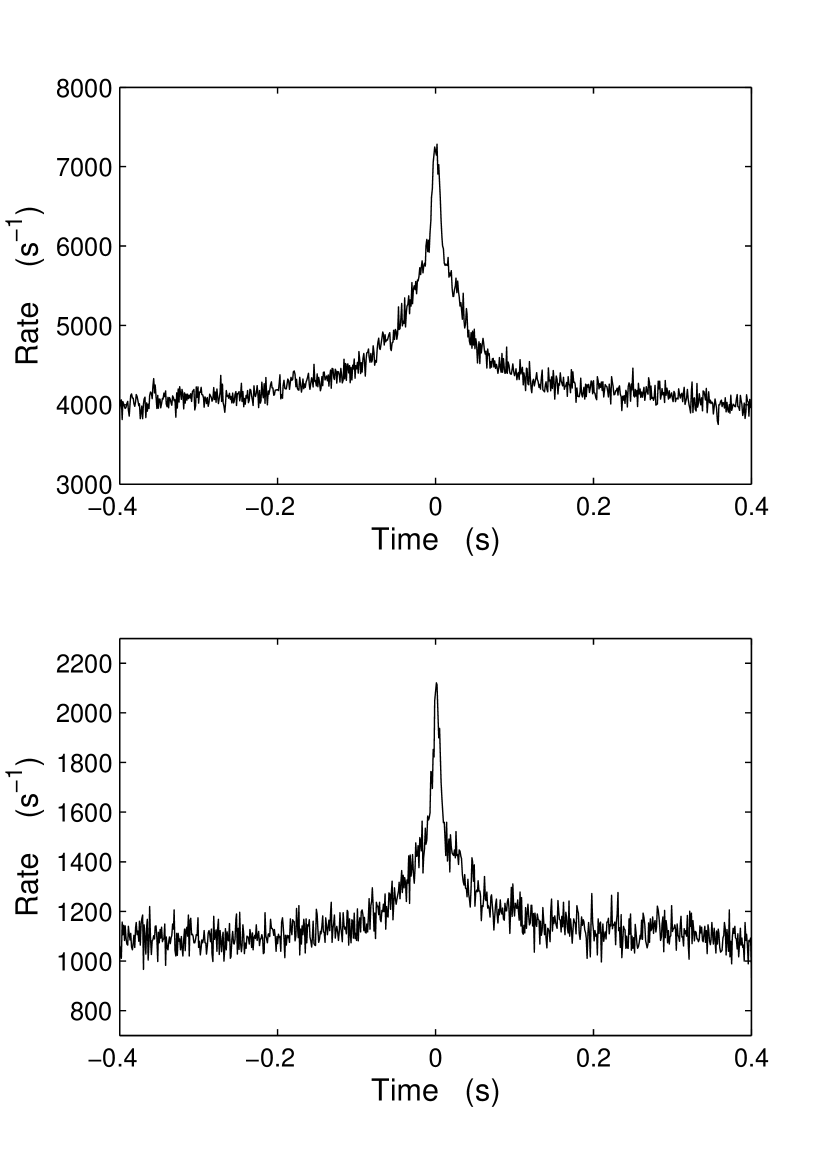
Shots are searched from 1 ms time bin light curves by using the algorithm proposed by Feng, Li & Chen (1999). A light curve with 1 ms time bin is first merged into a larger bin of 10 ms. Then the bin with count larger than the neighboring bins is selected as a peak candidate. In the neighboring 1 s on both sides of each candidate, we search for the bins with counts and so that the condition is satisfied. If and only if the number of bins with and is larger than a certain criterion, the candidate peak is selected as a potential shot peak. Then each potential shot peak and its neighboring bins on both sides are divided into 30 bins with a time bin of 1 ms. A shot is finally selected by the criterion that its count should be the maximum within the 30 ms and 2 times larger than the mean count of the observation. The above process is performed in energy bands of 2–13 keV and 13–60 keV respectively. A shot peak is finally identified if it coincides in both energy bands within 30 ms. Many shot peaks determined this way are aligned to obtain the averaged shot profiles separately in each energy band, as shown in Figure 1.
In order to study the spectral variability during an averaged shot, for each time bin within a 400 ms interval around the shot peak, the hardness radio is calculated with
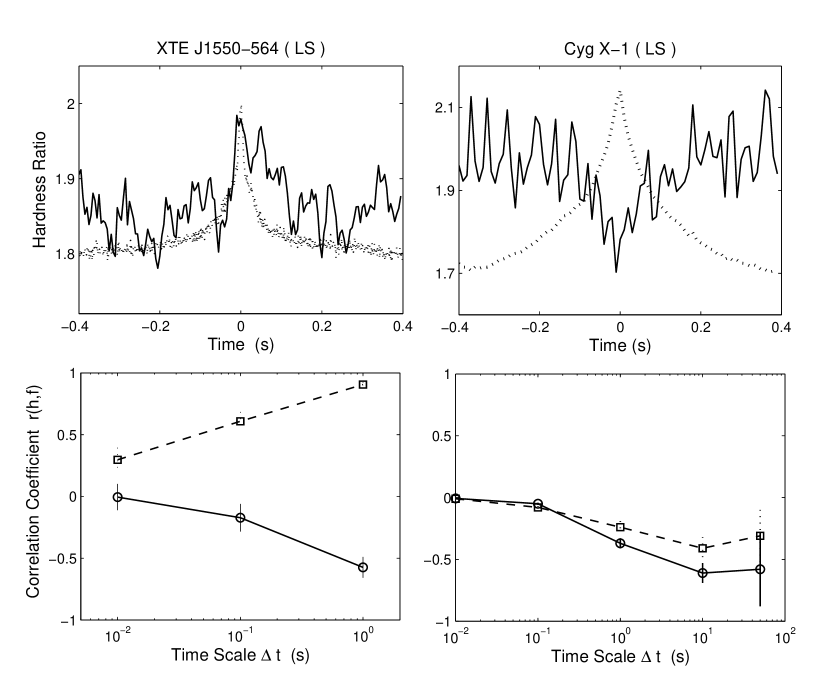
where are the count rates for the th selected shot in energy band A and B respectively, and is the total number of selected shots in the above process. Figure 2 shows the total profiles of averaged shot in 2–60 keV and hardness ratio between different bands during the averaged shot.
We can see from Figure 2 that during a shot the hardness ratio with respect to a soft band below keV is negatively correlated to the flux, namely the hardness ratio decreases as the flux of shot increases and reaches minimum at the shot peak bin, then rises with flux dropping. The variation of hardness ratio of (16–60 keV)/(13–16 keV) during a shot is somewhat complex, however, in the main part of shot, it shows a rise and reaches peak when the flux of the shot peaks. Thus there is a possibility that the hardness with soft band above keV is positively related to the light curve, which will be verified by the following correlation analysis.
3 CORRELATION BETWEEN HARDNESS AND INTENSITY
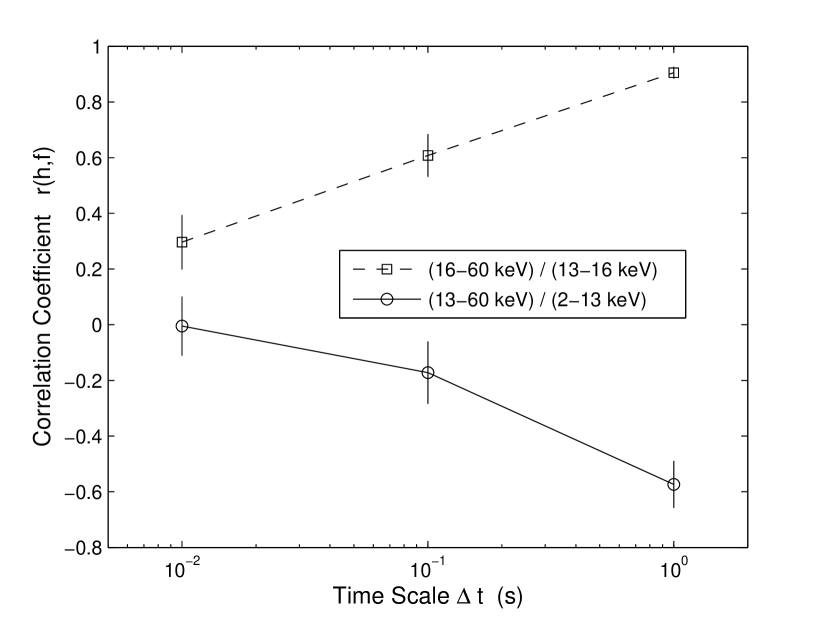
Li, Feng & Chen (1999) proposed an algorithm to calculate the correlation coefficient between the hardness ratio and the total intensity on a given timescale . The light curve in the studied observation period is divided into segments with duration of each. The correlation coefficient of the th segment is calculated with the equation
and then their average and standard deviation .
The correlation coefficients between the intensity and hardness ratio of (13–60 keV)/(2–13 keV) and (16–60 keV)/(13–16 keV) are obtained on timescales of 0.01 s, 0.1 s and 1 s respectively. The results are shown in Figure 3. From Figure 3 the difference of coefficients with regard to the soft bands below and above keV is clear: for the former the coefficients are negative and decrease monotonically with timescale increasing, and for the latter are positive and increase monotonically.
4 COMPARISON WITH CYG X-1
We summarize the main features in X-ray spectral variability in XTE J1550-564 revealed by our time domain analysis as follows: (1) During an averaged shot, the hardness ratio with regard to a soft band below keV has a ”V” shape, i.e. shots are softer than the steady emission and the hardness ratio in the hard tail of the energy spectrum above keV has complicated evolution and peaks when the flux peaks. (2) The correlation coefficients between the intensity and hardness ratio with regard to the soft band below keV on timescales between 0.01 and 1 s are negative and decreases monotonically as timescale increases; in contrast, the correlation in the energy band above keV is positive and increases with timescale increasing. The correlation analysis is made for the temporal variability of the whole light curve instead of only shot, and its results in Figure 3 are qualitatively consistent with the results from the shot analysis. The monotonic increase or decrease with increasing time scale may indicate the effect of uncorrelated noise being weakened on larger timescales.
The shot analysis technique has been applied to Cyg X-1 in different spectral states and energy bands with /PCA data (Feng, Li & Chen, 1999; Liu & Li, 2004). That the average duration of shots of XTE J1550-564 in the high energy band is shorter than what observed in the low energy band, shown in Figure 1, is consistent with the result in Cyg X-1. We notice from Figure 2 that there exists a pre-peak drop of hardness with soft band above keV during a shot, which has also been observed in the transition and low states in Cyg X-1, and explained by the more effective cooling in the disturbance.
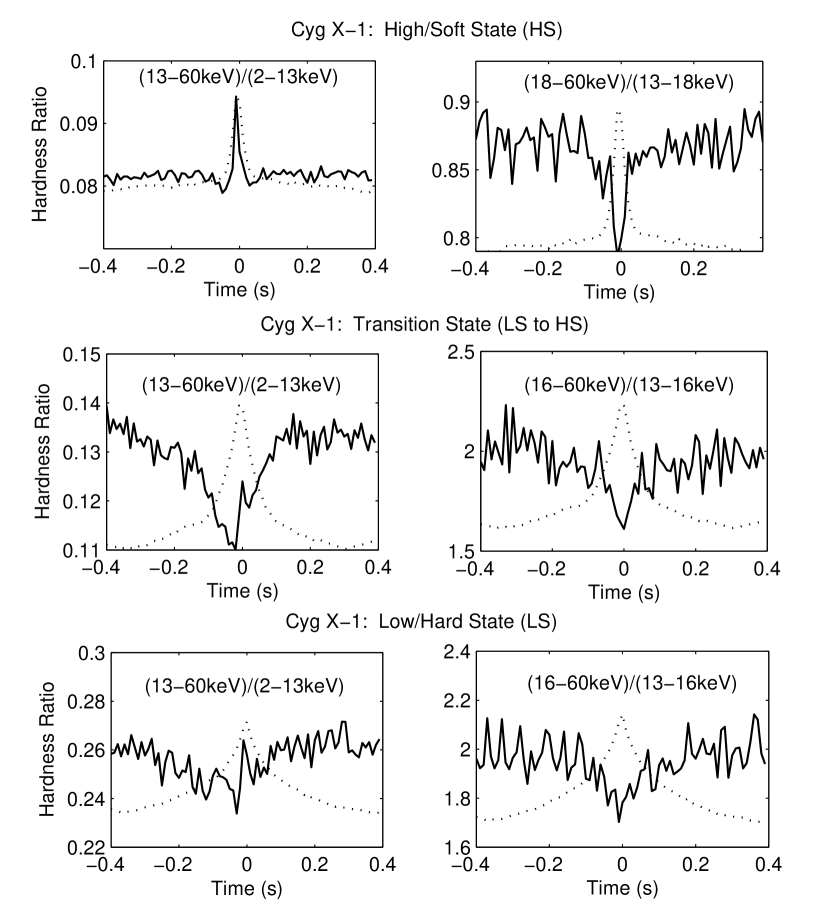
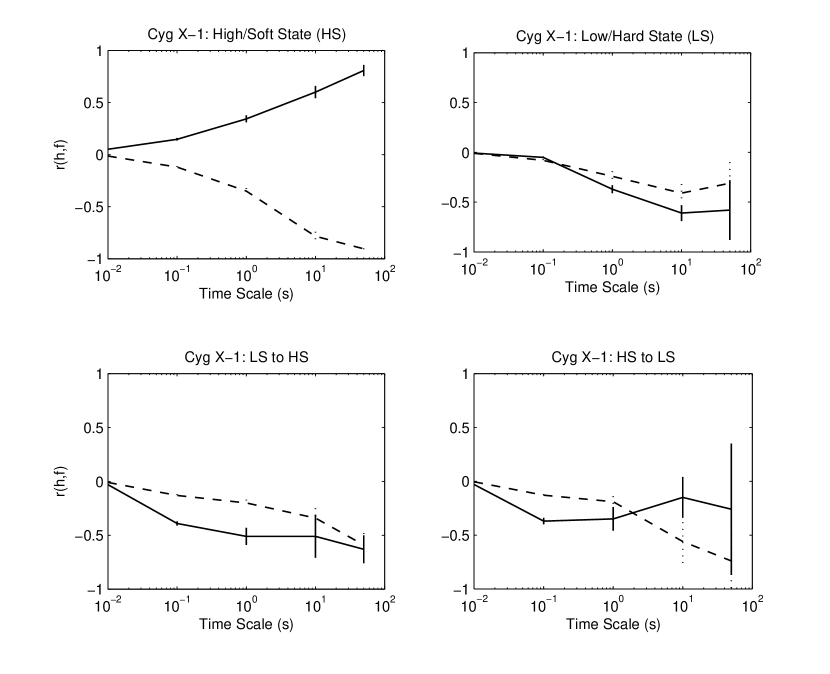
Figure 4 and Figure 5 are adapted from Liu & Li (2004) showing hardness profiles of averaged shot and timescale distribution of correlation coefficient between hardness and intensity for Cyg X-1 in different spectral states. With regard to the soft band of below keV, the spectral evolution during an averaged shot of XTE J1550-564 in LS (the left panel in Figure 2) is similar with that of Cyg X-1 in LS (the bottom-left panel in Figure 4): the average hardness ratio (13-60 keV/2-13 keV) during a shot is in general lower than that of the steady component and a sharp rise in the average profile of hardness ratio is appeared at about the peak of shot flux. The feature of timescale distribution of correlation coefficient between X-ray hardness and intensity for XTE J1550-564 (the solid line in Figure 3) is also similar with that for Cyg X-1 (the solid line in the upper-right panel of Figure 5): the correlations between the hardness ratio and intensity on time scales between 0.01 s and 1 s are negative and the correlation coefficients decrease monotonically along with timescale increasing. In contrast, for the hard band above keV, the shot spectral evolution and timescale distribution of hardness-intensity correlation coefficient are completely different between the two sources when they both in LS, as shown in Figure 6: when flux peaks during a shot, the average hardness profile bottoms out for Cyg X-1 (see the upper-right panel of Figure 6) but peaks for XTE J1550-564 (see the upper-left panel of Figure 6); the signs and timescale dependence of hardness-intensity correlation coefficient in the hard band above keV are similar with that of hardness-intensity correlation coefficient with regard to the soft band below keV for Cyg X-1 (see the bottom-right panel of Figure 6), but completely different for XTE J1550-563 (see the bottom-left panel of Figure 6).
5 DISCUSSION
It is natural to assume that X-ray shots are most probably produced at the innermost region of the cold disk where it joins the hot corona, which is a most turbulent region, and the steady component around a shot is a global average of emission from different regions of the hot corona (Li, Feng & Chen, 1999). The evolution of hardness ratio with regard to a soft band below keV should depend on the comparison between the local temperature where shot is produced and the global average temperature of the corona. For LS the optically thick disk is truncated at a larger distance and joins to a spherical corona around the black hole (Esin et al., 1997). Shots should be softer than the steady emission since they emerge and are Comptonized at the outer part of the corona with temperature lower than the average of the total corona. Such interpretation coincides with the observations for both Cyg X-1 and XTE J1550-564.
For the hard band above keV, two different processes may influence the spectral evolution during a shot, i.e. Comptonization of soft photons by hot electrons in the corona and reflection of hard photons by the accretion disk or other reflector. The hard power-law like spectrum of a black hole binary is produced by thermal Comptonization: hard emission above keV is produced by inverse Compton scattering of soft seed photons by hot electrons of temperature keV (Sunyaev & Trümper, 1979). Besides the Comptonization, irradiation of disk and other dense material by the hard X-rays gives rise to a broad hump-like spectrum around 20–30 keV (the Compton reflection hump) (George & Fabian, 1991; Reynolds, 1996).
When a seed photon of 10 keV collides with a relativistic electron in the hot corona with energy 100 keV, the energy of the seed photon will be lifted to keV. Most scattered photons escaping from the hot corona undergo only one collision. If thermal Comptonization is the dominant process to produce the shot energy spectrum above keV, the hardness ratio in respect to the 13–16 keV band will decrease when the number of seed and scattered photons increases, and an anti-correlation between the hardness ratio (16–60 keV)/(13–16 keV) and the hard band intensity during a shot will be expected as observed in Cyg X-1 (Liu & Li, 2004).
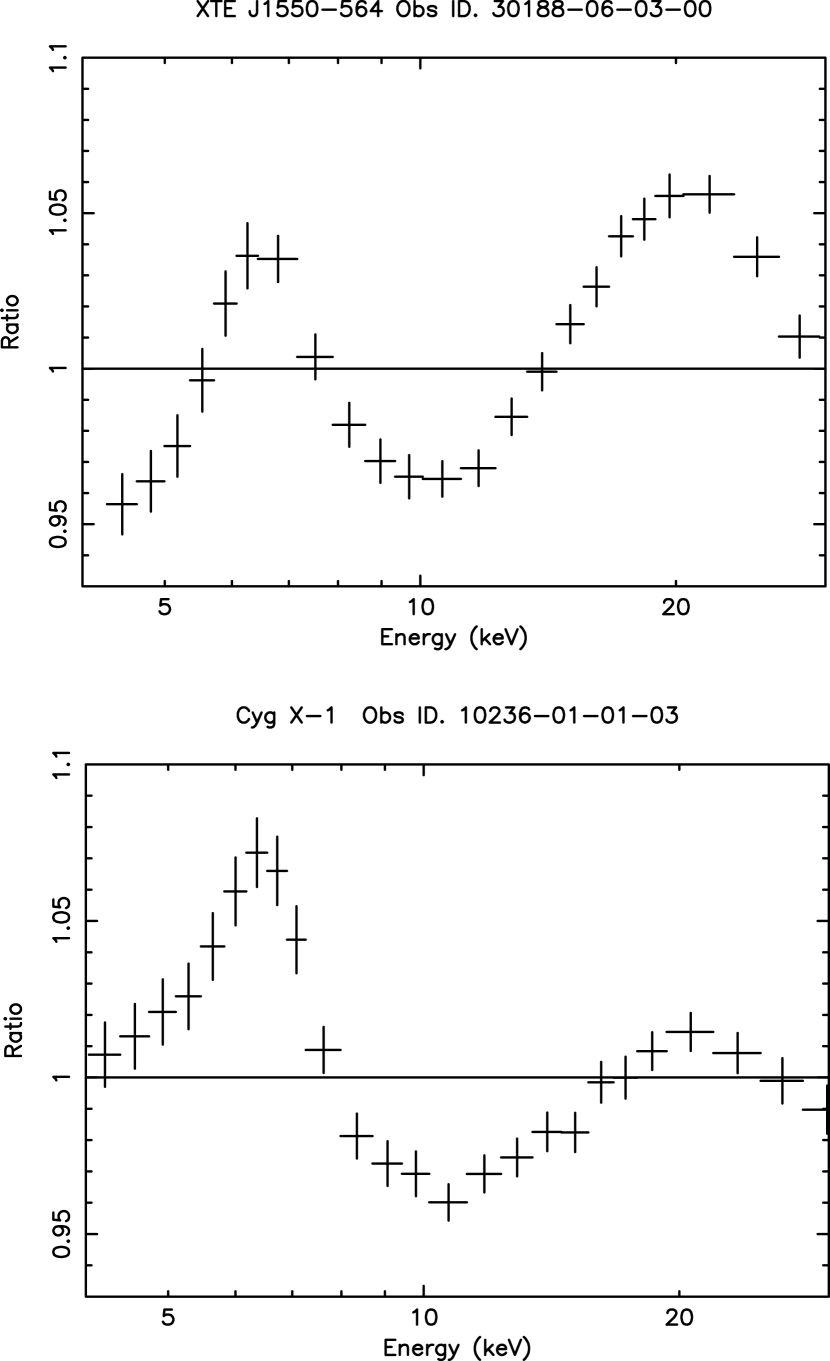
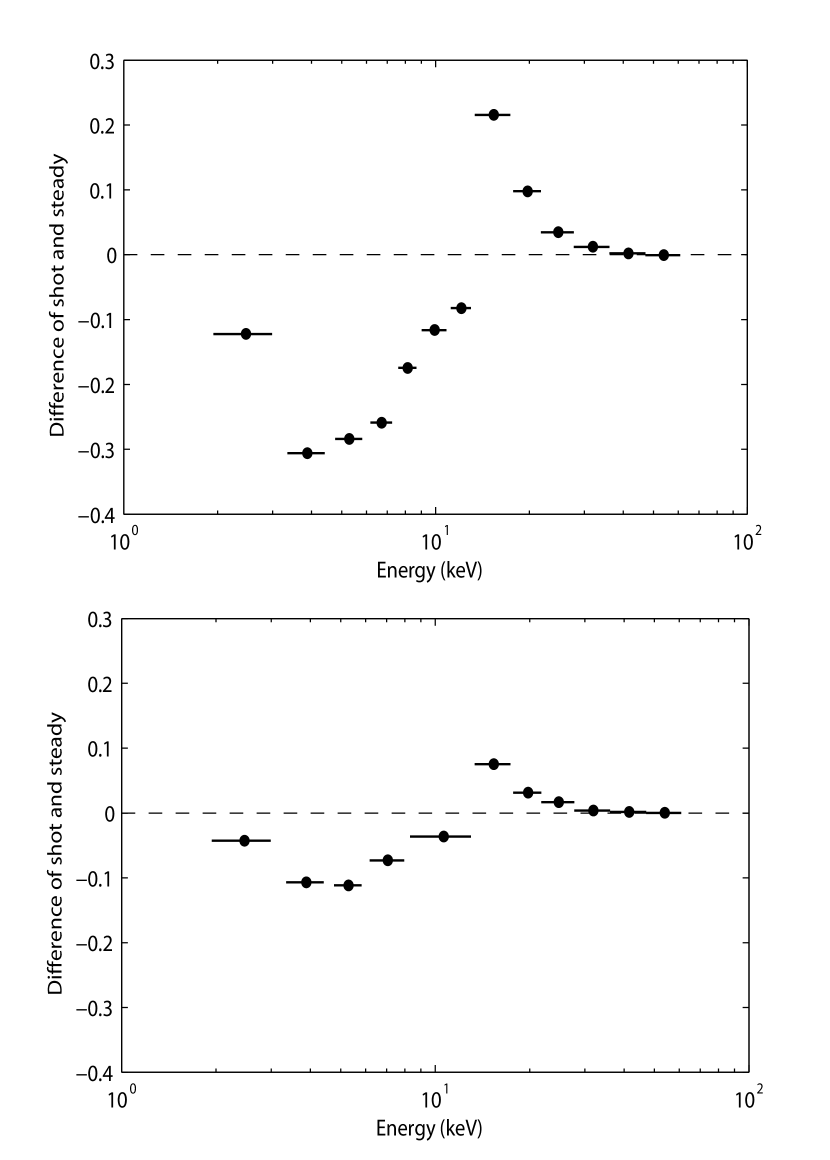
On the other hand, the reflection hump around 20–30 keV should increase the hardness ratio (16–60 keV/(13–16 keV). The observed behavior of hardness (16–60 keV)/(13–16 keV) during shot in XTE J1550-564 may indicate that reflection component is an important part in the energy band above keV of observed shot photons. To check this scenario, firstly we inspect the energy spectrum of XTE J1550-564 and compare with that of Cyg X-1. Figure 7 shows the ratio of data to continuum when a simple power law is used to fit spectra of XTE J1550-564 and Cyg X-1 respectively. From Figure 7 one can see that the reflection component around keV seems more prominent in XTE J1550-564 than in Cyg X-1, which is similar to what has been seen from X-ray observations of active galactic nuclei (AGN), e. g. the bright Seyfert 1 galaxy MCG-6-30-15 (Lee et al., 1998; Ballantyne, Vaughan & Fabian, 2003), and that might attribute to the different hardness evolution behaviors between XTE J1550-564 and Cyg X-1. Secondly, we investigate the spectrum of shot component picked out by the method described in section 2, as well as steady component which is the residual of the light curve after getting rid of selected shots. As the characteristic timescale of shots is s, the standard 2 mode with time step of 16 s is not appropriate to extract the shot spectra. We use the data of Generic Binned and Event mode with higher time resolution to obtain spectra at the cost of reducing energy resolution. The counts spectra of both shot and steady components are normalized by the total observed counts in a certain energy bin. The difference spectra of XTE J1550-564 and Cyg X-1 obtained by subtracting the normalized counts spectrum of steady component from that of shot component are shown in Figure 8. From Figure 8 we can see that for both sources the proportion of Fe K line at keV in shot component is less than that in steady component, and in the hard band more prominent reflection photons around keV exist in shots than in steady emission. It seems from Figures 7 and 8 that for XTE J1550-564 the more fraction of reflection component around keV may possibly interpret the observed hardness evolution profiles in the energy band above keV during the averaged shot.
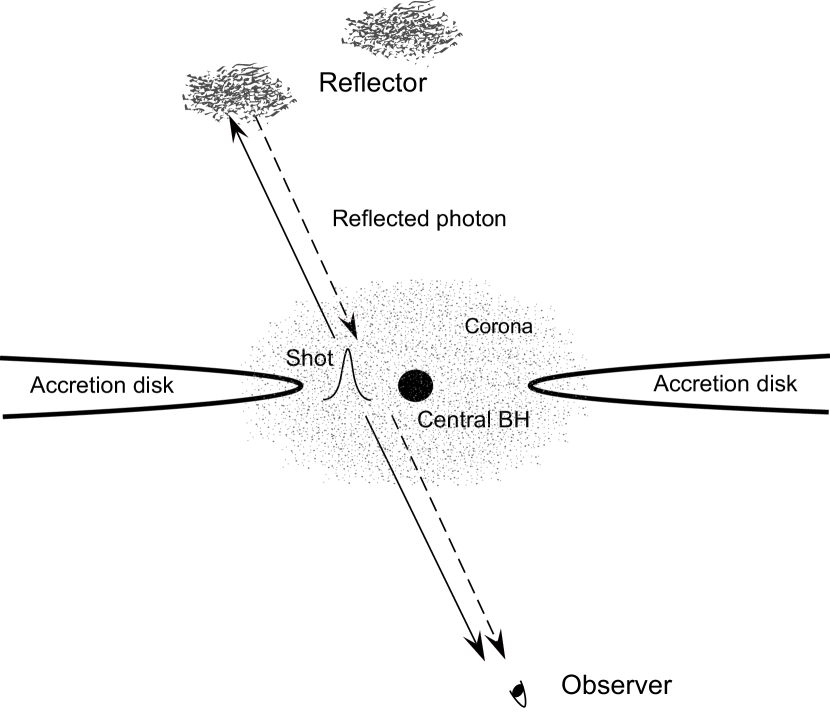
It is not a surprise to see the similarity in the presence of a strong reflection continuum above 10 keV between the microquasar XTE J1550-564 (Figure 7) and AGNs, e. g. MCG-6-30-15 (Figure 4 in Lee et al. (1998); Figure 2 in Ballantyne, Vaughan & Fabian (2003)). But to interpret the positive correlation between intensity and hardness ratio in the hard band above keV by reflection effect during an average shot and the negative correlation in regard to the soft band below keV by the local temperature where shot is produced being lower than the average of the corona, we need further assume that the strong reflection continuum is a characteristic of X-ray shots and the fluorescent Fe line is mainly from the steady component, which is indeed indicated by Figure 8. A possible model to meet the above requirement is schematically represented by Figure 9. In this model, the Fe line is produced from steady X-rays in the hot corona irradiating the accretion disk and the Compton hump above 10 keV from reflection of X-ray shots by reflector far away from the corona where the steady emission is weak and jet-like shots may still intense enough. The possible electro-magnetic origin of X-ray shots, e. g. magnetic flares (Beloborodov, 1999; Poutanen & Fabian, 1999) or plasma columns produced by pinch discharge (Alfven, 1981; Wu, Chen & Li, 2005) may produce collimated emission to some extent. With this model, the observed difference of hardness evolution in an average shot between the two sources comes from that there exist outer reflectors for the microquasar XTE J1550-564 (at least in the initial X-ray rising phase) which is more than Cyg X-1. Further inspecting spectral evolution, polarization and other properties for average and even individual shot of GBHC and AGN with next generation X-ray explorers is necessary for understanding the process of shot production and the environment around the central black hole.
References
- Alfven (1981) Alfven, H., 1981, Cosmic Plasma, D. Reidel Publishing Company
- Ballantyne, Vaughan & Fabian (2003) Ballantyne, D. R., Vaughan, S., & Fabian, A. C., 2003, MNRAS, 342, 239
- Beloborodov (1999) Beloborodov, A. M., 1999, ApJ, 510, L123
- Cambell-Wilson et al. (1998) Campbell-Wilson, D., McIntyre, V., Hunstead, R., & Green, A. 1998, IAU Circ., 7010
- Corbel et al. (2002) Corbel, S., Fender, R., Tzioumis, A. K., et al. 2002, Science, 298, 196.
- Cui et al. (1999) Cui, W., Zhang, S. N., Chen, W., & Morgan, E. H. 1999, ApJ, 512, L43
- Dubath et al. (2003) Dubath, P., Revnivtsev, M., Goldoni, P., et al. 2003, IAU Circ., 8100
- Esin et al. (1997) Esin, A. A., McClintock, J. E., & Narayan, R. 1997, ApJ, 489, 865
- Feng, Li & Chen (1999) Feng, Y. X., Li, T. P., & Chen, L. 1999, ApJ, 514, 373
- George & Fabian (1991) George, I. M. & Fabian, A. C. 1991, MNRAS, 249, 352
- Hannikainen et al. (2001) Hannikainen, D., Wu, K., Cambell-Wilson, Hunstead, R., Lovell, J., Mclntyre, V., Reynolds, J., Soria, R., Tzioumis, T. 2001, Proc. 4th INTEGRAL Workshop, ESA SP-459, P.291, (astro-ph/0102070)
- Homan et al. (2001) Homan, J., Wijnands, R., van der Klis, M., Belloni, T., van Paradijs, J., Klein-Wolt, M., Fender, R. P., & Mendez, M. 2001, ApJS, 132, 377
- Jain et al. (2001) Jain, R., Bailyn, C., & Tomsick, J. 2001, IAU Circ., 7575, 3
- Lee et al. (1998) Lee, J. C., Fabian, A. C., Reynolds, L. S., Iwasawa, K., & Brandt, W. N. 1998, MNRAS, 300, 583
- Li, Feng & Chen (1999) Li, T. P., Feng, Y. X., & Chen, L. 1999, ApJ, 521, 789
- Liu & Li (2004) Liu, C. Z., & Li, T. P. 2004, ApJ, 611, 1084
- Masetti & Soria (2000) Masetti, N., & Soria, R. 2000, IAU Circ., 7399
- Negro et al. (1994) Negoro, H., Miyamoto, S., & Kitamoto, S. 1994, ApJ, 423, L127
- Negro et al. (2001) Negoro, H., Kitamoto, S., & Mineshige, S. 2001, ApJ, 554, 528
- Orosz et al. (1998) Orosz, J. A., Bailyn, C. D., & Jain, R. K. 1998, IAU Circ., 7009
- Orosz et al. (2002) Orosz, J. A., Groot, P. J., van der Klis, M., McClintock, J. E., Garcia, M. R., Zhao, P., Jain, R. K., Bailyn, C. D., & Remillard, R. A. 2002, ApJ, 568, 845
- Poutanen & Fabian (1999) Poutanen, J., & Fabian, A. C. 1999, MNRAS, 306, L31
- Remillard et al. (1999) Remillard, R. A., McClintock, J. E., Sobczak, G. J., Bailyn, C. D., Orosz, J. A., Morgan, E. H., & Levine, A. M. 1999, ApJ, 517, L127
- Reynolds (1996) Reynolds, C. S. 1996, PhD thesis, University of Cambridge
- Smith (1998) Smith, D. A. 1998, IAU Circ., 7008
- Smith et al. (2000) Smith, D. A., Levine, A. M., Remillard, R., & Fox, D. 2000, IAU Circ. 7399
- Sobczak et al. (1999) Sobczak, G. J., McClintock, J. E., Remillard, R. A., Levine, A. M., Morgan, E. H., Bailyn, C. D., & Orosz, J. A. 1999, ApJ, 517, L121
- Sobczak et al. (2000a) Sobczak, G. J., McClintock, J. E., Remillard, R. A., Cui, W., Levine, A. M., Morgan, E. H., Orosz, J. A., & Bailyn, C. D. 2000a, ApJ, 531, 537
- Sobczak et al. (2000b) Sobczak, G. J., McClintock, J. E., Remillard, R. A., Cui, W., Levine, A. M., Morgan, E. H., Orosz, J. A., & Bailyn, C. D. 2000b, ApJ, 544, 993
- Sunyaev & Trümper (1979) Sunyaev, R., & Trümper, J. 1979, Nature, 279, 506
- Swank et al. (2002) Swank, J., Smith, E., & Markwardt, C. 2002, IAUC 7792
- Tomsick et al. (2001) Tomsick, J. A., Smith, E., Swank, J., Wijnands, R., & Homan, J. 2001, IAU Circ. 7575
- Wijnands et al. (1999) Wijnands, R., Homan, J., & van der Klis, M. 1999, ApJ, 526, L33
- Wilson & Done (2001) Wilson, C. D., & Done, C. 2001, MNRAS, 325, 167
- Wu et al. (2002) Wu, K., Soria, R., Campbell-Wilson, D., Hannikainen, D., Harmon, B. A., Hunstead, R., Johnston, H., McCollough, M., & McIntre, V. 2002, ApJ, 565, 1161
- Wu, Chen & Li (2005) Wu, M., Chen, L. & Li, T. P. 2005, Chin. J. Astron. Astrophys., 5, 57, (astro-ph/0501334)