∎
Vicolo dell’Osservatorio 2, I-35122 Padua
Tel.: +39-049-8278241
Fax: +39-049-8278212
22email: viviana.casasola@unipd.
Present address: Observatoire de Paris-LERMA
61 Av. de l’Observatoire
F-75014 Paris
Are truncated stellar disks linked to the molecular gas density?
Abstract
We know that the slope of the radial, stellar light distribution in galaxies is well described by an exponential decline and this distribution is often truncated at a break radius (). We don’t have a clear understanding for the origin of these outer truncations and several hypotheses have been proposed to explain them. We want to test the various theories with direct observations of the cold molecular gas for a few truncated galaxies in comparison with the non-truncated ones. The answer to the existence of a possible link between truncated stellar disks and the molecular gas density cannot be obtained from CO maps in the literature, because so far there are no galaxies with a clear truncation observed in CO at high resolution.
1 Introduction
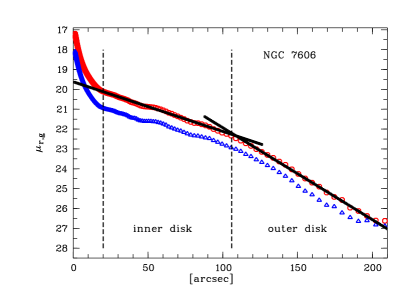
The properties of the faintest regions of galactic disks are linked to the mechanisms involved in the growing and shaping of galaxies. These outer parts are affected by interactions with the nearby galaxies and so their characteristics are connected with the evolution followed by the galaxies. In other words, the stellar structure of the outer parts of galactic disks is a fundamental element of evidence for understanding the formation and evolution of spiral galaxies. Since Patterson (1940), de Vaucouleurs (1959) and Freeman (1970) we know that the slope of the radial, stellar light distribution is described by an exponential decline. However, this exponential light distribution does not always extend to arbitrarily large radii, but it is often truncated at a well-defined (van der Kruit 1979, de Grijs et al. 2001; Pohlen et al. 2002). In the optical this break occurs at galactocentric distances of typically 2-3 radial scale-lengths (Pohlen & Trujillo 2006) and it is best described with a broken exponential with a clear break and a downbending, steeper outer region (see Fig. 1). This truncation radius could be used as a new intrinsic parameter measuring the size of galactic disks and may be linked to their formation and evolution as shown by Trujillo & Pohlen (2005). At present, we do not have a secure understanding for the origin of these outer edges, and the hypotheses proposed range from explaining truncations as remains of the initial galaxy formation process (van der Kruit 1987) being a relic of the galaxy evolution over the lifetime (Seiden et al. 1984). Another possible and interesting explanation assumes the existence of a critical CO density acting as a star formation threshold. If the observed falloff in the star formation rate (SFR) in the outer parts persists for sufficient time, it should introduce a visible truncation of the stellar luminosity profile at that radius. A typical threshold of the molecular gas density, below which the star formation process is inhibited, is in the range from 3 to 10 M⊙ pc-2 according to Schaye (2004). This threshold may be observed by measuring the local column density of molecular gas and correlating it with the current SFR in the same galaxy regions. We are interested to find a change in the local CO emission across the optical break radius (or the typical position for it), while comparing truncated with non-truncated galaxies.
 |
 |
2 Sample Selection
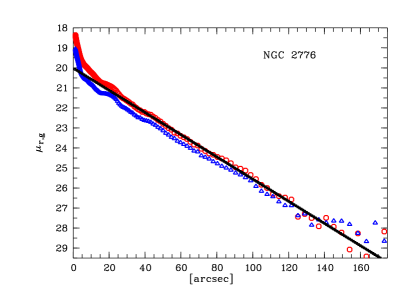
We selected two galaxies, one with truncation and one without truncation, from a sample of 98 nearby disk galaxies (Pohlen & Trujillo 2006) with measured deep optical profiles whose inclination is ranging from intermediate () to almost face-on (): NGC7606 (truncated) and NGC2776 (non-truncated). These two galaxies also have the highest possible FIR luminosity and H2 gas content in the literature and this provides the highest possible chances to find enough CO in these galaxies to get a good measure along the radial axis. In Fig. 1 the azimuthally averaged radial surface brightness profiles using SDSS data are represented for the two galaxies. Comparing the profiles of the two galaxies, one clearly see that for the truncated galaxy NGC7606 (left panel) beyond the inner region (), dominated by the bulge component, there is an inner exponential distribution (inner disk) out to a break radius at followed by another outer steeper exponential region (outer disk).
3 Observations and First Results
To test the possible local correlation between CO and SFR, we have started to observe the two galaxies selected at CO(1-0) and CO(2-1) lines with the 30m-IRAM Telescope. In particular, we observed the nucleus and some regions near the major axis of the two galaxies. For NGC7606 the observational data now available (Fig. 2, upper panels) suggest the presence of a CO ring between 50′′ and 90′′ from the nucleus and the absence of signal for larger distances (similar to Fig.1, left panel). NGC2776 shows a CO peak in the nucleus and the molecular gas content decreases with radius (Fig. 2, bottom panels) with a behavior similar to that obtained from SDSS data (Fig. 1, right panel) in g′ (blue-green) and r′ (red) wavebands.
4 Discussion
The fact that the truncated galaxy NGC7606 presents only a marginal or none CO detection in the center is not so anomalous. Until a short time ago our general knowledge of the CO distribution in galaxies was still based on the single-dish survey of 300 galaxies observed with the FCRAO 14-m Telescope (Young et al. 1995). They found that CO is usually peaked toward galaxy centres and only for the % of their systems there is an indication of a molecular ring or off-centre CO peak. In a more recent and higher resolution work, however, it appears that the picture is not so simple: the BIMA Survey of Nearby Galaxies (BIMA SONG), that studied the CO emission of 44 nearby spiral galaxies, showed that the molecular gas distribution is generally very heterogeneous in this kind of systems (Regan et al. 2001, Helfer et al. 2003). This survey suggests that spiral galaxies can show large departures from a smooth exponential profile in the gaseous components. The possibility to find CO emission beyond the optical radius is also supported by the results obtained by Braine & Herpin (2004) for the isolated spiral galaxy NGC4414. The spectra that they measured reveal the presence of cool molecular gas out 1.5 times the optical radius. In this galaxy, the CO found at large radii is compatible with an exponential profile. However, we know today that gas disks may have irregular radial distributions, with sometimes holes in the center, contrasted spiral structure, resonant rings, etc..
 |
 |
 |
 |
5 Conclusions
These first results encourage us to continue to explore with new observations the extension of CO beyond the optical radius and to see whether this is different for truncated or untruncated galaxies. This possible difference could allow us to test the theory that assumes the existence of a critical CO density acting as a star formation threshold. We will also compare with other gas tracers in the outer parts of galaxies. Indeed the CO tracers might suffer from caveats: the CO line emission requires excitation, that could be lacking in the absence of new stars around. CO emission also depends on metallicity, which is decrasing in the outer parts of galaxies.
References
- (1) Braine, J., & Herpin, F., Nature, 432, 369 (2004)
- (2) de Vaucouleurs, G. , Handbuch der Physik, 53, 311 (1959)
- (3) de Grijs, R., Kregel, M., & Wesson, K.H., MNRAS, 324, 1074 (2001)
- (4) Freeman, K. C., APJ, 160, 811 (1970)
- (5) Helfer, T. T., Thornley, M. D., Regan, M. W., Wong, T., Sheth, K., Vogel, S. N., Blitz, L., & Bock, D. C.-J., ApJS, 145, 259 (2003)
- (6) Patterson, F. S., Harvard Coll. Obs. Bul, 914, 9 (1940)
- (7) Pohlen, M., Dettmar, R.-J., Lütticke, R., & Aronica, G., A&A, 392, 807 (2002)
- (8) Pohlen, M., & Trujillo, I., A&A, 454, 759 (2006)
- (9) Regan, M. W., Thornley, M. D., Helfer, T. T., Sheth, K., Wong, T., Vogel, S. N., Blitz, L., & Bock, D. C.-J., ApJ, 561, 218 (2001)
- (10) Schaye, ApJ, 609, 667 (2004)
- (11) Seiden, P. E., Schulman, L. S., & Elmegreen, B. G., ApJ, 282, 95 (1984)
- (12) Trujillo, I., & Pohlen, M., APJ, 630, L17 (2005)
- (13) van der Kruit, A&A, 38, 15 (1979)
- (14) van der Kruit, A&A, 173, 59 (1987)
- (15) Young et al, ApJS, 98, 219, (1995)