ISOCAM Mid-infrared spectroscopy and NIR photometry of the HII complex N4 in LMC. ††thanks: Based on observations with ISO, an ESA project with instruments funded by ESA member states (especially the PI countries: France, Germany, the Netherlands and the United Kingdom) and with the participation of ISAS and NASA.
Abstract
Context. We present the analysis of ISOCAM-CVF and J,H and Ks photometry data of the HII region complex N4 in the Large Magellanic Cloud (LMC).
Aims. The aim is twofold: 1) to study the connection between the interstellar medium and the star content of this region; 2) to investigate the effects of the lower than galactic metallicity on dust properties.
Methods. A dust features – gas lines – continuum fitting technique on the whole ISOCAM-CVF data cube, allows the production of images in each single emission and the detailed analysis of dust (both continuum and bands), and ionized gas. The Near Infrared (NIR) photometry provides, for the first time, information on the stellar content of N4.
Results. The Mid–Infrared (MIR) spectral characteristics of N4 are those expected for
an HII region complex, i.e. very similar to those observed in galactic HII regions.
The images in single dust feature bands and gas lines clearly show
that the HII region core is completely devoid of
the carriers responsible for the Aromatic Features (AFs). On the other hand, the ionized gas arises almost
completely in this dust cavity,
where also the two main exciting stars of N4 are located. HII region models from Stasińska
(1982) predict an HII region size which
corresponds to the observed size of the dust cavity.
We find evidences that the effect of lower than Galactic metallicity (although not extreme as in the case of LMC)
on the carriers responsible for the AFs, is not to prevent their
formation or to modify their chemical properties, but to enhance their destruction by
the high and hard interstellar radiation field. We argue that this
is the dominant process responsible for the absence of AFs in the HII
region core. We show that this mechanism is more efficient on smaller dust particles/molecules
thus affecting the dust-size distribution. We argue that effects on dust–size distribution,
rather than the different dust properties due to a lower metallicity,
should be taken into account when analyzing
more distant relatively low metallicity galaxies.
Finally, the analysis of the
stellar content of N4 reveals 7 stars: 4 reddened O MS stars and three stars with envelopes. In particular, one of these,
seems to be an Ultra Compact HII region containing an embedded Young Stellar
Object.
Key Words.:
interstellar medium: HII regions – dust features – gas lines – continuum1 Introduction
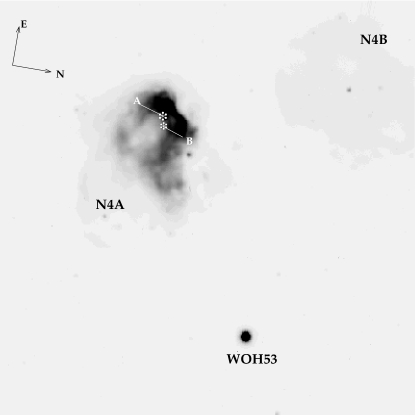
N4 (Henize Henize (1956)) is an HII complex in the north-west part of the Large Magellanic Cloud (LMC). The physical characteristics of the ionized gas and associated molecular cloud, have been extensively studied by Heydari-Malayeri and Lecavelier des Etangs (Heydari (1994)) through optical and submillimeter line spectroscopy.
The H emission of N4 (Figure 1, kindly provided by
Heydari-Malayeri) clearly shows that this HII complex is
composed of two ionized nebulae: N4A and N4B.
In this paper we will concentrate only on N4A.
This is brighter and younger than N4B. It is
composed of a bright dense front to its north-east part
and a more diffuse low surface brightness, partially density bounded, component
to its south part.
The main ionizing sources
in N4A are two stars not visible at optical wavelengths (marked in Figure
1 as A and B).
Heydari-Malayeri and Lecavelier des Etangs (Heydari (1994)) calculated
that the main ionizing sources correspond to either one 60M star
or two 40 M stars.
The average extinction in N4 derived from optical gas emission is quite
low, AV=0.4 although it is presumably higher in the north-east front where the gas density reaches
its maximum.
The parental molecular cloud is formed by two spatial components: one peaking on N4A and the other
peaking to the east of the HII region. The molecular
cloud has two velocity components: a high velocity optically thick red component and a thin blue molecular
sheet. This sheet is probably pushed
towards us by the HII region pressure (Heydari-Malayeri and Lecavelier des Etangs Heydari (1994)).
A complementary study on the hot dust emission in N4A has been done by Contursi et al. (Contursi (1998)) using broad band ISOCAM filters centered at 7 and 15 m. At these wavelengths, the emission is dominated by the Aromatic Features seen in Emission (AFEs) between 3 and 10 m and a continuum steeply rising at wavelengths longer than 10 m. The overall Mid–Infrared (MIR) morphology in N4A is generally quite similar to the CO emission, although the MIR and CO peaks do not exactly coincide. The strongest MIR emission comes from the dense north-east front as expected, since here the density of the matter is the highest. The 15/7 m ratio peaks in the region of N4A where the two main exciting stars are supposed to be. Its high value, typical for an HII region, indicates that the emission at 15 m is dominated by a strong continuum and that the emission at 7 m is significantly reduced. Contursi et al. (Contursi (1998)) suggested that this decrease is primarily due to destruction of the AFEs carriers in hard and strong Interstellar Radiation Fields (ISRF).
This analysis was part of a wide ISOCAM campaign aimed at studying the interstellar medium (ISM) properties in the Magellanic Clouds with particular emphasis on the role played by metallicity, taking full advantage of the unprecedent (at that time) spatial resolution provided by ISO at these wavelengths and to the proximity of the Magellanic Clouds. One of the outcomes of the broad band ISOCAM imaging study of N4 was that this region appears as a classical Galactic HII complex, composed mainly of three phases: 1) The HII region itself close to the exciting stars corresponding to the maximum of the 15/7m ratio; 2) the interface between the HII region and the molecular cloud (Photon–Dominated Region or PDR) where the MIR emission reaches its maximum due to both high dust density and relatively high ISRF; 3) the parental molecular cloud, where the MIR emission is still dominated by AFEs probably arising from the outskirts of the molecular clouds and excited mainly by the general LMC ISRF.
In this paper we present a more detailed study of the MIR emission properties of N4A analyzing a very high signal to noise spectro–imaging data set carried out with the Circular Variable Filter (CVF) on ISOCAM. Thanks to the spectral capabilities, we are able to directly show that our previous physical interpretation of the broad band MIR photometry data of N4, were correct. We also present new high resolution , and images, taken at Las Campanas Observatory (Chile). All these data allow to better investigate the existence of detailed metallicity signatures on the dust emission which do not show up in the broad band emission and to relate together dust, ionized gas and stellar content. These data provide high resolution analogs for the study of the ISM in conditions similar to those of young galaxies in the distant Universe which are becoming more and more available with the advent of large ground based telescopes (VLT, Keck, ALMA) and space missions (SPITZER, HERSCHEL).
2 The data
2.1 ISOCAM-CVF data redution
A complete scan of the two long-wavelength Circular Variable Filters (CVF) was performed going down in wavelengths, step by step, first from 16.2 to (LW-CVF2) and second from 9.4 to 5.0 m (LW-CVF1). At each CVF step, between 7 and 11 frames of 2.1 sec were taken. The total observing time was 2974 sec. The pixel field of view was 6′′ and the full field of the observation centered on RA=4:52:8.2 and DEC= -66:55:16 (J2000). The data reduction was performed as described in Boulanger et al. (BoulangerCVF (2004)). The reduced data cube can be retrieved from the ISO archive at the site http://www.iso.vilspa.esa.es as Highly Porcessed Data Products (HPDP) under the name Mid-IR Spectro Imaging ISOCAM CVF Observations.
2.2 Near Infrared Broad band filters data
Near Infrared and deep images of N4A were obtained with the Dupont 2.5m telescope at Las Campanas Observatory (Chile) in the night of December 27, 1996 with the 256 x 256 NICMOS III camera IRCAM (Persson et al. 1992). The spatial resolution of the system was 0.35” /pixel, and the typical seeing was 0.9 ″in .
The observation consisted of a series of 10 frames, each individual frame with an integration time of 20 sec per filter. This procedure was repeated in a 9 position mosaic with separation of 20 ″. The total integration time in each filter resulted in 1800 sec in , 1800 sec in , and 2000 sec in . Sky frames in each filter were taken in a field with faint stars and no extended emission at 12″W and 134″S of the source position. The sky field was observed in a similar way as N4. To produce the final images, each image was flat fielded and sky subtracted, and then median averaged combined using IRAF procedures. The final images were registered with respect to the image by means of several common stars. The resulting mosaic covers a 65″ 76″area.
Aperture photometry in each filter was performed with IRAF/DAOPHOT on the mosaic. For the purpose of this study we concentrated on the sources brighter than 13. The stars associated to N4A are shown in Figure 5. Table 1 gives the NIR magnitudes and colors of these stars. The photometric errors are =0.06 mag, = 0.05 and =0.03. Photometry of stars in our mosaic far from the N4A nebulosity were compared to their 2MASS photometry showing a good agreement. We estimated the flux contribution from the nebulosity to our measured photometry to be less than 10% and 5% in the in the bands, respectively.
3 Results
3.1 The Mid–Infrared Spectrum of N4A
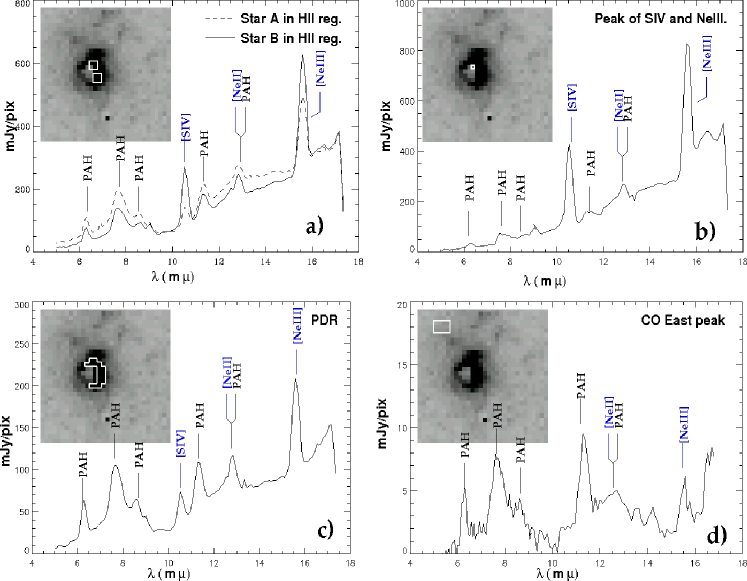
Figure 2 shows the MIR spectra of 4 regions in N4A representative of 4 typical components of an HII complex. The upper left panel spectra (a) were produced by averaging 4 pixels (6/pix) centered in the position of the two main exciting stars in N4A. The upper right panel (b) shows the spectrum of the ionized gas peak emission. The bottom left spectrum (c) is the average of 18 pixels on the bright north-east front of N4A; the bottom right spectrum (d) corresponds to the CO eastern peak, outside the ionized cloud (Contursi et al. Contursi (1998)).
The spectra around the stars (a) and on the north–east front (c),
are dominated by the AFEs and a continuum longward of 10 m which
becomes more and more prominent approaching the stars (b and a). AFEs are stronger
in the north-east front of N4A, as expected in a
region where both density and ISRF are high. This spectrum (c) is typical of PDRs confirming that this region is
the interface between the HII region and the molecular cloud of N4A.
In the spectra (panel a) corresponding to the regions close to the stars the prominent
features are the fine structure gas lines of
SIV at 10.5 m, NeII at
12.8 m (although blended with the AFE at 12.7 m) and NeIII at 15.6 m. The AFEs over continuum ratio reaches its
minimum in the region where the fine structure line are the most intense (b) and AFEs practically
disappear.
The spectrum (d) towards the eastern CO peak presents very weak AFEs and almost no continuum.
These are characteristics of quiescent regions and suggest that the emission arises
from a thin external shell of the molecular cloud probably corresponding
to its red velocity component.
From this global spectral analysis it appears that N4 MIR dust and
gas properties are very similar to what is found in galactic HII complexes (Cesarsky et al. 1996b , 1996a ), i.e. its MIR emission spectrum is typical of a
HII/PDR/Molecular Cloud combination.
3.2 Emission in the single dust bands and gas lines
Thanks to the very high signal to noise and
the fact that we have spatial and spectral information on a region
of 33 centered on N4A, this data set is
perfectly suitable for a detailed spectral and spatial analysis in the single
AFEs, gas lines and pure continuum.
We produced images in each dust feature (namely,
6.2 m, 7.7 m 8.6 m 11.3 m) and
fine structure lines (SIV, NeII and NeIII) in the following way.
Following Boulanger et al. Boulanger2 (1998), we performed Lorentzian fit on the dust bands and Gaussian fit on the gas lines,
to the whole data cube, producing
maps in each dust feature and fine structure line of the ionized gas.
First we fit together the 6.2 m, 7.7 m and 8.6 m bands and a straight
line as continuum letting the slope vary at each pixel.
Then, we fit together the SIV, 11.3 NeII(+12.7 m) and NeIII lines, and a straight line as
continuum.
The reason why we separately fit the two
parts of the spectrum is because in the HII region core the continuum shortward and longward 10 m
might not have the same origin and therefore the same slopes (see discussion in Sec.4.2).
We then subtracted the fitted lines and bands from the original data-cube, pixel by pixel
producing ‘pure’ continuum spectra. We visually inspected the subtracted data cube
to ensure that no ‘absorption’ features due to overestimated lines/features were produced.
From the ‘pure’ continuum spectrum,
we built images in the ISOCAM LW5 (6.5–7.0 m) and LW9 (14–16m) filters.
They represent the pure continua shortward and longward 10 m, respectively.
The NeII(12.7 m) line was fitted with a Gaussian on the whole cube,
even though we know that it is blended with the aromatic feature at 12.7 m
which should be fitted with a Lorentzian. Therefore the NeII image contains also the 12.7
m AFE.
The resulting images are shown in Figures 3 and 4.
All emission shown hereafter are
clipped at 3.
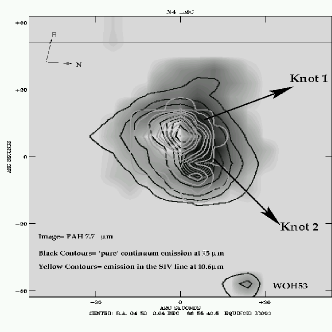
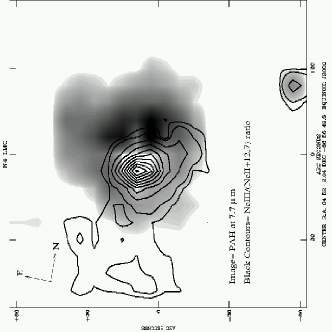
Figure 3111Maps obtained
from the CVF data have not been rotated
north-south because at these wavelengths the images are undersampled and a rotation would conserve neither
the flux nor the
spatial distribution. To make the comparison among data at other wavelengths easier, we have rotated the
H and the NIR images to the same ISOCAM orientation. shows the 7.7 m emission obtained through Lorentzian
fits. Contours represent
the SIV line emission obtained applying Gaussian fits (gray) and the
‘pure’ 15 m (LW9) continuum emission (black).
In this image it is clear that the AFE is coming from a shell surrounding the HII region
core and that this shell is particular bright in the PDR (i.e. in the North-East front).
There are 2 bright compact knots on this shell (numbered in Figure 3), not resolved at the 7.7m resolution
(7). Most of the ionized gas emission arises from the cavity formed by the dust shell
and it seems centered on a point like source. A similar result has been
published recently by Zavagno et al. (Zavagno (2006)) on the massive galactic
star forming region RCW 79. The 15 m pure continuum
emission peaks close to knot#2 in the PDR dust shell and
has a weaker emission in the 7.7 m cavity where SIV peaks.
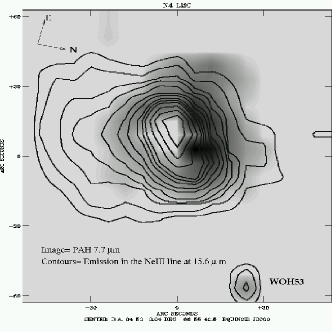
Figure 4 shows the 7.7 m image with the NeIII contours. The general picture is
very similar to that shown in
Figure 3: the ionized gas traced by the NeIII emission
is mostly contained in the dust cavity and it does not show a secondary peak corresponding to
the secondary peak seen in the
SIV line emission, although this can be due
in part to the poorer resolution at 15.6 m than at 10.5 m. The main
difference between the two ionized gas lines emission is that the NeIII
emission is much more extended than the SIV emission towards the south part of the nebula.
This is also the side where the HII region is partially bounded
(Heydari-Malayeri and Lecavelier des Etangs Heydari (1994)) and where the gas can expand.
All other images in the other dust bands (not shown here) are very similar
to the 7.7m emission. The NeII(+12.7 m) distribution is also very similar to
the distribution of the other AFEs everywhere but in the HII region core where
there is a peak. This suggests, as expected, an increasing contribution of the NeII line to the
12.7 m feature when approaching the exciting stars. We will come back to the
relative contribution of the NeII line and the 12.7
m AFE in Sec. 4.1.
3.3 J,H and Ks photometry.
The
composite image of N4A (Figure 5) shows an extended and diffuse
emission whose morphology is very similar to the shape of the
H emission seen in Figure 1 and with NIR color quite uniform
across the nebula.
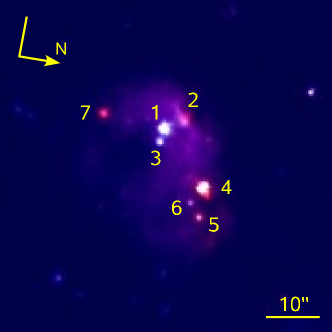
Seven stars are visible (numbered in Figure 5.).
Stars and are the bluest while the others are much redder.
Star , at the north-west of the nebula, is bright and red. Star is located
at the border north of the nebula and shows diffuse emission around it.
Photometry of all the seven stars is listed in Table 1 ordered by magnitudes .
The comparison with the position of the stars indicated by Heydari-Malayeri
and Lecavelier des Etangs (Heydari (1994)) as the two main exciting stars
(marked as A and B in Figure 1) suggests that they correspond to stars 1 and 3
in Figure 5. This
association however, is not certain because of the lack of astrometry in their data (their Fig. 2).
We believe that these are the exciting stars because if one associates
the H knot visible in their Figure at about (0, -27) from
the center of their field with our star7, the position of the two
exciting stars as indicated in their paper corresponds to the position of stars 1 and 3.
The comparison between the band and the
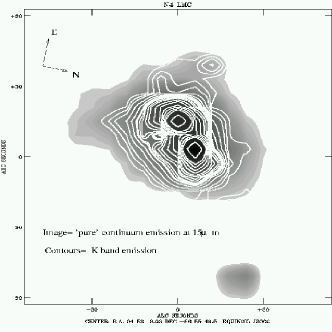
15 m ‘pure’ continuum emission (shown in Figure 6) clearly indicates
that star4 corresponds to the strongest peak of the pure continuum emission at 15 m.
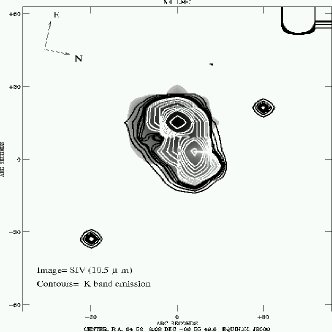
Figure 7 shows the band emission contours on the SIV line image.
The SIV emission is almost entirely arising in the region where the 2 bluest stars are located.
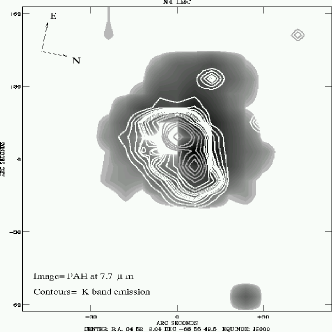
Finally, Figure 8 shows that one of the AFE peaks (knot in Figure 3) is close
but not totally corresponding to
the bright continuum source (star 4) and that knot is located north of the blue stars, very close
to where is the red elongated feature visible in the NIR composite
map (associated with 2 in Figure 5).
This suggests that this source and star 4 are embedded in a high density dusty region.
Note however, that the uncertainty on ISO-CVF data astrometry
(6) plus
the fact that the images at different wavelengths are slightly displaced with
respect to each
other (by up 1 pixel over the whole ISOCAM spectral range)
prevents us to use the ISOCAM astrometry to superpose images at different
wavelengths.
The method we used to align the CVF images with respect to each other and the CVF images on to
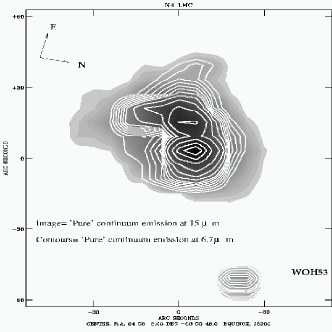
the band image, is matching the peak emission of the WOH53 star (marked in Figure 1).
From the comparison between the ISOCAM and NIR data we conclude that SIV and NeIII emission, i.e. the ionized gas,
are mostly associated with the bluest stars in the cavity of the dust shell. The 15 m continuum peak
is mostly associated with the red star4 very close but not coincident to one of the peaks of
the 7.7 m emission (knot ). Object corresponds to knot in the 7.7 m emission.
| Star Nb. | Jmag | (J-H) | (H-Ks) |
|---|---|---|---|
| Star 1(A) | 13.63 | 0.12 | 0.24 |
| Star 2 | 14.16 | 0.32 | 0.97 |
| Star 3(B) | 14.34 | 0.07 | 0.12 |
| Star 4 | 14.50 | 1.01 | 1.26 |
| Star 5 | 16.25 | 0.93 | 0.67 |
| Star 6 | 16.26 | 1.01 | 0.71 |
| Star 7 | 16.35 | 1.04 | 1.60 |
4 Discussion
4.1 The ionized gas
Figure 9 shows the NeIII/NeII ratio contours over the 7.7 m map. As explained above, this ratio has to be considered a lower limit, because AFE at 12.7 m and the NeII at 12.8 m are blended at the ISO spectral resolution. In general, the infrared NeIII/NeII ratio, practically not affected by extinction (Thornley et al. Thornley (2000) and references therein), is sensitive to the hardness of the UV radiation field. Thornley et al. Thornley (2000) studied how this ratio changes in a sample of star-forming regions belonging to starburst galaxies. They found that, excluding the two systems ( IZw 40 and NGC5253) in their sample with low metallicity, the NeIII/NeII ranges from 0.05 to 1. In a comparable range of NeIII/NeII ratios, Brandl et al. (Brandl (2006)) have shown that in a sample of starburst galaxies the Equivalent Width (E.W.) of the 7.7 m feature does not vary significantly. At higher () NeIII/NeII ratios, a weak anti–correlation has been found by Wu et al. (Wu (2006)) in a sample of Blue Compact Dwarf galaxies, i.e. low metallicity systems.
In N4 the NeIII/NeII ratio peaks in the HII region core, right on top of the bluest stars, with a value equal to 10 which is comparable to what has been found in IZw 40 and in 30Dor (Thornley et al. Thornley (2000)) and in other low metallicity galaxies (Wu et al. Wu (2006), Madden et al. Madden (2006)). However, the global ratio is 0.9, comparable with the typical value of the normal metallicity extragalactic HII regions. It is also noteworthy that there is an extended emission in NeIII/NeII(+12.7 m) ratio map in the south part of the HII region.
Table 2 shows the total flux of the fine structure lines SIV, NeII(+12.7 m) and NeIII. We checked whether the emission in the ionized gas lines of N4A agrees with the prediction of HII region models. We did not perform detailed calculation with models such as CLOUDY (Ferland et al. Ferland (1998)) or similar, because we have only 3 lines available, one of which is an upper limit. We instead compared our results with the model prediction from Stasińska (Stasinska (1982)) which gives the intensity of these lines relative to I(H). Heydari-Malayeri and Lecavelier des Etangs (Heydari (1994)) give an I(H) intensity equal to 4.510-11 erg/s/cm2 for a region centered on the exciting stars, of a radius equal to 21. In the same region we calculate the following ratios:
| (1) | |||
Assuming for N4 the physical parameters given in Heydari-Malayeri and Lecavelier des Etangs (Heydari (1994) their tables 6 and 8), i.e. Teff40000-45000 K, 100 cm-3, [N]/[H ]=11.3e-6, [O]/[H]=2.6e-4, [Ne]/[H]=3.2e-5, [S]/[H]=6e-6, and a metallicity equal to Z/Zsol0.5, we found that the corresponding model from Stasińska (Stasinska (1982)) (IDD2) predicts the following ratios:
| (2) | |||
These values compare very well with those observed in N4, listed in Eq. 1. The model also predicts an HII region radius of 4.2 pc, which corresponds to an angular radius of 16.5 (assuming a distance for LMC equal to 52 Kpc). This is quite the size of the NeIII/NeII emission if one does not include the extended emission on the south, outside the dust shell. Therefore, what we have called the HII region core, finds here its justification. It also roughly corresponds to the size of aromatic features cavity.
| Aperture | F10.5μm(SIV) | F12.8μm(NeII+12.7) | F15.6μm(NeIII) | |
|---|---|---|---|---|
| 10-19 W/cm2 | 10-19 W/cm2 | 10-19 W/cm2 | ||
| Total | 68.7 | 51.6 | 65.0 | |
| This paper in SWS aperture | 8.3 | 6.8 | 10.4 | |
| Giveon et al. 2002 | 5.7 | 5.0 | 13.7 |
We now compare the flux we obtained with previously published similar data from ISO-SWS. Giveon et al. (Giveon (2002)) studied the mid-infrared fine structure lines emission of a sample of galactic and extragalactic HII regions, based on ISO–SWS spectra. N4A belongs to this sample. In order to compare our flux with those given in Giveon et al. (Giveon (2002)), we should extract the flux in the exact same aperture as ISO-SWS (1420). This is not possible with the ISOCAM data due to the fact that the pixel size of the images is 6 per pixel and any rebinning is unwarranted for quantitative calculation because the pixel size undersamples the PSF at all ISOCAM wavelengths. Therefore we can extract the flux in a box which is as close as possible (1218) to the size of the ISO-SWS aperture centered on the HII region peak. The fluxes we recovered are listed in Table 2. They agree within 30% with the ISO-SWS fluxes. This is less than the total uncertainties, calculated taking into account the ISOCAM photometry uncertainties (10%), uncertainties introduced by the fitting which we estimate to be 10% and the ISO-SWS photometric uncertainties (30%). Thus the total uncertainty is 33% because we did not include in the calculation the uncertainties due to the differences in apertures and in pointings which cannot be estimated.
The agreement between the fluxes we recovered from the ISOCAM data
treated with the continuum plus feature fitting technique and the ISO-SWS
fluxes, makes us confident on the reliability of the analysis presented here.
An interesting point is that the ISOCAM NeII+12.7AFE flux accounts for all the flux
in the ISO-SWS spectrum for NeII alone. This suggests that the contribution of the
12.7 m dust emission in the center of the HII region is negligible as it could have been guessed from the
weakness of the other dust features. Therefore, in the HII region core, the NeIII/NeII value
we calculated can be considered not an upper limit but the actual value which can now
be directly compared with the typical ratios of poor metallicity systems
given by Thornley et al. (Thornley (2000)).
4.2 Dust emission
4.2.1 Comparison with the current dust model
The AFE carriers are thought to be Polycyclic Aromatic Hydrocarbons (PAHs), composed by 50 up to few hundreds atoms, and transiently heated mainly by Far UV photons (6–13.6 eV). Their emission intensity is proportional to the product of the dust density and the ISRF, although it is certainly also depending on the hardness of the radiation field but in an unknown way. VSGs emit through a mechanism which is intermediate between the stochastic heating typical of PAHs and the thermal equilibrium of the classical big grains. In quiescent regions dominated by the general interstellar field, the dominant VSGs exciting mechanism is the stochastic heating which results in a smooth continuum peaking between 30-40 m. The emission mechanism becomes closer and closer to a standard thermal behavior when the radiation field gets more intense, such as in star–forming regions and PDRs. In these conditions, because of their quasi thermal behavior, the VSGs emission spectrum shifts toward shorter wavelengths.
Our observations are in total agreement with the picture generally accepted to explain the dust feature and continuum emission at MIR wavelengths. First, we have shown in Sec. 3.2 that the morphology of the emissions in all dust features, including the NeII+12.7 m if one exlude the HII region core, are very similar to one another, which strongly points towards a common origin and excitation mechanism for all AFEs.
Second, the spectra of N4 A presented in Figure 2 can be fully explained with the classical picture illustrated above: in the HII region core the continuum longward 10 m increases just because VSGs reach the thermal equilibrium regime, get hotter, thus producing a shift of their thermal emission spectrum to wavelengths shorter than 30 m. The opposite happens in quiescent regions, such as that corresponding to the eastern CO peak outside the HII region, where in fact almost no continuum is detected.
4.2.2 Origin of the continuum at MIR wavelengths
Since we have built ‘pure’ continuum images at 6.75 and 15 m, we can also investigate how these continua relate to AFEs. The origin of the MIR continuum in star-forming regions, PDRs and diffuse ISM, is a controversial issue. In principle it can be due to hot VSGs which emission, as we have explained above, shifts into the MIR ISOCAM wavelengths and/or a continuum related to the AFE (maybe simply due to a superposition of unresolved and weak bands). Figure 10 shows the 6.7 m ‘pure’ continuum’ contours on the 15 m ‘pure’ continuum emission image smoothed at the same resolution. Maps have been aligned on the WOH53 star. The two continua are very similar suggesting a common origin. On the other hand their morphology is not totally similar to the dust feature emission morphology: they are more centrally peaked than the dust feature emission which forms a cavity. We therefor conclude that, at least in conditions similar to those of N4, i.e. in HII region complexes, most of the continuum at MIR wavelengths , even at wavelengths shorter than 10 m, arises from VSGs and not from unresolved weak aromatic bands. This might not be the case in more quiescent regions like diffuse ISM, as indicated by the spectrum corresponding to the eastern CO peak (Figure 2) where almost no continuum at all has been detected.
4.2.3 Why is there no AFE in the HII region core?
In this section we investigate the reason why no AFEs are detected in the HII region core. The depression of AFE in high ISRF environments has been already observed in the Milky Way (Cesarsky et al. , 1996b ,1996a ), Small Magellanic Cloud (Contursi et al. , N66 (2000)) and in external galaxies (Galliano et al. Galliano (2003), Lu et al. Lu (2003), Houck et al. Houck (2004)). Recently, a high resolution study of the 3.3 m AFE (not included in the ISOCAM–CVF wavelength range) with ISAAC at the VLT in NGC253 and NGC1808 (Tacconi–German et al. Tacconi (2005)), has shown that AFE are strongly depressed with respect to the continuum close to where the super star clusters are located. For this reason these authors concluded that the PAHs may be a better tracer of B stars rather than more massive and earlier spectral type stars, as was already previously suggested by Peeters et al. (Peeters (2004)) on the basis of the analysis of a wide sample of galactic HII regions observed with ISO.
In the case of N4, almost no AFE is detected at all in the HII region core. This can in principle be explained with three possibilities:
-
•
1) stellar winds are capable to evacuate the HII region from AFEs carriers but not from gas;
-
•
2) Radiation pressure is capable to push away the dust but not the gas;
-
•
3) AFEs carriers are destroyed in very extreme Radiation Fields (RF).
Figure 3 shows
that the ‘pure’ continuum emission at 15 m has a secondary peak in the region
where the ionized gas peaks. This is also visible in the MIR spectrum centered on
SIV and NeIII peak (Figure 1 panel b) where almost no AFEs are visible but a
significant continuum is still detectable. This shows that dust can survive in HII cores.
As a consequence, the first two possibilities would imply that AFE carriers, VSGs and gas are
decoupled which is physically quite improbable.
We therefor conclude that the dominant mechanism has to be the destruction of AFE
carriers.
The question now is whether dust destruction is due
to the intensity or the hardness of
the radiation field, or both.
Recent results from Wu et al. (Wu (2006)) and Brandl et al. (Brandl (2006)) have shown
that PAHs E.W. stay quite constant for a wide range of UV hardness as traced by the NeIII/NeII
ratio and start to slightly decrease only at high () NeIII/NeII ratio in low
metallicity galaxies. More important is the result from Wu et al. (Wu (2006))
who showed that PAH E.W. is
strongly anti correlated with the product of the radiation field intensity and hardness.
We tried to investigate this issue as
illustrated in Figure 11. Here both panels
show the 7.7 m dust feature emission, the 6.75 and 15 m ‘pure’ continua emission
as function of the
ISRF energy density at 1600 (left panel) and as function of the NeIII/NeII ratio (right panel). The energy density at 1600 is in units of the solar neighborhood at the same
wavelengths as measured from Gondhalekar Phillips and Wilson
(Gondhalekar (1980)) and it has been
estimated in Contursi et al. (Contursi (1998)). These authors calculated at each wavelength the average emissions
in annuli centered on the main ionizing stars till 3 level.
The NeIII/NeII ratio is a tracer of the UV hardness. However, as already discussed in Sec.
4.1, at the ISOCAM spectral resolution, the NeII line emission at 12.8 m is blended with the
AFE at 12.7 m.
Therefor, in the case of N4, this ratio is a lower limit everywhere but in the HII region core,
where most of the flux can be ascribed to the NeII emission
line alone, as it has been shown in Sec. 4.1.
In order to enhance differences among AFE and ’pure’ continua emission, we have normalized each emissions
to their maxima.
Form Figure 11 we observe the following behaviors:
-
•
All dust components (AFEs, and the continua at the two wavelengths) show the same behavior: their emission increase till a certain value going from the outside toward the HII region center. They reach a maximum presumably on the PDR and then sharply decrease in the HII region core.
-
•
The AFEs’s drop is the steepest, followed by the the 6.7 m continuum and then by the 15 m continuum.
-
•
The AFE’s drop occurs first, i.e. at ISRF density and UV hardness lower than for the pure continua emission
-
•
The decline of all emission appears steeper when plotted versus the NeIII/NeII ratio than when plotted as function of the ISRF energy density
These results definitely point to a scenario where, given the same conditions,
AFE carriers are more easily destroyed than hot dust. In other words, these
carriers are destroyed by UV photons less energetic than those necessary to destroy
the carriers responsible for the ’pure’ continuum emission. If, following current
dust models, these two types of
carriers are associated with PAHs and VSGs, we can interpret this
behavior as an evidence that PAHs and VSGs are both destroyed but with
different efficiencies. Moreover, assuming that the
VSGs population has a certain size distribution, we can reasonably
think that
the continuum emission at lower wavelengths is dominated by smaller particles than those
responsible for the emission at longer wavelengths. In this framework,
the fact that the drop of the continuum at 6.7 m is stepper than the drop of the 15 m
continuum, can be interpreted as the fact that the destruction mechanism is more efficient
on smaller molecule/grain. This means that: the destruction
mechanism is likely to affect the dust size distribution.
This conclusion may have some important implications for understanding the ISM physic in dwarf galaxies.
Thornley et al. (Thornley (2000)) found
a NeIII/NeII ratio for IZw40 similar to what we measured in the very center of N4A (roughly a shell of
10 pc in radius) but in a much larger region (7001000 pc).
This means that the phenomena of destruction in such galaxies must occur in
much larger regions than in normal galaxies. This can be explained
by the fact that dwarf low metallicity galaxies have an average UV spectrum harder
than normal or starburst galaxies, due to a higher star formation rate per unit mass and
to the presence of more young and massive star clusters. The UV photons can travel longer
before being absorbed thanks to the fact that these systems have less dust (Madden et al. Madden (2006)).
All these factors point to a scenario where
in dwarf galaxies, PAHs have a higher probability to be destroyed than in normal metallicity
environments leading to an overall change of the galaxy dust size distribution. It seems also that,
at least in not extremely poor metallicity systems, this phenomenon is more important
than intrinsic chemical dust properties modification.
Unfortunately, from this analysis
no firm conclusion can be achieved about
the possible different roles played by the ISRF intensity and hardness on the dust
destruction mechanism. However, a weak evidence that the latter
has an impact stronger than the ISRF intensity might be deduced by the steeper
drop all dust emission show with the NeIII/NeII ratio
than that shown with the ISRF energy density.

4.3 Comparison with hot dust properties in galactic environments.
Metallicity is
a parameter which may significantly affect dust. In low metallicity environments,
such as those we expect to find in young distant galaxies, we expect dust to have
intrinsic chemical-physical properties
very different from those observed in normal metallicity galaxies,
just because dust forms and grows in an ISM with
very different
chemical enrichment and mechanical inputs (from both stellar winds and supernovae). These might
lead to un overall under-abundance of carbon based grains with respect to the abundance in normal
metallicity environments but also to dust feature emission profiles, widths and intensity ratios
different form those found in normal metallicity ISM.
In Section 4.2.3 we have shown that in N4 dust destruction could be, at least in part,
responsible for lack of
small molecules/grains, already detected on much larger scale with IRAS
in the Magellanic Clouds (Sauvage, Vigroux and Thuan Sauvage (1990)), although we might
have a total amount of carbon based molecule/grains lower than in Galactic HII regions. On the
other hand, we have detected strong aromatic features very similar to what is observed in the
Milky Way’s ISM. In this section we will analyse in more details the N4 dust features widths and intensity
ratios to understand their physical characteristics and how do they compare with
similar observations in galactic environments.
-
•
Dust feature intensities.
Figure 12 shows a comparison between the PDR spectrum in N4 (panel c in Figure 2) and the spectrum of one pixel in the PDR of NGC7023, after having subtracted a straight line continuum from both and scaled up the spectrum of NGC7023 to match by eye the 7.7 m feature of N4. There are no evidences, at least at the CVF spectral resolution (/50) of grain/molecules modifications due to metallicity resulting in differences in the features profiles or peak wavelengths shifts. Indeed, the shape and the relative intensities of the 6.2, 7.7 and 8.6 m features in NGC7023 and N4 match almost perfectly. There is an indication of a relatively lower 11.3 m feature in N4 than in NGC7023, which may be due to a higher level of PAH ionisation in N4 . This is plausible, since N4 is more active than NGC7023, even in its PDR region as it is witnessed by the presence of ionized gas lines totally absent in the NGC7023 spectrum (but see more details below in this Section). This confirms the result obtained by Vermeij et al. (Vermeij (2002)) which found that the AFEs characteristics of LMC HII regions are similar to those in the Milky Way.
Figure 12: Comparison between the spectrum of the galactic region NGC7023 (thick solid line) and the PDR spectrum of N4 (thin solid line), after continuum subtracted. NGC7023 spectrum has been scaled to match the 7,7 m feature of N4. -
•
Dust features widths
The analysis of the dust features conducted in this work is based on the assumption that their profiles are represented by Lorentzian. In this context, the widths of the features have a physical explanation. Boulanger et al. (Boulanger2 (1998)), proposed that the emitting mechanisms of the AFE’s carriers is the internal vibrational redistribution. The bands widths arise from intramolecular broadening processes in large molecules and are related to the very short life–time of the emitting levels.
One of the byproducts of the fitting technique we have used, are the widths of the fitted Lorentzian through the entire data cube (i.e. wavelengths). We can therefore compare what obtained for N4 with the range of widths that Boulanger et al. (Boulanger2 (1998)) found for typical galactic regions (namely Ophiuchus and NGC7023). Figure 13 shows such a comparison. We have calculated the mean widths of N4 obtained by the fit, taking into account all pixels with a signal greater than the 3 of the r.m.s. at each wavelengths (filled circles) and the median for the PDR region only, i.e. the same region shown in panel c of Figure 2 (filled triangles). The open stars corresponds to the mean FWHM values found for the two galactic regions by Boulanger et al. (Boulanger2 (1998)). We exclude the 12.7 m feature because we fitted it with a Gaussian and not with the Lorentzian as in Boulanger et al. Boulanger2 (1998). The agreement is very good at all wavelengths showing that also this parameter is very similar to that observed in galactic environments despite the fact that Ophiuchus and NGC7023 are in ISRF much less intense than N4. -
•
Dust feature ratios
Reach et al. (2000) found that the 11.3 /7.7 m ratio was higher in SMCB1-1, a relatively quiescent cloud in the Small Magellanic Cloud (SMC) not associated with on-going star formation, than in various ISM regions in the Milky Way. This was attributed to an enhancement of the C-H bonds with respect to the C-C bonds, due to the higher H/C abundance ratio in the SMC than in the Milky Way.We have produced AFE feature ratio maps (not shown here), to study their variation across the region. The mean 11.3/7.7 m (C–H/C–C) value is 0.25 very similar to what found by Boulanger et. al. (1996) in -Oph and smaller than the value in SMCB1-1 ( 0.8). A collection of 11.3/7.7 m ratios in different galactic ISM by Lu et al. (1998) though, clearly indicates that this ratio has a large dispersion even in similar ISM phases. Therefore, the analysis of the dust feature ratio confirms that in N4 the dust feature ratio are comparable to what found in many other regions. An important result is that this ratio is quite constant on the dust shell, indicating that whatever is the state of the AFE carriers, i.e. ionized/neutral, hydrogenated or modified from metallicity, there are no strong differential effects on the dust feature emission, and therefore presumably on the dust conditions, at least at this spatial resolution ( 2 pc assuming a LMC distance of 52 Kpc).
The changes in the profiles of the dust features and their relative intensities can tell a lot about the physical state of AFEs carriers if associated with PAHs (Pauzat, Talbi and Ellinger Pauzat (1997), Le Page, Snow and Bierbaum Page (2003), Dartois and D’Hendecourt Dartois (1997), Bakes, Tielens and Bauschlicher Bakes (2001)). While the first analysis is impossible at the ISOCAM-CVF spectral resolution, we can analyze how AFE ratios change in N4 as function of the ISRF intensity.
It is believed that PAHs in PDRs are mostly ionized. Ionization of PAHs leads to an enhancement of the intensities of the features arising from the C–C bonds (6.2 and 7.7 m bands in the ISOCAM wavelengths range) with respect to those arising from the C–H bonds (8.6 m in–plane and out-of plane (oop) solo, duo, trio and quatro at 11.3, 11.9, 12.7 and 14 m, respectively). Dehydrogenation weakens the C–H bonds. Therefore the ratio between any feature arising from C–H bonds with a feature arising from C–C bonds, should decrease as ionization and dehydrogenation increase. Figure 14 upper panel shows the 11.3/7.7 m ratio (oop C–H/ vibration C–C) as function of the ISRF. There is a weak decreasing trend indicating that either ionization and or dehydrogenation are perhaps weakly increasing as approaching the HII region core. On the other hand, in the very center there is an increase of this ratio probably due to the fact that here smaller molecules (which emit at shorter wavelengths) are destroyed before larger species. Verstraete et al. (Verstraete (1996)) analyzed the oop C–H to in plane C–C dust features ratio, traced by the (11-13)/(6.2+7.7) m ratio. Theoretical predictions show that this ratio is 2.5 for neutral PAHs and 0.25 for cations. Figure 14 bottom panel shows a similar ratio where in place of the 11-13 emission features we calculated the 11.3+12.8 m emission. These ratios are well below those predicted for neutral PAHs everywhere in N4, and very close to the value for ionized PAHs, suggesting that PAHs are ionized in the whole region. Note that in the HII region core, this ratio is an upper limit because the 12.7 m emission is almost entirely due to NeII rather than the AFE at 12.7 m. We therefore conclude that if PAHs are the carriers responsible for the dust features, in N4 they are almost totally ionized, and that their state of ionization and /or dehydrogenation is quite constant all over the region. Probably, in order to detect the transition between neutral to ionized PAH, one has trace the PAH emission from diffuse ISM to active regions.
In conclusion, we have clearly shown that three fundamental parameters of AFE, namely, emission intensities, features typical widths and emission ratios are all very similar to what is typically found in normal metallicity ISM.


5 The stellar content
The NIR data presented in this paper unveil at least 7 bright sources. Figure 15 show a NIR color–magnitude diagram (right panel) and color-color (left panel) of stars numbered as in Figure 5 whose photometry is reported in Table 1. These are shown as red pentagons in the Figure 15. This Figure includes for comparison the IR data obtained for two other LMC star forming regions, 30 Doradus (Rubio et al. Rubio (1998)) and N11 (Barbá et al. Barba (2003)). In each figure’s panel is plotted the zero age main sequence (ZAMS) adopted from Hanson, Howard and Conti (Hanson (1997)) and the extinction tracks for the reddening law of Rieke and Lebofsky (Rieke (1985)).
Note that the extinction for star is likely to be much higher than the average as this star falls in the dust shell and on the 15 m continuum peak. Four N4 IR sources show colors which are consistent with reddened main sequence O stars, while the other three are IR objects.
From Figure 15 we can conclude the following:
- 1) Star and are probably moderately reddened main sequence O stars with . They are the main ionizing stars responsible for the HII region (Heydari-Malayeri and Lecavelier des Etangs Heydari (1994)) and labeled as A and B in Figure 1.
-2) Stars and are highly reddened main sequence O stars with . They do not have optical counterparts.
-3) The IR objects labeled , , and have large IR excess and their colors are not that of reddened young main sequence stars. They lie in the border of the molecular cloud seen in CO (Contursi et al. Contursi (1998)) and at the edge of the cavity formed by the ionizing stars. These three objects have band brightness corresponding to Class I and /or Herbig Ae/Be objects candidates (see Brandner et al. Bradner (2001)). Stars and have the largest IR excess of the sample. They have IR characteristics of massive young Stellar Objects(YSO’s) similar to N122 in 30Dor. Object is an extended object which shows nebulosity around and a second red component.
5.1 The nature of star 4
This is the brightest member of a small cluster and it is of particular interest because it corresponds to a bright point source emission in the hot dust pure continuum emission. Its position in the NIR color-color and color-magnitude diagram is similar to that of IR sources found in 30 Doradus, i.e. source W30, N122 and N126 (Rubio et al. 1998). These 30 Doradus sources were resolved into multiple compact young massive systems from high resolution HST/NICMOS observations, with a dominant IR source (Walborn, et al 2002, Walborn, Maiz-Apellaniz, Barba, 1999). The IR color of star #4 can be either interpreted as early O type star with Av= 20 and with a IR K excess of about 4 magnitudes or a multiple object containing several ZAMS O3 stars extinguished by 20 magnitudes. In fact, the star profile is wider than the point spread function derived for the stars in the Ks image, which could be a hint of the presence of a much redder component, thus favoring the hypothesis of a multiple system.
We can check the results on the nature of star obtained from NIR photometry, with the comparison of our ISOCAM and NIR data with those published by the ISOGAL team (Felli et al. Felli (2002)). The LW2 and LW3 broad band magnitudes obtained through PSF fitting are: m(LW2)= 6.1 and m(LW3)= 3.4. Then, the position of star 4 on the [15]–[7]-[15] magnitude-color diagram published by Felli et al. (Felli (2002)) falls exactly in the region occupied by Young Stellar Objects (YSOs).
A third indication that this objects contains indeed an YSO, is given by its CVF spectrum shown in Figure 16. It shows a deep silicate absorption at m which suggests this is a high embedded source. This is also confirmed by the fact that star corresponds to the strongest peak of the 15 m pure continuum emission. In the spectrum are also visible two weak absorption features at 13 m 15m. We checked whether they are due to memory effects of the detector after a glitch. The result is that most likely, the feature at 13 m is fake but that at 15 m seems real. If it is so, it could be associated with the solid CO2 bending mode at 15.2 m or to gas phase CO2 at 15.0 m. Both types of emission are detected in YSOs (van Dishoeck vandishoeck (2004)). The fact that the overall spectrum shown in Figure 16 does not look like a typical YSO MIR spectrum (van Dishoeck vandishoeck (2004)) could be due to the ISO spatial resolution; the ISOCAM beam is in fact sufficiently large (2 pc at the LMC distance) to include a considerable amount of ISM surrounding the YSO, as suggested by the presence of AFEs. To our knowledge this would be the first time that the CO2 absorption band is (marginally) detected in extragalactic YSOs, although SPITZER will certainly discover and study many more. Since such feature, together with the solid CO2 stretch mode at 4.25 m and H2O at 3 m (out of our wavelength range) has been observed at higher resolution with ISO-SWS in some Ultra Compact HII regions (Roelfsema et al. Roelfsema (1998)) this would support our hypothesis that star4 is an embedded YSO.

6 Conclusion
In this paper we have analyzed the ISOCAM CVF and new photometry data of the HII region complex N4 in the Large Magellanic Clouds. The analysis has two principal aims: 1) to relate dust, gas and stellar content; 2) to look for effects of the lower than galactic metallicity on the dust features. The main conclusions are the following.
-
•
The overall MIR spectral characteristics of N4 can be fully explained with the current dust models. The continuum + dust features + gas lines properties are those of a typical galactic HII complex which can be interpreted as the combination of three primary components: HII region core+ PDR+ parental molecular cloud.
-
•
Thanks to a fitting technique through the entire CVF data cube, we can produce maps in the single dust features, gas lines and pure continuum. We find that the HII region core is completely devoid of dust features. This dust cavity contains most of the ionized gas. The pure continuum emission seems to have the same origin at all wavelengths, but it is probably arising from a population of grains different from the AFE carries. Following the current dust models this component can be totally ascribed to VSGs.
-
•
The comparison between the ISM emission and the stellar content of N4 derived from NIR photometric data, reveals that the two bluest stars are the main ionizing stars of N4A: they reside in the HII region core, i.e. in the center of the AFE cavity and where the ionized gas peaks. The pure continuum emission peaks on a point source which shows strong evidences to be a group of massive young stars containing a deeply embedded YSOs.
-
•
A detailed comparison of the relative spatial distribution and intensities of the dust features as function of the intensity of the radiation field, suggests that the HII region core does not contain PAHs because they are destroyed. We show that this mechanisms is selective depending on the grains sizes, the smallest grains/big–molecules, being destroyed first. This can lead to an overall modification of the grains size distribution which can be significant in relatively low metallicity dwarf galaxies, where these processes act on large portions of their ISM. We also argue that this mechanism is more important than any intrinsic dust modification due to the relatively low metallicity of LMC.
-
•
The comparison between the widths and the intensity ratios of the dust features in N4 and in other galactic environments shows that there are no evident and significant signs of metallicity effects on AFE’s carriers in N4
-
•
The analysis of the dust features intensities ratios and their comparison with model predictions, indicates that, if PAHs are the particles responsible for the AFEs, they are fully ionized over the entire analyzed region.
-
•
The IR stellar content of the N4 shows several bright IR sources with characteristics of massive early O type stars similar to those found in 30Doradus. IR spectroscopy of these sources would confirm their very young and massive nature.
Acknowledgements.
A.C. wishes to thank D. Lutz for his useful comments which significantly improved this paper.References
- (1) Bakes, E.L.O., Tielens, A.,G.,G.,M., and Bauschlicher, C., W., 2001, ApJ, 556, 501
- (2) Barbá, R., Rubio, M., Roth, M., et al., 2003, AJ, 125, 1940
- (3) Boulanger, F., Boisssel P., Cesarsky D., and Ryter C., 1998, A&A, 339,194
- (4) Boulanger, F., Lorente, R., Miville Deschenes, M.A., et al. ,2005, A&A,436,1151
- (5) Bradner, W., Grebel, E. K., Barbá, R. et al., 2001, AJ, 122, 858
- (6) Brandl, B. R., Bernard-Salas, J., Spoon, H. W. W., et al. , 2006, ApJ, 653, 1129
- (7) Cesarsky, D., Lequeux, J., Abergel, A., et al. , 1996, A&A, 315, 305
- (8) Cesarsky, D., Lequeux, J., Abergel, A. et al. , 1996,A&A, 315, 309
- (9) Contursi, A., Lequeux, J., Hanus, M., et al. , 1998,A&A,336, 662
- (10) Contursi, A., Lequeux, J., Cesarsky, D., et al. , 2000,A&A,362, 310
- (11) Dartois, E. and D’Hendecourt, L., 1997, A&A, 323, 534
- (12) Ferland, G. J., Korista, K. T., Verner, D. A., et al. , 1998, PASP, 110, 761
- (13) Galliano, F., Madden, S. C., Jones, A.P., et al. , 2003,A&A, 407,159
- (14) Giveon, U., Sternberg, A., Lutz, D., et al. , 2002, ApJ, 566, 880
- (15) Gondhalekar, P. M., Phillips, A. P., and Wilson, R. 1980,A&A, 85, 272
- (16) Hanson, M.M., Howard I.D., Conti, P.S., 1997, ApJ, 489, 698
- (17) Henize, K.G., 1956, ApJSS 2,315
- (18) Heydari-Malayeri, M. and Lecavelier des Etangs, A., 1994, A&A, 291, 960
- (19) Houck, J, Charmandaris, V., Brandl, B., et al. , 2004, ApJSSI
- (20) Felli, M., Testi, L., Shchuller, F., et al. , 2002, A&A9392,971
- (21) Le Page, V., Snow, T.,P., and Bierbaum, V.M., 2003, ApJ, 584, 316
- (22) Peeters, E., Spoon, H. W. W. and Tielens, A. G. G. M., 2004, ApJ, 613, 986
- (23) Lu, N., Helou, G., Werner, M.W., et al. , 2003, ApJ, 588, 199
- (24) Madden, S. C., Galliano, F., Jones, A. P., et al. , 2006, A&A, 446, 877
- (25) Pauzat, F., Talbi, D., and Ellinger, Y., 1997, A&A, 319,318
- (26) Rieke, G.H., and Lebofsky, M.J., 1985, ApJ, 228, 618
- (27) Roelfsema, P., Cox, P., Hessler, M.F., et al. , ASP conference Series, Vol 132, Yum J.L., and Liseau R. eds.
- (28) Rubio, M., Barbá, R., Walborn, et al., 1998, AJ, 116, 1708
- (29) Sauvage, M., Vigroux, L., and Thuan, Y., X., 1990, A&A, 237,296
- (30) Stasińska G., 1982,A&AS, 48,2999
- (31) Strom, K. M., Kepner, J., and Strom, S. E., 1995, ApJ, 438, 829
- (32) Tacconi–Garman, L.E., Sturm E., Lehnert M., et al. , 2005,A&A, 432, 91
- (33) Thornley, A.,D., Förster Schreiber, N., M., Lutz, D., et al. , 2000, ApJ, 539, 641
- (34) Van Dishoeck, E.F., 2004, ARA&A, 42, 119
- (35) Vermeij, R., Peeters, E., Tielens, A.G.G.M, et al. , 2002, A&A, 382,1042
- (36) Zavagno, A., Deharveng, L., Comer n F., et al. , 2006, A&A,446, 171
- (37) Verstraete, L. ,Puget, J.L., Falgarone, E. et al. , 1996, A&A, 315, L337
- (38) Walborn, N.R., Barb , R., Brandner, W., 1999, AJ, 117, 225
- (39) Walborn, N.R., Maiz-Apellaniz, J, Barbá, R., 2002, AJ, 124, 1601
- (40) Wu, Y., Charmandaris, V., Hao, L., et al. , 2006, ApJ, 639, 157