INAF - Istituto di Astrofisica Spaziale e Fisica Cosmica di Palermo, Italy INAF - Osservatorio Astronomico di Brera, Italy ASI - Science Data Center, Italy PSU - Department of Astronomy & Astrophysics, USA \PACSes\PACSit98.70.Rz-ray source; -ray bursts \PACSit01.30.CcConference proceedings
Pile-up correction for the Swift-XRT observations in WT mode
Abstract
The detector at the focal plane of the Swift X-ray Telescope (XRT) supports four readout modes, automatically changed on board, to cover the dynamical range of fluxes and rapid variability expected from GRB afterglows. The Windowed Timing (WT) mode is used for sources with flux higher than a few mCrab and is obtained by compressing 10 rows into a single row, and then reading out only the central 200 columns of the CCD. Point sources with a rate above 300 c s-1 produce severe pile-up in the central region of the Point Spread Function. This paper presents three methods to correct the effects of the pile-up in WT mode. On ground calibration results and data from the very bright GRB 060124 are used to define and test these methods.
Pile-up in Charge-Coupled Devices (CCD) is produced by the detection of two or more photons within the same region at the same gate time interval. The detector is unable to resolve individual signals and a single event with the sum of the pulse heights is detected [1]. The effect of pile-up is a lowering of the source rate and a hardening of the observed spectrum. The detection area for Swift-XRT[2] CCD in WT mode is a 7 1 pixel string; the charge produced by an X-ray photon is spread over this region with several shapes. A classification of these shapes is performed associating a grade number to each of them: low grades correspond to confined charge distributions and high grades to extended distributions. A further effect of the pile-up is to change the event grade distribution with respect to the one expected from a faint source: pile-up events with low grade can be recorded as a single higher grade event producing a change in the grade distribution.
Swift-BAT triggered GRB 060124 on a precursor and the XRT started observing it in WT mode; during the first sequence the count rate of the burst was high enough to cause pile-up in the data[3]. Ground testing and calibration of the XRT integrated system carried out at the Panter laboratory showed that WT mode data are affected by pile-up for point source intensities 250 c s-1.
Three different methods have been developed to check for the presence of pile-up and estimate the inner PSF region to be excluded. To study the methods for correcting the pile-up effects 5 rate intervals during which the observed source count rate was 100, 100–200, 200–300, 300–400, and 400 c s-1 were selected.
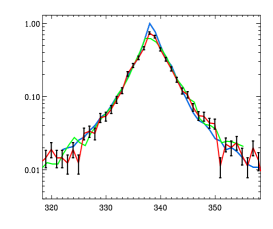
The first method is based on analysis of the radial intensity profile. The region affected by pile-up is determined comparing the detected Point Spread Function with the one obtained from on-ground calibration. The region to be excluded from the analysis is the one that presents a number of counts lower than the expected one (see Fig.1 left panel).
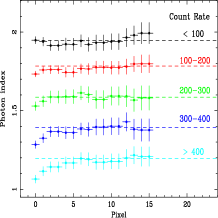
The second method is based on the effects that pile-up generate on the spectral distribution. The spatial region affected by pile-up is determined comparing the photon index detected in regions with a central region of increasing size excluded from the accumulation. The source is no longer piled-up when the spectral index does not show variations (see Fig.1 central panel).
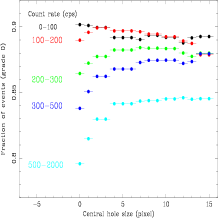
The last method is based on the effects generated on the grade distribution. A good approximation of the expected grade distribution with no pile-up is obtained when the deficit at grade zero, associated with an increase at higher grades, becomes negligible (see Fig.1 right panel).
All the three different methods give equivalent results for the size of the central region that must be excluded (4 pixels at rates 400 c s-1 for the specific case of GRB 060124).
Acknowledgements.
This work is supported by the COFIN MIUR grant prot. number 2005025417, and at Penn State by NASA contract NAS5-00136.References
- [1] \BYDavis J. \INApJ5622001575.
- [2] \BYBurrows D. et al. \INSpace Science Rew.1202005165.
- [3] \BYRomano P. et al. \INA&A4562006917.
- [4] \BYMoretti A. et al. \INProceedings of the SPIE58982005360.