A mid-infrared spectroscopic study of submillimeter galaxies: luminous starbursts at high redshift
Abstract
We present rest frame mid-infrared spectroscopy of a sample of 13 submillimeter galaxies, obtained using the Infrared Spectrograph (IRS) on board the Spitzer Space Telescope. The sample includes exclusively bright objects from blank fields and cluster lens assisted surveys that have accurate interferometric positions. We find that the majority of spectra are well fitted by a starburst template or by the superposition of PAH emission features and a weak mid-infrared continuum, the latter a tracer of Active Galactic Nuclei (including Compton-thick ones). We obtain mid-infrared spectroscopic redshifts for all nine sources detected with IRS. For three of them the redshifts were previously unknown. The median value of the redshift distribution is if we assume that the four IRS non-detections are at high redshift. The median for the IRS detections alone is . Placing the IRS non-detections at similar redshift would require rest frame mid-IR obscuration larger than is seen in local ULIRGs. The rest frame mid-infrared spectra and mid- to far-infrared spectral energy distributions are consistent with those of local ultraluminous infrared galaxies, but scaled-up further in luminosity. The mid-infrared spectra support the scenario that submillimeter galaxies are sites of extreme star formation, rather than X-ray-obscured AGN, and represent a critical phase in the formation of massive galaxies.
1 Introduction
Less than a decade ago, observations with the Submillimeter Common User Bolometer Array (SCUBA; Holland et al. 1999) on the James Clerk Maxwell Telescope (JCMT) identified a new and unexpected population of submillimeter galaxies (SMGs: Smail et al. 1997; Barger et al. 1998; Hughes et al. 1998). Subsequent surveys with SCUBA and the Max-Planck Millimeter Bolometer (MAMBO; Kreysa et al. 1998) array at the IRAM 30m telescope resolved a significant fraction of the cosmic submillimeter background into individual sources (see Blain et al. 2002, and references therein).
A detailed understanding of this population has emerged only slowly, due to their faintness at all short wavelengths and the difficulty of counterpart identification. Photometric estimates of median redshifts around (Carilli & Yun, 2000) are consistent with the recent determination of a median redshift of for the of the population accessible to optical spectroscopy (Chapman et al., 2005). The optical redshifts of the radio/optical bright sub-class have been confirmed in cases through CO line detections (Frayer et al., 1998, 1999; Neri et al., 2003; Greve et al., 2005; Tacconi et al., 2006). Despite all these efforts, the characterization of the redshift distribution remains incomplete, because of the large positional uncertainties for SMGs without interferometric counterparts and the large uncertainties in purely photometric redshift estimates.
The tendency of SMGs to be faint in X-rays suggests that their large luminosities result primarily from high star formation rates (Alexander et al., 2003, 2005b). Moreover, dynamical and gas phase metallicity studies indicate that they have high (approaching ) baryonic masses (Genzel et al., 2003; Neri et al., 2003; Tecza et al., 2004; Swinbank et al., 2004; Greve et al., 2005; Tacconi et al., 2006). These high star formation rates and baryonic masses place SMGs at the assembly phase of massive galaxies at , in rapid and efficient starbursts likely fed by mergers.
The contribution of AGN to the energy output of SMGs has strong implications for the origin of the cosmic submm background and the origin of the correlation between black hole mass and spheroid mass/velocity dispersion in local galaxies (Ferrarese & Merritt, 2000; Gebhardt et al., 2000). Studies of the relationship between stellar and black hole mass in submillimeter galaxies, under the assumption of accretion at the Eddington rate, are consistent with a model where the supermassive black holes in SMGs undergo rapid growth to reach the local relation (Borys et al., 2005).
SMGs thus mark a pivotal point in the evolution of massive galaxies and their central black holes. Observational characterisation of their redshift distribution, space densities, masses, metallicities, AGN content, and structure are all needed to understand their position in the hierarchical growth of structure and the growth of massive galaxies by accretion of gas and merging of smaller galaxies. Models of hierarchical galaxy formation (e.g. Kauffmann et al., 1999; Baugh et al., 2003) are in the process of adapting to the new observational constraints including properties of the SMG population (e.g. Baugh et al., 2005; Bower et al., 2006). Extreme objects, such as the SMGs, can trace the formation of the galaxies already fully assembled at redshifts of (Cimatti et al., 2004). SMGs may also meet the constraint on rapid formation of low redshift massive ellipticals inferred from measurements of the /Fe element abundance ratios (Thomas et al., 2005).
Even at low resolution, rest-frame mid-infrared spectra of galaxies can discriminate between star formation and accretion (e.g. Genzel & Cesarsky, 2000, and references therein) on the basis of four distinct spectral components observed in dusty galaxies in the local universe (Genzel et al., 1998; Laurent et al., 2000; Tran et al., 2001): (i) strong emission from the polycyclic aromatic hydrocarbon (PAH) features found over a very wide range of star forming galaxies; (ii) a variable but usually small contribution of an HII region continuum steeply rising in the rest wavelength range; (iii) a flatter PAH-free AGN continuum, sometimes accompanied by additional AGN related silicate emission (Siebenmorgen et al., 2005; Hao et al., 2005); (iv) absorption features in the range as well as the silicate absorption feature (Spoon et al., 2004).
The anticorrelation between PAH feature strength relative to the AGN continuum and the ionization state of the ionized gas (Genzel et al., 1998; Dale et al., 2006) strongly supports these low resolution diagnostics. Using the Spitzer Space Telescope, the diagnostics based on the mid-infrared spectral components of dusty luminous and ultraluminous galaxies in the local universe can now be applied to dusty SMGs at high redshift. Our understanding of SMGs can be improved in three ways:
Verification or determination of redshift. Mid-infrared spectral features, in particular the narrow aromatic PAH features, if present, allow reasonably accurate redshift measurements () even for targets that are very faint at optical wavelengths. They can verify optical redshifts in cases where these are uncertain due to the faintness of the optical counterpart, due to the presence of multiple candidate counterparts (e.g. 8 of 73 SMGs in the redshift study of Chapman et al. (2005) have multiple radio/optical counterparts), or due to uncertain optical line identifications. Mid-infrared emission shares with CO line emission a reduced risk of an erroneous redshift assignment, because these tracers are more closely linked than the rest frame UV to the rest frame submm/far-infrared emission that dominates the SMG’s bolometric luminosity. They are thus less likely to measure the redshift of a misidentified neighbouring source. The difficulties of identification with an optical/near-infrared source can be seen for example in the case of HDF850.1 (Downes et al., 1999; Dunlop et al., 2004). For sources without known optical redshifts, new mid-infrared spectroscopic redshifts strongly reduce the template ambiguities that are always possible for model-dependent photometric redshifts. The advantage of the mid-infrared spectra over CO is that, with existing instrumentation, there is a larger fractional bandwidth coverage than for mm spectroscopy. The disadvantage is that for a possible tail of the SMG redshift distribution, the main PAH features leave the wavelength range of sensitive Spitzer spectroscopy.
Evaluation of the relative importance of AGN and star formation using the relative strength of PAH and continuum. Submillimeter sources are likely starburst-dominated but more luminous than the threshold above which most local infrared galaxies are AGN dominated (Rigopoulou et al., 1999; Veilleux et al., 1999; Tran et al., 2001). Furthermore, although massive ellipticals in formation should also be forming massive black holes in order to produce the relation (Tremaine et al., 2002), evidence for energetically dominant AGN is scarce (Alexander et al., 2003). Evaluating the ratio of starburst and AGN contributions will also allow us to investigate trends with other quantities. We adopt a ratio of PAH feature to local continuum of 1 as the border between starburst and AGN dominance in the bolometric luminosity, following the approach of Genzel et al. (1998) that is well matched to the rest wavelength coverage and S/N of our data. The rest-frame mid-infrared continuum, if isolated from the non-AGN components of the mid-infrared emission, can provide constraints on the role of AGN, including highly X-ray absorbed sources (Krabbe et al., 2001; Lutz et al., 2004). Mid-IR spectra tracing the re-radiation of absorbed AGN emission thus also constrain the presence of Compton-thick AGN that are hard to separate from inactive objects in current high redshift X-ray data, because their X-ray photon statistics can be insufficient for clear identification of reflected AGN emission, or because the AGN may be fully covered.
Constraining physical conditions in the starburst. By analogy with local galaxies, dilute/cool regions are expected to show a larger PAH contribution to the total infrared emission and a cooler rest frame far-infrared peak than denser starbursts (e.g. Dale & Helou, 2002). Very compact regions can show absorption features like those of water ice and hydrocarbons. Some of the most luminous local ULIRGs exhibit strong continua with superposed emission features deviating from a canonical PAH feature shape (Tran et al., 2001; Spoon et al., 2004). Similar features may be found in SMGs.
Spitzer spectra are also important to test the popular assumption (e.g. Hughes et al., 1998) that the overall spectral energy distributions (SEDs) of SMGs are similar to those of local star forming Ultraluminous Infrared Galaxies (ULIRGs).
In §2 we discuss the properties of our sample and in §3 observations and data analysis. §4 presents the SMG spectra and discusses the results of their spectral decomposition. In §5 we discuss the implications for the three main questions raised above.
2 Sample Selection
Among the several hundred SMGs detected up to now, our sample comprises exclusively bright () objects from blank field and cluster lens assisted surveys that have accurate positions from follow-up radio or mm interferometry. Objects from radio pre-selected surveys are not included because they may be biased in redshift and AGN content. No constraint on mid-infrared photometric flux, which could potentially introduce biases on SED and energy source, has been applied to this Cycle 1 sample.
The 13 targets in our sample (Tab. A mid-infrared spectroscopic study of submillimeter galaxies: luminous starbursts at high redshift) cover the full range of properties of currently known bright SMGs. The ratio of optical/near-infrared and submm fluxes, for example, varies by almost two orders of magnitude (Tab. 3). In our sample there are 6 objects with published optical redshifts (Barger et al., 1999; Ledlow et al., 2002; Chapman et al., 2005), in particular 3 cases where the redshift is confirmed by CO interferometry (Neri et al., 2003; Greve et al., 2005), and 7 sources for which no optical redshift is available due to their faintness in the optical/NIR. Including these objects in our study reduces biases that may affect a sample with measured optical redshifts only. The redshift distribution of a sample with optical redshifts will tend to avoid the optical “spectroscopic desert” (). It may also favour sources with unobscured or mildly obscured AGNs because of their strong rest frame UV line emission. We include sources selected at (SCUBA) as well as sources selected at (MAMBO), to minimize selection effects due to redshift or dust temperature. The sample encompasses the five brightest MAMBO sources with interferometric positions known before the Voss et al. (2006) observations, and a number of bright SCUBA sources with and without redshifts.
3 Observations and Data Analysis
We obtained low resolution ( 60-120111 is approximately constant as a function of ) long slit spectra using Spitzer IRS (Houck et al., 2004) in the staring mode. The detector is a Si:Sb (LL1 and LL2 modules) or Si:As (SL1 module) Blocked Impurity Band (BIB) array.
The rest wavelength range required to detect mid-infrared PAH features and/or silicate absorption, encompasses at a minimum wavelengths from to . Observations are summarized in Table A mid-infrared spectroscopic study of submillimeter galaxies: luminous starbursts at high redshift. Most of the sources were observed in the LL1 module for 30 cycles of 120 s ramp duration. The total on-source integration time was 2 hours from addition of the independent spectra created by the telescope nods along the slit. For objects with and most objects with unknown redshifts we added the LL2 range with 15 cycles of 120 s to ensure the required rest wavelength coverage for all plausible redshifts. In these cases, the slit on-source integration time for LL2 was 1 hour. Because of its low redshift, SMMJ163694057 was observed in the LL2 range for 10 cycles of 120 s, as well as in the SL1 module for 5 cycles of 240 s (2400 s total on-source integration time). With this observation plan, we could in principle detect both the and PAH features of a starburst-like spectrum for a redshift range . For lower redshifts, we would observe only the maximum, which fully exits the observed window at , but the longer wavelength 11.3 and PAH features might still provide useful information in such a case.
We reduced the data as follows. We subtracted, for each cycle, the two nod positions of the pipeline 14.0.0 basic calibrated data frames. In the difference just calculated, we replaced deviant pixels by values representative of their spectral neighborhoods. We subtracted residual wavelength dependent background, measured in source-free regions of the two dimensional difference spectra. In averaging all the cycles of the 2-dimensional subtracted frames, we excluded values more than three times the local noise away from the mean. The calibrated 1-dimensional spectra for the positive and the negative beams were extracted using the optimum extraction mode of the SPICE analysis package (version 1.4.1), and the two 1-dimensional spectra averaged in order to obtain the final spectrum.
Since our measurements are close to the sensitivity limit of the instrument, for all data analysis we cut away the long and short wavelength ends of each module, where the noise is much higher and no signals are detected.
In order to do a formal template fit for our sources, it is essential to determine the uncertainties on each point of the spectra. We used a processed and deglitched image of one of the undetected sources (the result was comparable for all of them). The uncertainty for each spectral point was calculated as the noise for each pixel times the square root of the number of pixels in the resolution element, which increases with wavelength. The noise for each pixel has been assumed to be the clipped standard deviation on a row of 20 pixels, all at the same wavelength. The resolution element is defined by the IRS pipeline, subdividing the region of the array covered by the spectrum into a sequence of trapezoid-shaped elements. This estimate may not fully reproduce the absolute noise level of a given observation, due to variations in strength of zodiacal light with position and epoch, but is a good approximation of the change of noise as a function of wavelength.
4 Results
The spectra of the nine detected sources and the four non-detections are shown in Fig. 1. As quantified by spectral fits below, the detections can be well reproduced by combinations of PAH features and continua. In one or two cases a heavily absorbed continuum is a possible alternative. We do not see evidence for strong continua like those seen in local QSOs (which also show silicate emission outside our rest wavelength coverage, see Siebenmorgen et al. 2005; Hao et al. 2005; Sturm et al. 2005). These individual classifications are strongly supported by the PAH-dominated average of the SMG spectra (Fig. 3), which shows much larger PAH equivalent widths than those seen in QSOs (Schweitzer et al., 2006).
In spectra of faint sources with poor S/N, only spectral features with sufficiently large equivalent widths can be used for redshift determination. At one extreme, these features are the strong PAH emission features of starburst galaxies. These features appear whenever the interstellar medium is exposed to moderately intense UV radiation (e.g. Draine, 2003). The other extreme shows strong absorption features, the strongest being silicate absorption. Examples of PAH features in high-redshift galaxies observed with the IRS are in Teplitz et al. (2005), Yan et al. (2005), Lutz et al. (2005a) and Desai et al. (2006). An extremely absorbed local source is IRAS F001837111 (Tran et al., 2001), whose IRS spectrum is shown in Spoon et al. (2004). Similar spectra have been observed in optically obscured high redshift sources (Houck et al., 2005; Weedman et al., 2006).
Redshifts can be determined by using either the set of strong PAH emission features or, for absorbed spectra, the maximum and nearby silicate absorption. The strongest PAH feature is at (rest frame), so a similar redshift () would be derived even if it is ambiguous whether the strongest feature is the maximum or true PAH emission. The physical interpretation of the source, however, would be very different for the two alternatives. In order to correctly identify a feature as a PAH, we require an indication that the PAH feature is present with the correct shape and (relative to the feature) flux. In our sample there is no case of ambiguity in identifying a feature with the 6.2 or PAH feature, since either both are detected or the large observed width indicates that it cannot be the narrow PAH feature. For one of our sources, template fits identify such a single broad maximum with the PAH feature but, depending on rest wavelength range and S/N, it is also conceivable to identify such a single broad peak with the maximum of absorbed spectra.
We estimate redshifts by fitting a selection of templates to the full spectra of the detected sources. Two of the templates are absorbed, likely AGN dominated, sources: NGC 4418 and IRAS F001837111 (Spoon et al., 2001, 2004). As a third template we use the starburst spectrum of M82 (Sturm et al., 2000), both as observed (with the spectrum dominated by pure PAH emission) and with superposition of an additional continuum that is assumed to vary linearly over the short wavelength range covered. This last spectrum is similar to those of local universe infrared luminous galaxies having significant contributions to their bolometric luminosities from both star formation and powerful AGN (e.g. NGC7469, Mrk273, Genzel et al. 1998). More complex fitting schemes have been used to interpret low resolution mid-infrared spectra, for example by allowing additional obscuration to the PAH dominated starburst component (e.g. Tran et al., 2001), or by decomposing the PAH component into individual features that can be well approximated by Lorentzians (e.g. Boulanger et al., 1998; Smith et al., 2006). We do not adopt such schemes here because of the S/N of our data and their rest wavelength coverage, which is usually limited to shortward of the silicate absorption by the IRS wavelength range.
Results of the fits with all the templates are listed in Table 2. The best fit for each object is specified in Tab. 3 and also shown in Fig. 1. The redshifts derived from the best fit for each object are also listed in Table 3 and compared with known redshifts where available. IRS and previous redshifts are consistent for all the sources with previous redshifts from optical spectroscopy (SMMJ094314700 by Ledlow et al. 2002, SMMJ105195723, SMMJ105215719, SMMJ163694057, SMMJ163714053 by Chapman et al. 2005) and sometimes from additional CO interferometry (SMMJ023990136 by Frayer et al. 1998, SMMJ094314700 by Neri et al. 2003; Tacconi et al. 2006, SMMJ163714053 by Greve et al. 2005). Three sources had no accurately determined redshifts. For these, our new redshifts are inside the 68% confidence intervals of the photometric estimates of Aretxaga et al. (2003) for at least three of the six different evolutionary models used. The formal fit uncertainties for the best fit are up to about but, because of the differences in derived redshifts depending on the template used (Tab. 2), we assume an uncertainty for all the sources. For the six sources with both IRS and optical/CO redshifts measured we derive a reassuringly small standard deviation of only 0.014 for the difference between the best fitting IRS redshift and independent optical/CO redshift. For the uncertainty of a new IRS redshift from a spectrum similar in quality to our spectra, we nevertheless prefer the more conservative which includes the possibility of template mismatch, since the smaller standard deviation for the six sources includes only spectra reasonably well fit by the M82 (plus continuum) templates. is an overestimate if the identification of PAHs in the spectrum is beyond any doubt. Table 3 also classifies sources according to how their spectra are characterized: PAH emission (M82 best fit), silicate absorption or maximum (IRAS F001837111 or NGC4418 best fit) or a superposition of PAH emission and a linearly rising continuum.
In the remainder of this section, we briefly describe the properties of the nine SMGs with new mid-infrared rest-frame spectra. We also discuss the four non-detections and constraints on their possible redshifts and/or SED properties.
SMMJ002661708 The best fit for this source is the combination of M82 PAH template and weak AGN continuum (see Fig. 1), but the test gives similar results also for the absorbed continuum NGC 4418 template (see Tab. 2). The spectrum lacks an evident PAH feature, the wavelength of which still falls in the observed band. We proceed with the best fitting PAH plus continuum interpretation but note that a classification of this source as an absorbed AGN is clearly not excluded. The previous photometric redshift of estimated by Aretxaga et al. (2003) is consistent with our spectroscopic value . Frayer et al. (2000) identify a faint ERO counterpart for this object and estimate a lensing magnification , which we adopt for our analysis.
SMMJ023990136 The mid-infrared spectrum of this source was already presented by Lutz et al. (2005a). It contains well detected and PAH features superposed on a strong continuum (see Fig. 1). This source is at the transition between predominantly starburst powered and predominantly AGN powered, according to the mid-infrared diagnostics of Genzel et al. (1998) and Laurent et al. (2000). AGN signatures are also seen in the optical spectrum (Ivison et al., 1998). Combining mid-infrared spectroscopy and Chandra X-ray observations (Bautz et al., 2000), we conclude that this source is powered by roughly equal contributions of star formation and a Compton-thick AGN (Lutz et al., 2005a), in agreement with constraints on the importance of star formation in this object from molecular gas mass and its position relative to the radio/far-infrared correlation (Frayer et al., 1998). Its luminosity (see Tab. 3) is calculated taking into account a lensing magnification factor of 2.5 (Ivison et al., 1998).
SMMJ094294659 This source is well fitted with the starburst-like M82 spectrum. No accurate redshift was previously known for this object. Using the radio-submm spectral index and the models from Carilli & Yun (2000), the estimated redshift is . The intense radio emission suggests, though, that there is a significant radio contribution from an AGN, even if we do not see AGN emission in the mid-infrared spectrum, making the value estimated from the radio-submm relation only a lower limit. Assuming this galaxy follows the relationship for powerful radio galaxies (Jarvis et al., 2001), it most likely lies at (Ledlow et al., 2002). Our spectroscopic value of confirms the high redshift of this object. The luminosity of this source (see Tab. 3) is calculated by taking into account a lensing magnification factor of 1.3 (Cowie et al., 2002).
SMMJ094314700 We pointed IRS at the mm position (Neri et al., 2003) of component H7 in the notation of Ledlow et al. (2002), but note that component H6 is included in the observing aperture as well. This source has the highest redshift of the sample (), not accounting for the non-detected objects (see discussion below). It is well fitted with a PAH spectrum plus a strong linearly rising continuum, so we infer that it is powered by both starburst activity and a powerful AGN (see Fig. 1). The optical spectrum of component H6 shows features of a weak AGN (Ledlow et al., 2002). The spectral properties, line widths and line ratios of this galaxy are very similar to those seen for narrow-line Seyfert 1 galaxies (NLSy1s; Crenshaw et al. 1991). XMM-Newton observations (Ledlow et al., 2002) suggest that the intrinsic X-ray luminosity of the AGN is modest (L, unless there is heavy obscuration. Comparison to the strong rest frame mid-IR continuum seen in the IRS spectrum suggests the latter is indeed the case: at L, this source falls more than an order of magnitude below the relation between unobscured luminosity and continuum for local AGN (Lutz et al., 2004). SMMJ094314700 hosts a heavily obscured or Compton-thick AGN, the location of which we cannot firmly ascribe to component H6 or H7. The luminosity of SMMJ094314700 (see Tab. 3) is calculated taking into account a lensing amplification factor of 1.2 (Cowie et al., 2002).
SMMJ105195723 The lowest fit for this object is the one with the M82 starburst template, which is supported by the tentative detection of a PAH feature. Still, the is not much higher for the absorbed continuum template NGC 4418. We interpret this source as powered by starburst activity, consistent with optical spectroscopy (Chapman et al., 2005), but note that an absorbed continuum interpretation cannot be firmly excluded. The spectroscopic redshift suggested for this source by Chapman et al. (2003a) was . Later, Egami et al. (2004) and Chapman et al. (2005) indicated values of and respectively. Our fits give using the starburst template and using the obscured one. Both redshifts are in agreement with the latest optical results.
SMMJ105215719 The spectrum of this source shows PAH features plus a weak continuum. The source does not contain AGN features in the optical spectrum (Chapman et al., 2005). The mid-infrared AGN continuum is detected but the feature-to-continuum ratio is much higher than in the cases of SMMJ023990136 and SMMJ094314700, thus suggesting a smaller AGN contribution. The presence of an AGN is confirmed as well from radio and X-ray emission that show the possible presence of a radio loud quasar (Ivison et al., 2002).
MMJ1541276616 The mid-infrared spectrum of this source was already published by Lutz et al. (2005a). We reprocessed the data using a later version of the IRS pipeline (14.0.0). The new reduction further increases the similarity to a starburst spectrum with well defined and PAH features and is well fitted by a M82 spectrum plus a very weak flat continuum. The is not much worse adopting the NGC4418 template which better matches the emission at long wavelengths, but the clear presence of both PAH features strongly increases confidence that this source is powered by star formation.
SMMJ163694057 This source has the lowest redshift of the sample () and is well fitted with the M82 spectrum plus a very weak flat continuum. The optical spectroscopy of Chapman et al. (2005) detects typical starburst lines, consistent with our result.
SMMJ163714053 The mid-infrared spectrum of this source shows clear and PAH features. A flat continuum is detected. The mid-infrared spectrum shows that it is powered mainly by starburst activity, even though an AGN is probably also present. AGN lines have been detected in the optical spectrum of Chapman et al. (2005).
IRS non-detections The sources for which we have neither detected features nor continua in the IRS spectra despite accurate interferometric positions are MMJ1205170743.1, MMJ1205390745.4, MMJ1205460741.5 and MMJ1541276615. Multiple arguments support the reality of these mm sources: they are well detected in the original MAMBO data (Bertoldi et al., 2000; Dannerbauer et al., 2002, 2004), are confirmed by SCUBA (Eales et al., 2003), have weak VLA counterparts (Bertoldi et al., 2000; Dannerbauer et al., 2004) and have dust continuum emission directly confirmed and located by mm interferometry (Dannerbauer et al., 2002, 2004; Dannerbauer, 2004). The faintness or non-detection of their optical/near infrared counterparts (see also Table 3) lead these authors to the conclusion that these sources must be at very high redshift and/or highly obscured.
We now consider each of these scenarios in turn. If the IRS non-detections are intrinsically similar to the detected sources but simply more distant, we can place one lower limit on their redshifts by requiring that the PAH complex or the maxima in any absorbed spectra have remained undetected because they were shifted to wavelengths longer than , where the detector sensitivity falls rapidly and the noise increases. This argument implies redshifts greater than 3.6. Similarly, since features in PAH emission spectra would already be lost in the noise at wavelengths longer than (being somewhat weaker), such sources could only be IRS non-detections for . Hence, we would conclude for all undetected sources redshifts .
If the IRS non-detections lie at redshifts similar to those of the IRS detections, their SEDs must be significantly different. We infer in Section 5.2 below that the detected sources already have a ratio of mid-infrared PAH to far-infrared emission similar to that of local ULIRGs. This implies that to escape IRS detection at the same redshifts, the non-detections would need to be even more heavily obscured in the mid-infrared than local ULIRGs. By way of example, consider Arp 220, well known for its extremely low ratio of mid- to far-infrared emission (e.g. Sanders et al., 1988; Haas et al., 2001). At , an extreme Arp 220-like SED scaled to the millimeter fluxes of the IRS non-detections would still manifest a broad PAH feature peaking at the level. No such feature is indicated in the spectra of the four non-detections (Fig. 1).
Previous assessments of the “higher redshift” and “higher obscuration” scenarios for these sources have been based on faint or undetected near-IR counterparts. For MMJ120517–0743.1, MMJ120539–0745.4, and MMJ120546–0741.5, faint -band magnitudes and the assumption of SEDs similar to those of local ULIRGs imply very high redshifts (Dannerbauer et al., 2002). Similarly, the counterpart of MMJ1541276615 implies a redshift . This particular argument is weakened by evidence that SMGs can have rest-frame UV/optical obscurations greater than those of local ULIRGs; SMMJ002661708, for example, has a very faint near-IR counterpart but (based on our data) . However, if we generalize the argument to the rest-frame mid-infrared, which is more difficult to obscure than the UV/optical, we are on stronger ground. Tellingly, our IRS non-detections are at least times fainter in the rest-frame mid-infrared than even SMMJ002661708. This result is confirmed by the mid-infrared imaging of Charmandaris et al. (2004), who place all four sources (three not detected and one tentatively detected) at the low end of the mid-IR to submm flux ratio distribution.
A further reason to prefer the “higher redshift” scenario for the IRS non-detections is that the radio counterparts to all four are faint, despite their bright mm fluxes (Bertoldi et al., 2000; Dannerbauer et al., 2004). The mean of their ratio of and flux densities () is about twice that of the Chapman et al. (2005) sample (), and still higher than both the value of , obtained for the same sample after exclusion of potentially radio-loud () SMGs, and the value of , derived from a 15 sources subsample matching the mean SCUBA flux of our four non-detections. This trend is consistent with higher redshifts (Carilli & Yun, 2000), although the scatter about the radio/submm vs. relation is large. Taken together, the various lines of evidence suggest that the four IRS non-detections do lie at high redshift, although with all arguments still based on SED assumptions. Direct spectroscopic redshifts will be needed for a definitive conclusion.
5 Discussion
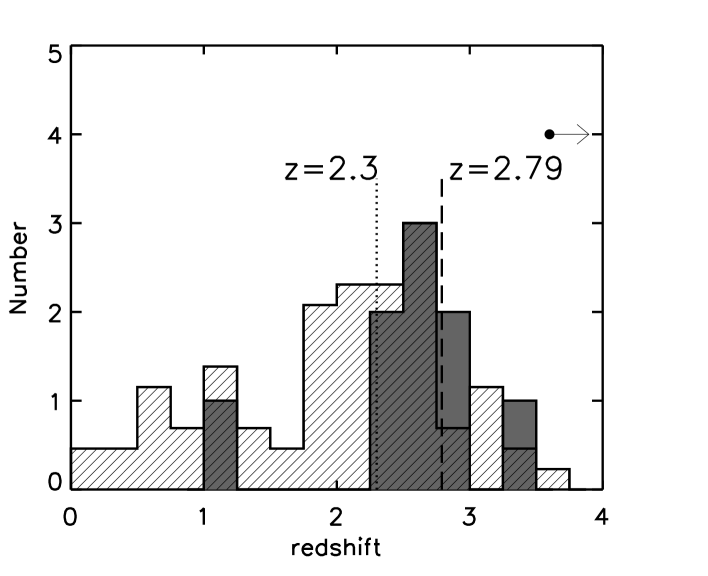
5.1 The redshift distribution has a median of
Figure 2 shows the redshift distribution for our sample. Taking into account the lower limits adopted for the undetected sources, we derive a median redshift of for the full sample of 13 SMGs. The median redshift of the 9 detected sources is . These values are noticeably higher than the median measured by Chapman et al. (2005) for their sample of 73 submillimeter galaxies with optical redshifts, and also higher than their estimate of for the extrapolation to the full SMG population. None of our new IRS redshifts is in the optical “redshift gap” () of the optical spectroscopic census of the submillimeter galaxy population (Chapman et al., 2005), where some new IRS redshifts might have been expected. It is natural to assume that the optical redshifts are still biased towards the optically bright and low redshift part of the population (Dannerbauer et al., 2004). The recent discovery of a submillimeter galaxy at redshift (Knudsen et al., 2006) similarly indicates an extension of the SMG redshift distribution beyond the one established by Chapman et al. (2005). In contrast, Pope et al. (2006) suggest from a combination of spectroscopic and photometric redshifts a median redshift of 2.0 for those SMGs in the HDF-North region that they consider securely identified through radio or Spitzer counterparts.
Our results suggest a modest extension of the Chapman et al. (2005) redshift distribution towards a larger high redshift tail, but the number statistics of our and other current SMG samples with redshifts is small. To investigate the significance of this difference, we have run simple Monte-Carlo simulations to estimate the probability of obtaining by chance a median redshift for a 13 objects sample drawn randomly from a Chapman et al. (2005) redshift distribution. Using the distributions plotted in Fig. 4 of Chapman et al. (2005), this probability is a low 0.3% drawing 13-objects samples from their optical SMG redshift distribution with overall median 2.2, and a still interesting 8% for drawing from their suggested extrapolation to the overall SMG redshift distribution with median 2.3. The latter comparison is conservative in ignoring the fact that our sample with mostly radio-interferometric identifications is still biased against the very highest redshift objects.
In addition to these simple statistical comparisons, and perhaps more important, there can be effects of field-to-field variations including spikes in the redshift distribution for the current small area SMG surveys (Blain et al., 2004). A potential redshift spike in the NDF region observed with MAMBO by Dannerbauer et al. (2004) from which three of our IRS non-detections are drawn, for example, could emphasize the high z component in our small sample. Likewise, the results of Pope et al. (2006) could have been driven in the opposite direction by being drawn from a single field. These constraints clearly call for further analyses using larger samples from large and widely separated fields.
5.2 SMGs have ULIRG-like SEDs and are largely starburst-powered
The rest frame mid-infrared spectra of SMGs and their comparison to the far-infrared part of the SEDs hold interesting clues about their physical properties, energy sources and radiation fields. The average spectrum of the nine detected SMGs, individually scaled to the same rest wavelength flux to give all sources equal weight (see Fig. 3), clearly shows the PAH features at 6.2 and but relatively weak continuum. The rest wavelength of was chosen for this scaling because it is well constrained by observations, since it is the rest frame wavelength for the SCUBA flux at redshift , about the median redshift of the sample. Scaling by the rest frame far-infrared emission is close to scaling by bolometric flux, which is appropriate for interpreting the mid-infrared diagnostics in Fig. 3 in terms of energy sources of a typical SMG without biasing towards star formation (PAH) or AGN (continuum). For galaxies at different redshifts, the rest frame continuum emission was extrapolated from the SCUBA flux. For this step as well as in quantifying the bulk properties of our targets, we assign luminosities and temperatures following the approach of Chapman et al. (2005) who use the local FIR/radio relation (Helou et al., 1985) to assign FIR SEDs to sources with known redshift, radio, and submm fluxes. The adopted far-infrared SED model is a grey body with with and . We calculated for our galaxies using two photometric points ( and ) and the relation found by Chapman et al. (2005)
| (1) |
with a proportionality constant of 6.29 (see Tab. 3). Infrared luminosities are calculated as the integral between 8 and of the SED, assuming a CDM cosmology with , and (see Tab. 3). Like other SMGs, our sample objects are inferred to be very luminous objects ().
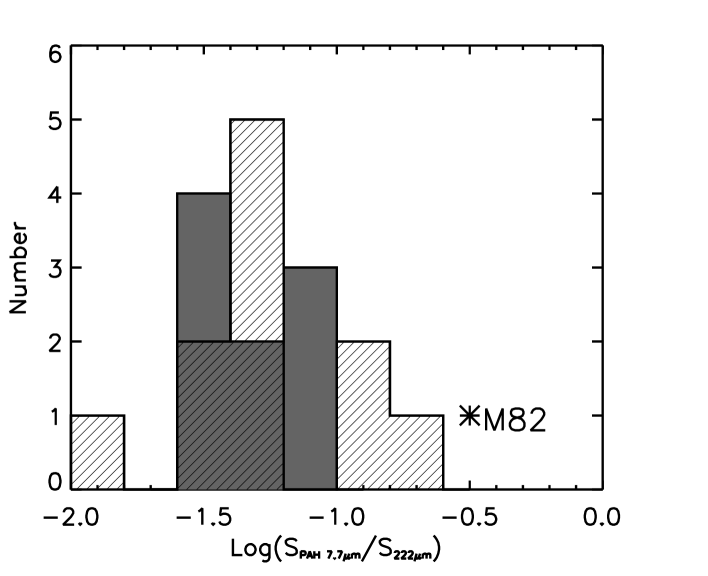
The spectrum of Fig. 3 provides a first and direct indication that our sources are, on average, starburst-like (see also Menéndez-Delmestre et al., 2007, for a similar conclusion for several lower redshift SMGs). It can be seen as a superposition of a M82-type PAH spectrum and a weak additional continuum. Comparison with the spectra of the mostly starburst-dominated local ULIRG population (see e.g. Fig. 1 in Lutz et al. 1998) suggests that SMGs are scaled up versions of these objects. A further proof of this comes from a comparison of the ratio of PAH features and continua. Figure 4 shows the ratio of peak flux density of the PAH feature, after continuum subtraction, to the continuum flux density at rest frame for all the detected sources of our sample and for 11 local ULIRGs with PAH emission and good FIR photometry. The ULIRG data have been taken from ISOPHOT-S observations (Rigopoulou et al., 1999) and the continua from slight extrapolations of the far-infrared photometry of Klaas et al. (2001), which extends to an observed wavelength of . The PAH-to-far-infrared ratios of our sources are fully consistent with those of the local ULIRG population. These SED properties are in agreement with the conclusion, from spatially resolved mm interferometry, that SMGs are similar to local ULIRGs suitably scaled for their larger masses, luminosities and star formation rates, as well as their greater gas fractions (Tacconi et al., 2006).
Given this similarity of SMGs and local ULIRGs in the comparison between PAH and far-infrared parts of the SED, it is instructive to also compare the dust temperatures for SMGs with those of local galaxies. Chapman et al. (2005) infer K for SMGs which can be compared to local galaxies in two ways: (1) SMGs have colder dust temperatures than local ULIRGs of the same luminosity (that means colder dust than so-called HyLIRGs). For local HyLIRGs, Chapman et al. (2003b) find K at . This could be due to their difference in energy sources: local HyLIRGs seem predominantly AGN driven (e.g. Tran et al., 2001), while many SMGs of the same luminosity are starbursts. (2) SMGs have similar dust temperatures to the bulk of the local ULIRG population which has luminosities just above . For local ULIRGs, Chapman et al. (2003a) infer K. This comparison is in line with other indications that SMGs are “scaled up” versions of such ULIRGs rather than direct analogs of local HyLIRGs.
From the rest frame mid-infrared spectra it is possible to evaluate the presence and the strength of a possible AGN contribution to the very large IR luminosity of the SMGs of our sample. Many SMGs show evidence of an AGN, from X-ray observations (Alexander et al., 2003, 2005a, 2005b) or optical/near-infrared spectra (e.g. Ivison et al., 1998; Swinbank et al., 2004; Chapman et al., 2005). However, the most important question is not whether there are detectable AGN signatures, but whether or not the AGN is a significant contributor to the luminosity of the galaxies. From our spectral decompositions, we can use the ratio of PAH peak and local continuum as an indicator of the AGN and star formation contribution to the bolometric luminosity. Following studies of local infrared galaxies (Genzel et al., 1998; Laurent et al., 2000; Tran et al., 2001), we adopt a feature to continuum ratio of 1 as the border between predominantly star formation and predominantly AGN powered222Our decomposition by template fit differs from the one used by Genzel et al. (1998), which interpolates between two points in the observed spectrum to define the continuum, in approaching very high feature to continuum values in the limit of almost pure star formation. The two methods give very similar results in the presence of significant AGN continuum. The fitted fluxes for the PAH peak and local continuum are listed in Table 3.
In our sample, there is no trace of an AGN continuum in the adopted fits
to the rest frame mid-infrared spectrum for two sources (SMMJ094294659
and SMMJ105195723).
Seven sources (SMMJ002661708, SMMJ023990136, SMMJ094314700,
SMMJ105215719,
MMJ1541276616, SMMJ163694057, SMMJ163714053)
are well fitted by a superposition of an AGN continuum and PAH features.
We note again that the alternative fit by an obscured (AGN?) continuum cannot
be firmly excluded for one of these (SMMJ002661708). Assuming that a feature to continuum ratio of 1 means similar bolometric contribution from
star formation and accretion, we conclude that, of these nine targets, two are pure starbursts with at best very weak AGN, five have AGN with modest contributions
of the order 20%, and two (SMMJ023990136, SMMJ094314700) have strong AGN
contributing slightly above half of the bolometric luminosity.
We cannot constrain the starburst or AGN nature of the four undetected
sources that are likely at high redshift, apart from stating that their
non-detection means absence of a strong unobscured hot AGN continuum
even for redshifts somewhat above 3.6. Our sample is small, so
it seems reasonable to expect that the full submillimeter population will
show an even wider range of AGN properties perhaps including less obscured, energetically dominant AGNs. Egami et al. (2004) and Ivison et al. (2004) have used mid-IR
photometry as a diagnostic tool to put limits on the AGN contribution
to the IR luminosity and agree that fewer than of the SCUBA/MAMBO
sources observed are AGN powered. From X-ray observations,
Alexander et al. (2005b) found that, on average, the AGN contribution in a
large sample of radio-detected SMGs was likely to be modest
(). This result assumes that SMGs do not have a substantially
larger dust-covering factor than optically selected quasars, and that there
is no significant number of fully Compton-thick AGNs that are hard to
detect in X-rays. Our finding of starbursts being prevalent in the
mid-infrared spectra extends this result by showing that SMGs
typically do not contain such dominant X-ray obscured AGNs with strong
mid-infrared continuum re-emission. Obscured AGNs with strong
mid-infrared continuum are found in Spitzer mid-infrared
surveys (e.g. Martínez-Sansigre et al., 2005), but show only little overlap with the
SMG population (Lutz et al., 2005b). In general it seems that the AGN contribution
to the IR luminosity of most SMGs is small when compared to heating from
star-formation activity.
While the IRS spectra argue against dominant AGN being typical for SMGs, they can still help to constrain the obscuration of the lesser AGN found, independent of whether sufficient photons are available for a detailed X-ray spectral analysis (Alexander et al., 2005b). From comparison to X-ray data, we have argued in the discussion of the individual sources for high X-ray obscuration of the two strongest AGN in our sample. For , a rest frame continuum of for the weaker AGN, and the relation of rest frame flux and AGN continuum from Lutz et al. (2004), a rest frame emission of is expected for an unobscured AGN following this relation. This is in the sensitivity regime of current X-ray data in the corresponding observed frame band, and can constrain the obscuration of such “minor” AGN with the caveat that large samples are needed given the variations in intrinsic AGN SEDs and the corresponding significant scatter of the mid-IR/X-ray relation. We have used Chandra archival X-ray data to put limits on the observed frame emission of SMMJ002661708 () and MMJ1541276616 (). From XMM-Newton observations of SMMJ105215719 in the same soft band, a value of is derived (Brunner et al., in prep.). These limits and fluxes imply that the rest frame emission is lower than the extrapolation from the mid-infrared continuum to unobscured X-rays. Noticeable X-ray obscuration may thus be found in many of the minor AGN in SMGs, in agreement with Alexander et al. (2005b).
Metallicity and dust-to-gas ratios in many high redshift galaxies are expected to be lower than at low redshift. Low metallicity systems show weaker mid-infrared PAH emission bands (e.g. Engelbracht et al., 2005). In addition to differences in radiation fields, this is probably due to the fact that these galaxies are young and thus may lack the carbon-rich AGB stars required to form the PAH molecules. However, the enrichment will proceed once intense star formation activity is underway for a sufficient time, or if there has been preceding star formation. This seems to be the case for SMGs. They show very clear PAH features as tracers of their intense starbursts. We can therefore assume that high metallicity is typical for the population of massive SMGs, consistent with the supersolar metallicity derived from nebular emission for SMM14011 (Tecza et al., 2004) and the roughly solar abundances in the SMG sample of Swinbank et al. (2004). In fact, because of the intense star formation, the metallicity of these systems should rapidly approach that of their likely present-day descendants: luminous elliptical galaxies (Swinbank et al., 2004). These observations and the scenario that SMGs evolve to ellipticals are in full agreement with the fossil record that the formation of the stars of local ellipticals must have happened rapidly and at high redshift (Thomas et al., 2005).
6 Conclusions
We have presented Spitzer mid-infrared spectra of a sample of 13 submillimeter galaxies. For nine of them, we have unambiguous detections of PAH spectral features and/or mid-infrared continua that allow us to constrain energy sources in these objects and to determine, in three cases for the first time, their redshifts.
The IRS detections alone have a median . If the four IRS non-detections lie at similar redshifts, their rest frame mid-infrared obscurations would have to be even more extreme than those of local ULIRGs. More plausibly, the four IRS non-detections lie at higher redshifts (), giving a median for the full set of 13. Although our sample is small, this result may indicate an extension to higher redshift of the SMG redshift distribution relative to radio-preselected samples with optical redshifts.
In the majority of cases, the detection of PAH emission and the weakness of AGN continua indicate that these galaxies are mainly starburst-powered. This result agrees with previous X-ray, optical and SED studies that indicate only a small AGN contribution to the IR luminosity compared to heating from star-formation activity. Our work extends these studies by also constraining the role of highly obscured AGN.
The SED properties of our galaxies are in agreement with the SMGs being scaled-up versions of the compact star-forming regions in local ULIRGs.
The existence of star formation dominated systems at infrared luminosities in excess of is unique to the high redshift universe. The presence of high luminosity starbursts in SMGs may be related to their higher gas fractions (Greve et al., 2005; Tacconi et al., 2006).
Mid-infrared spectroscopy with IRS, together with ancillary observations from the optical through radio wavelengths, can play a central role in understanding the nature of submillimeter galaxies and can be a powerful tool for probing the earliest and most dramatic stage of the evolution of galaxies.
This work is based on observations made with the Spitzer Space Telescope, which is operated by the Jet Propulsion Laboratory, California Institute of Technology, under a contract with NASA. We thank the referee for thorough and helpful comments. The authors want to thank M.Brusa and V.Mainieri for help with X-ray data. E.V. would like to thank the following people for helpful discussions and support during the work: M.Righi, F.Braglia, L.Conversi.
References
- Alexander et al. (2003) Alexander, D.M., et al. 2003, AJ, 125, 383
- Alexander et al. (2005a) Alexander, D.M., Smail, I., Bauer, F.E., Chapman, S.C., Blain, A.W., Brandt, W.N., Ivison, R.J. 2005, Nature, 434, 738
- Alexander et al. (2005b) Alexander, D.M., Bauer, F.E., Chapman, S.C., Smail, I., Blain, A.W., Brandt, W.N., Ivison, R.J. 2005, ApJ, 632, 736
- Aretxaga et al. (2003) Aretxaga, I., Hughes, D.H., Chapin, E.L., Gaztañaga, E., Dunlop, J.S., Ivison, R.J. 2003, MNRAS, 342, 759
- Barger et al. (1998) Barger, A.J., Cowie, L.L., Sanders, D.B., Fulton, E., Taniguchi, Y., Sato, Y., Kawara, K., Okuda, H. 1998, Nature, 394, 248
- Barger et al. (1999) Barger, A.J., Cowie, L.L., Smail, I.R., Ivison, R.J., Blain, A.W., Kneib, J.-P. 1999, AJ, 117, 2656
- Baugh et al. (2003) Baugh, C.M., Benson, A.J., Cole, S., Frenk, C.S., Lacey, C.G. 2003, astro-ph/0203051
- Baugh et al. (2005) Baugh, C.M., Lacey, C.G, Frenk, C.S., Granato, G.L., Silva, L., Bressan, A., Benson, A.J., Cole, S. 2005, MNRAS, 356, 1191
- Bautz et al. (2000) Bautz, M.W., Malm, M.R., Baganoff, F.K., Ricker, G.R., Canizares, C.R., Brandt, W.N., Hornschemeier, A.E., Garmire, G.P. 2000, ApJ, 543, L119
- Bertoldi et al. (2000) Bertoldi, F., et al. 2000, A&A, 360, 92
- Blain et al. (2002) Blain, A.W., Smail, I., Ivison, R.J., Kneib, J.-P., Frayer, D.T., 2002, PhR, 369, 111
- Blain et al. (2004) Blain, A.W., Chapman, S.C., Smail, I., Ivison, R. 2004, ApJ, 611, 725
- Borys et al. (2005) Borys, C., Smail, I., Chapman, S.C., Blain, A.W., Alexander, D.M., Ivison, R.J. 2005, ApJ, 635, 853
- Bower et al. (2006) Bower, R.G., Benson, A.J., Malbon, R., Helly, J.C., Frenk, C.S., Baugh, C.M., Cole, S., Lacey, C.G. 2006, MNRAS, 370, 645
- Boulanger et al. (1998) Boulanger, F., Boisssel, P., Cesarsky, D., Ryter, C. 1998, A&A, 339, 194
- Carilli & Yun (2000) Carilli, C.L., Yun, M.S. 2000, ApJ, 530, 618
- Chapman et al. (2003a) Chapman, S.C., Blain, A.W., Ivison, R.J., Smail, I.R. 2003, Nature, 422, 695
- Chapman et al. (2003b) Chapman, S.C., Helou, G., Lewis, G.F., Dale, D.A. 2003, ApJ, 588, 186
- Chapman et al. (2005) Chapman, S.C., Blain, A.W., Smail, I., Ivison, R.J. 2005, ApJ, 622, 772
- Charmandaris et al. (2004) Charmandaris V., et al. 2004, ApJS, 154, 142
- Cimatti et al. (2004) Cimatti A., et al. 2004, Nature, 430, 184
- Colbert et al. (1999) Colbert, J.W., et al. 1999, ApJ, 511, 721
- Cowie et al. (2002) Cowie, L.L., Barger, A., Kneib, J.-P. 2002, AJ, 123, 2197
- Crenshaw et al. (1991) Crenshaw D.M., Peterson, B.M., Korista, K.T., Wagner, R.M., Aufdenberg, J.P. 1991, AJ, 101, 1202
- Dale & Helou (2002) Dale, D., Helou, G. 2002, ApJ, 576, 159
- Dale et al. (2006) Dale, D., et al. 2006, ApJ, 646, 161
- Dannerbauer et al. (2002) Dannerbauer, H., Lehnert, M.D., Lutz, D., Tacconi, L., Bertoldi, F., Carilli, C., Genzel, R., Menten, K. 2002, ApJ, 573, 473
- Dannerbauer et al. (2004) Dannerbauer, H., Lehnert, M.D., Lutz, D., Tacconi, L., Bertoldi, F., Carilli, C., Genzel, R., Menten, K. 2004, ApJ, 606, 664
- Dannerbauer (2004) Dannerbauer, H. 2004, PhD Thesis, Ludwig-Maximilians-Universität München
- Desai et al. (2006) Desai, V., et al. 2006, ApJ, 641, 133
- Downes et al. (1999) Downes, D., et al. 1999, A&A, 347, 809
- Draine (2003) Draine, B.T. 2003, ARA&A, 41, 241
- Dunlop et al. (2004) Dunlop, J.S., et al. 2004, MNRAS, 350, 769
- Eales et al. (2003) Eales, S., Bertoldi, F., Ivison, R., Carilli, C., Dunne, L., Owen, F. 2003, MNRAS, 344, 169
- Egami et al. (2004) Egami, E., et al. 2004, ApJS, 154, 130
- Engelbracht et al. (2005) Engelbracht, C.W., Gordon, K.D., Rieke, G.H., Werner M.W.,Dale, D.A., Latter, W.B. 2005, ApJ, 628, L29
- Farrah et al. (2003) Farrah, D., Afonso, J., Efstathiou, A., Rowan-Robinson, M., Fox, M., Clements, D. 2003, MNRAS, 343, 585
- Ferrarese & Merritt (2000) Ferrarese, L., Merritt, D. 2000, ApJ, 549, 215
- Förster Schreiber et al. (2003) Förster Schreiber, N., Sauvage, M., Charmandaris, V., Laurent, O., Gallais, P., Mirabel, I.F., Vigroux, L. 2003, A&A, 399, 833
- Frayer et al. (1998) Frayer, D.T., Ivison, R.J., Scoville, N.Z., Yun, M., Evans, A.S., Smail, I., Blain, A.W., Kneib, J.-P. 1998, ApJ, 506, L7
- Frayer et al. (1999) Frayer, D.T., et al. 1999, ApJ, 514, L13
- Frayer et al. (2000) Frayer, D.T., Smail, I., Ivison, R.J., Scoville, N.Z. 2000, AJ, 120, 1668
- Fukugita, Hogan & Peebles (1998) Fukugita, M., Hogan, C.J., Peebles, P.J.E. 1998, ApJ, 503, 518
- Gebhardt et al. (2000) Gebhardt, K., et al. 2000, ApJ, 539, L13
- Genzel et al. (1998) Genzel, R., et al. 1998, ApJ, 498, 579
- Genzel & Cesarsky (2000) Genzel, R., Cesarsky, C. 2000, ARA&A, 38, 761
- Genzel et al. (2003) Genzel, R., Baker, A.J., Tacconi, L.J., Lutz, D., Cox, P., Guilloteau, S., Omont, A. 2003, ApJ, 584, 633
- Greve et al. (2005) Greve, T.R., et al. 2005, MNRAS, 359, 1165
- Haas et al. (2001) Haas, M., Klaas, U., Müller, S.A.H., Chini, R., Coulson, I. 2001, A&A, 367, L9
- Hao et al. (2005) Hao, L., et al. 2005, ApJ, 625, L75
- Helou et al. (1985) Helou, G., Soifer, T., Rowan-Robinson, M., 1985, ApJ, 298, L7 PASP, 116, 975
- Holland et al. (1999) Holland, W., et al. 1999, MNRAS, 303, 659
- Houck et al. (2004) Houck, J.R., et al. 2004, ApJS, 154, 18
- Houck et al. (2005) Houck, J.R., et al. 2005, ApJ, 622, L105
- Hughes et al. (1998) Hughes, D.H., et al. 1998, Nature, 394, 241
- Ivison et al. (1998) Ivison, R.J., Smail, I., Le Borgne, J.-F., Blain, A.W., Kneib, J.-P., Bézecourt, J., Kerr, T.H., Davies, J.K. 1998, MNRAS, 298, 583
- Ivison et al. (2002) Ivison, R.J., et al. 2002, MNRAS, 337, 1
- Ivison et al. (2004) Ivison, R.J., et al. 2004, ApJS, 154, 124
- Jarvis et al. (2001) Jarvis, M. J., Rawlings, S., Eales, S., Blundell, K.M., Bunker, A. J., Croft, S., McLure, R.J., Willott, C.J. 2001, MNRAS, 326, 1585
- Kauffmann et al. (1999) Kauffmann, G., Colberg, J.M., Diaferio, A., White, S.D.M. 1999, MNRAS, 303, 188
- Klaas et al. (2001) Klaas, U., et al. 2001, A&A, 379, 823
- Knudsen et al. (2006) Knudsen, K.K., Kneib, J.P., Egami, E. 2006, astro-ph/0604073
- Kovács et al. (2006) Kovács, A., Chapman, S.C., Dowell, C.D., Blain, A.W., Ivison, R.J., Smail, I., Phillips, T.G. 2006, ApJ, 650, 592
- Krabbe et al. (2001) Krabbe, A., Boeker, T., Maiolino, R. 2001, ApJ, 557, 626
- Kreysa et al. (1998) Kreysa, E., et al. 1998, SPIE, 3357, 319
- Laurent et al. (2000) Laurent, O., Mirabel, I.F., Charmandaris, V., Gallais, P., Madden, S.C., Sauvage, M., Vigroux, L., Cesarsky, C. 2000, A&A, 359, 887
- Ledlow et al. (2002) Ledlow, M.J., Smail, I., Owen, F.N., Keel, W.C., Ivison, R.J., Morrison, G.E. 2002, ApJ, 577, L79
- Lutz et al. (1998) Lutz, D., Spoon, H.W.W, Rigopoulou, D., Moorwood, A.F.M., Genzel, R. 1998, ApJ, 505, L103
- Lutz et al. (2004) Lutz, D., Maiolino, R., Spoon, H.W.W., Moorwood, A.F.M. 2004, A&A, 418, 465
- Lutz et al. (2005a) Lutz, D., Valiante, E., Sturm, E., Genzel, R., Tacconi, L.J., Lehnert, M.D., Sternberg, A., Baker, A.J. 2005, ApJ, 625, L83
- Lutz et al. (2005b) Lutz, D., Yan, L., Armus, L., Helou, G., Tacconi, L.J., Genzel, R., Baker, A.J. 2005, ApJ, 632, L13
- Martínez-Sansigre et al. (2005) Martínez-Sansigre, A., Rawlings, S., Lacy, M., Fadda, D., Marleau, F.R., Simpson, C., Willott, C.J., Jarvis, M.J. 2005, Nature, 436, 666
- Menéndez-Delmestre et al. (2007) Menéndez-Delmestre, K., et al. 2007, ApJL, in press (astro-ph/0610915)
- Neri et al. (2003) Neri, R., et al. 2003, ApJ, 597, L113
- Persic & Salucci (1992) Persic, M., Salucci, P. 1992, MNRAS, 258, 14
- Pope et al. (2006) Pope, A., et al. 2006, MNRAS, 370, 1185
- Rigopoulou et al. (1999) Rigopoulou, D., Spoon, H.W.W., Genzel, R., Lutz, D., Moorwood, A.F.M., Tran, Q.D. 1999, AJ, 118, 2625
- Sanders et al. (1988) Sanders, D.B., Soifer, B.T., Elias, J.H., Madore, B.F., Matthews, K., Neugebauer, G., Scoville, N.Z. 1988, ApJ, 325, 74
- Schweitzer et al. (2006) Schweitzer, M., et al. 2006, ApJ, 649, 79
- Siebenmorgen et al. (2005) Siebenmorgen, R., Haas, M., Krügel, E., Schulz, B. 2005, A&A, 436, L5
- Smail et al. (1997) Smail, I., Ivison, R.J., Blain, A.W. 1997, ApJ, 490, L5
- Smail et al. (2000) Smail, I., Ivison, R.J., Owen, F.N., Blain, A.W., Kneib, J.-P. 2000, ApJ, 528, 612
- Smail et al. (2002) Smail, I., Ivison, R.J., Blain, A.W., Kneib, J.-P. 2002, MNRAS, 331, 495
- Smail et al. (2004) Smail, I., Chapman, S.C., Blain, A.W., Ivison, R.J. 2004, AJ, 616, 71
- Smith et al. (2006) Smith, J.D.T, et al. 2006, ApJ, in press (astro-ph/0610913)
- Spoon et al. (2001) Spoon, H.W.W., Keane, J.V., Tielens, A.G.G.M., Lutz,D., Moorwood, A.F.M. 2001, A&A, 365, L353
- Spoon et al. (2004) Spoon, H.W.W., et al. 2004, ApJS, 154, 184
- Sturm et al. (2000) Sturm, E., Lutz, D., Tran, D., Feuchtgruber, H., Genzel, R., Kunze, D., Moorwood, A.F.M., Thornley, M.D. 2000, A&A, 358, 481
- Sturm et al. (2005) Sturm, E., et al. 2005, ApJ, 629, L21
- Swinbank et al. (2004) Swinbank, A.M., Smail, I., Chapman, S.C., Blain, A.W., Ivison, R.J., Keel, W.C. 2004, ApJ, 617, 64
- Tacconi et al. (2006) Tacconi, L.J., et al. 2006, ApJ, 640, 228
- Tecza et al. (2004) Tecza, M., et al. 2004, ApJ, 605, L109
- Teplitz et al. (2005) Teplitz, H.I., et al. 2005, AAS, 207, #52.08
- Thomas et al. (2005) Thomas, D., Maraston, C., Bender, R., Mendes de Oliveria, C. 2005, ApJ, 621, 673
- Tran et al. (2001) Tran, Q.D., et al. 2001, ApJ, 552, 527
- Tremaine et al. (2002) Tremaine, S. et al. 2002, ApJ, 574, 740
- Veilleux et al. (1999) Veilleux, S., Kim, D.-C., Sanders, D.B. 1999, ApJ, 522, 113
- Voss et al. (2006) Voss, H., Bertoldi, F., Carilli, C., Owen, F., Lutz, D., Holdaway, M., Ledlow, M., Menten, K. 2006, A&A, 448, 823
- Weedman et al. (2006) Weedman. D.W., Le Floc’h, E., Higdon, S.J.U., Higdon, J.L., Houck, J.R. 2006, ApJ, 638, 613
- Yan et al. (2005) Yan, L., et al. 2005, ApJ, 628, 604
| Name | RA | DEC | Error | Ref. | SL1 | LL2 | LL1 |
|---|---|---|---|---|---|---|---|
| J2000 | J2000 | ″ | () | () | () | ||
| sn.of cycles | sn.of cycles | sn.of cycles | |||||
| SMMJ002661708 (M12) | 00:26:34.10 | 17:08:33.7 | 0.8 | F00 | |||
| SMMJ02399–0136 (L1/L2) | 02:39:51.87 | 01:35:58.8 | 0.6 | G03 | |||
| SMMJ094294659 (H8) | 09:42:53.42 | 46:59:54.5 | L02 | ||||
| SMMJ094314700 (H7/H6) | 09:43:03.69 | 47:00:15.5 | 0.3 | N03 | |||
| SMMJ105195723 (LE 850.18) | 10:51:55.47 | 57:23:12.7 | I02 | ||||
| SMMJ105215719 (LE 850.12) | 10:52:07.49 | 57:19:04.0 | I02 | ||||
| MMJ120517–0743.1 | 12:05:17.86 | 07:43:08.5 | 0.4 | D04 | |||
| MMJ120539–0745.4 | 12:05:39.47 | 07:45:27.0 | 0.4 | D04 | |||
| MMJ120546–0741.5 | 12:05:46.59 | 07:41:34.3 | 0.5 | D04 | |||
| MMJ1541276615 | 15:41:26.90 | 66:14:37.3 | 0.1 | B00 | |||
| MMJ1541276616 | 15:41:27.28 | 66:16:17.0 | 0.1 | B00 | |||
| SMMJ163694057 (N2 850.8) | 16:36:58.78 | 40:57:28.1 | I02 | ||||
| SMMJ163714053 (N2 1200.17) | 16:37:06.60 | 40:53:14.0 | G05 |
Note. — Names in brackets indicate aliases used in the literature.
References. — Interferometric positions adopted for the IRS observations (from VLA if not stated otherwise): B00: Bertoldi et al. (2000). D04: PdBI mm position of Dannerbauer et al. (2004). F00: OVRO mm position of Frayer et al. (2000). G03: PdBI mm position of Genzel et al. (2003). G05: 1″ from final CO position of Greve et al. (2005). I02: Ivison et al. (2002). L02: Ledlow et al. (2002). N03: PdBI mm position of Neri et al. (2003). For sources with no position error stated in the references, we assume from the interferometer configurations used.
| Name | M82 | IRAS F001837111 | NGC 4418 | M82 continuum | ||||||||||||
|---|---|---|---|---|---|---|---|---|---|---|---|---|---|---|---|---|
| SMMJ002661708 | 1.5 | 2.73 | 0.01 | 3.1 | 2.75 | 0.02 | 2.0 | 2.66 | 0.01 | 1.4 | 2.73 | 0.02 | ||||
| SMMJ023990136 | 17 | 2.80 | 0.01 | 12 | 2.86 | 0.01 | 21 | 2.72 | 0.01 | 1.1 | 2.81 | 0.02 | ||||
| SMMJ094294659 | 0.58 | 2.38 | 0.01 | 1.5 | 2.43 | 0.03 | 0.86 | 2.33 | 0.01 | 0.59 | 2.38 | 0.02 | ||||
| SMMJ094314700 | 10 | 3.33 | 0.01 | 3.2 | 3.26 | 0.04 | 4.3 | 3.20 | 0.01 | 0.99 | 3.36 | 0.02 | ||||
| SMMJ105195723 | 0.68 | 2.67 | 0.01 | 1.2 | 2.67 | 0.01 | 0.80 | 2.64 | 0.02 | 0.75 | 2.67 | 0.02 | ||||
| SMMJ105215719 | 0.74 | 2.69 | 0.01 | 1.3 | 2.75 | 0.02 | 1.1 | 2.73 | 0.01 | 0.63 | 2.69 | 0.02 | ||||
| MMJ1541276616 | 0.55 | 2.78 | 0.01 | 0.82 | 2.79 | 0.04 | 0.60 | 2.67 | 0.02 | 0.35 | 2.79 | 0.02 | ||||
| SMMJ163694057 | 0.60 | 1.21 | 0.01 | 1.68 | 1.17 | 0.01 | 0.66 | 1.12 | 0.01 | 0.30 | 1.21 | 0.02 | ||||
| SMMJ163714053 | 1.1 | 2.38 | 0.01 | 1.2 | 2.48 | 0.01 | 1.3 | 2.34 | 0.01 | 0.41 | 2.38 | 0.02 | ||||
| Name | S | S | Opt. | Magn.aafootnotemark: | bbfootnotemark: | ccfootnotemark: | Sddfootnotemark: | Seefootnotemark: | Best fit | |||
|---|---|---|---|---|---|---|---|---|---|---|---|---|
| mJy | mag | mag | mJy | mJy | K | |||||||
| SMMJ002661708 | 18.62.4fffootnotemark: | 9415fffootnotemark: | 22.5fffootnotemark: | I26.1fffootnotemark: | 2.4 | 2.73 | 0.750 | 0.150 | 35.3 | 0.5 | M82AGN | |
| SMMJ023990136 | 23.01.9ggfootnotemark: | 52610hhfootnotemark: | 17.8ggfootnotemark: | R=21.2ggfootnotemark: | 2.5 | 2.80 | 2.81 | 1.12 | 1.44 | 53.4 | 2.5 | M82AGN |
| SMMJ094294659 | 4.91.5iifootnotemark: | 9703.5jjfootnotemark: | 19.7jjfootnotemark: | R=25.2jjfootnotemark: | 1.3 | 2.38 | 0.683 | 83.0 | 6.3 | M82 | ||
| SMMJ094314700 | 10.51.8iifootnotemark: | 553.5jjfootnotemark: | 20.2jjfootnotemark: | R=23.8jjfootnotemark: | 1.2 | 3.35 | 3.36 | 0.607 | 1.04 | 41.6 | 0.9 | M82AGN |
| SMMJ105195723 | 4.51.3kkfootnotemark: | 4710kkfootnotemark: | 20.4kkfootnotemark: | I=24.6kkfootnotemark: | 2.69 | 2.67 | 0.491 | 42.0 | 0.5 | M82 | ||
| SMMJ105215719 | 6.21.6kkfootnotemark: | 27812kkfootnotemark: | 20.6kkfootnotemark: | I=22.7kkfootnotemark: | 2.69 | 2.69 | 0.370 | 0.122 | 61.6 | 2.9 | M82AGN | |
| MMJ1205170743.1 | 6.30.9llfootnotemark: | 4013mmfootnotemark: | 22.5mmfootnotemark: | R25.4mmfootnotemark: | 3.6 | |||||||
| MMJ1205390745.4 | 6.31.4llfootnotemark: | 5513mmfootnotemark: | 22.7mmfootnotemark: | R26.2mmfootnotemark: | 3.6 | |||||||
| MMJ1205460741.5 | 18.52.4llfootnotemark: | 4213mmfootnotemark: | 21.9mmfootnotemark: | R26.2mmfootnotemark: | 3.6 | |||||||
| MMJ1541276615 | 10.71.2llfootnotemark: | 8113nnfootnotemark: | 21.2ppfootnotemark: | R24.9ppfootnotemark: | 3.6 | |||||||
| MMJ1541276616 | 14.61.8llfootnotemark: | 6713nnfootnotemark: | 20.5nnfootnotemark: | R24.5nnfootnotemark: | 2.79 | 0.472 | 0.159 | 35.0 | 0.9 | M82 AGN | ||
| SMMJ163694057 | 5.11.4kkfootnotemark: | 7429kkfootnotemark: | 18.2kkfootnotemark: | R=22.5kkfootnotemark: | 1.19 | 1.21 | 0.493 | 0.205 | 27.5 | 0.1 | M82AGN | |
| SMMJ163714053 | 11.2oofootnotemark: | 7423oofootnotemark: | 19.2qqfootnotemark: | I=23.2qqfootnotemark: | 2.38 | 2.38 | 0.519 | 0.242 | 34.3 | 0.7 | M82AGN |
| a | Adopted lensing magnification where applicable, magnification 1 is assumed otherwise. See text for references. The submm and radio fluxes and | ||||||||||
|---|---|---|---|---|---|---|---|---|---|---|---|
| optical/near-infrared magnitudes listed here are not corrected for amplification, while the infrared luminosities include the magnification correction. | |||||||||||
| Magnitudes are on the Vega system. | |||||||||||
| b | Redshift from previous measurements. See text for references. | ||||||||||
| c | Redshift from best fit to IRS mid-infrared spectrum (this work). Uncertainty 0.06 including effects of potential template mismatch (See Sect. 4 | ||||||||||
| for details). | |||||||||||
| d | Flux of the PAH rest frame feature after continuum subtraction. | ||||||||||
| e | Flux of the continuum rest frame. | ||||||||||
| f | Frayer et al. (2000) | g | Smail et al. (2002) | h | Smail et al. (2000) | i | Cowie et al. (2002) | ||||
| j | Ledlow et al. (2002). Opt/NIR magnitudes for SMMJ094314700 are dominated by the H6 component while H7 is the dominant submm component | ||||||||||
| (Tacconi et al., 2006). | |||||||||||
| k | Ivison et al. (2002) | l | Eales et al. (2003) | m | Dannerbauer et al. (2004) | n | Bertoldi et al. (2000) | o | Chapman et al. (2005) | ||
| p | Dannerbauer (2004) | q | Smail et al. (2004) | ||||||||