Extended, regular H i structures around early-type galaxies
We discuss the morphology and kinematics of the H i of a sample of 30 southern gas-rich early-type galaxies selected from the
H i Parkes All-Sky Survey (HIPASS). This is the largest collection of
high-resolution H i data of a homogeneously selected sample. Given the
sensitivity of HIPASS, these galaxies represent the most H i-rich early-type
galaxies. In two-thirds of the galaxies, we find the H i to be in a large,
regular disk- or ring-like structure that in some cases is strongly
warped. In the remaining cases we find the H i distributed in
irregular tails or clouds offset from the galaxy. The giant, regular H i structures can be up to kpc in diameter and contain up to of H i. The incidence of irregular H i structures appears to be
somewhat higher in elliptical galaxies, but the large, regular structures are
observed in both elliptical and S0 galaxies and are not strictly connected to
the presence of a stellar disk. If these two types of galaxies are the result
of different formation paths, this is not strongly reflected in the
characteristics of the H i.
The size and the regular kinematics of the H i structures imply that the neutral hydrogen must have settled in these
galaxies several Gyr ago. Merging as well as gas accretion
from the IGM are viable explanations for the origin of the gas in these
galaxies. The average column density of the H i is low so that little star
formation is expected to occur and these early-type galaxies can remain gas
rich for very long periods of time. The large H i structures likely
represent key structures for tracing the origin and evolution of these
galaxies.
Key Words.:
galaxies: elliptical and lenticular - galaxies: ISM - galaxies: neutral hydrogen - radio lines: galaxies1 Introduction
Recent studies of nearby field elliptical and lenticular galaxies have revealed a variety of characteristics that can be considered to be signatures of the continuing assembly of this class of objects. For example, optical studies show that most early-type galaxies contain significant amounts of ionised gas and that in most cases this gas must have been accreted (e.g. Sadler & Gerhard 1985, Sarzi et al. 2006 and references therein). Other evidence for continuing accretion and merging is the common occurrence of fine structure in the optical morphology (Malin & Carter 1983, Schweizer & Seitzer 1992, Schweizer 1998). In addition, detailed stellar-population studies show that many systems do contain a (often small) subpopulation of relatively young stars that may have formed from accreted material (see e.g. Trager et al. 2000, Tadhunter et al. 2005). Taken together, the above results strongly suggest that many field early-type galaxies continue to grow and that the accretion of gas plays an important role in this.
The relevance of gas in the formation and evolution of early-type galaxies is also suggested by theoretical work that indicates that dissipative mergers and accretions are needed to explain the dynamical structure of, in particular, the more disky early-type galaxies (e.g. Naab, Kochfar & Burkert 2006). Having a good inventory of the gas properties of early-type galaxies is therefore essential for understanding the formation and evolution of these systems.
Already many years ago, it was realised that gas can be important for the evolution of early-type galaxies. Based on compilations of published (mainly single-dish) data, e.g. Knapp, Turner & Cunniffe (1985) and Roberts & Haynes (1994) showed that a significant fraction (5-10%) of E/S0 galaxies contain a considerable amount of H i. They also showed that, in contrast to spirals, the H i content of early-type galaxies is not correlated with their optical luminosity. This is often taken as evidence for the origin of the gas being external. However, the situation must be more complex because it is clear that also many spiral galaxies (including our own Galaxy and M31) are still accreting small companions and gas (van der Hulst & Sancisi 2004; Westmeier, Braun & Thilker 2005) so that the lack of correlation between the gas content and the optical luminosity in early-type galaxies must also involve other factors, such as where the accreted gas ends up in the galaxy, or the way in which the accreted gas is consumed (or not) by star formation.
In early-type galaxies that are gas rich, the H i is expected to have low column density and to be distributed over a large region because if it were not, the column densities would be high enough for large-scale star formation to occur and the galaxy would not be classified as an early-type. Hence, H i imaging studies are likely to give information on gas properties on scales larger than the optical galaxy and are therefore a useful complement to optical work that in most cases investigates the regions inside the optical boundaries of galaxies. It is at large radii where the dynamical timescales are larger and where, in particular for field galaxies, the environment is relatively quiet. Hence, the signatures of the formation history of a galaxy can survive there for longer periods of time. In this respect, observations of large-scale gas structures can be important because they may give information over long timescales.
The most commonly considered scenarios for the formation of early-type galaxies do indeed predict that such large-scale gas systems may form in some early-type galaxies for certain initial conditions. Numerical simulations of gas-rich mergers show, in particular when the angular momenta of the galaxies and of the orbit are more or less aligned, that some fraction of the gas of the progenitor galaxies is at first distributed along very extended tidal structures that at a later stage can fall back to settle into a large disk around the newly formed galaxy (e.g. Barnes 2002, Naab et al. 2006). Alternatively, galaxies can accrete gas from the IGM; simulations show that although most of this gas is heated by shocks to the virial temperature of the halo, some fraction stays below K and can accrete onto a galaxy as cold gas and may form gaseous structures (e.g., Keres et al. 2005; Macciò, Moore & Stadel 2005). If the galaxy density of environment is relatively low, the structures of accreted gas will not be destroyed by the passage of neighbouring galaxies, and both merging and cold accretion can lead to the formation of large stable and massive structures of cold gas around early-type galaxies.
Here we present an analysis of high-resolution H i data of a large, homogeneously selected sample of early-type galaxies based on the H i Parkes All Sky Survey (HIPASS, Barnes et al. 2001). HIPASS is a H i single-dish survey of the entire southern sky with an RMS noise level of 13 mJy beam-1 over 18 km s-1 and is well suited for constructing homogeneously selected samples that can be the basis for statistical studies of global properties. In Paper II (Sadler et al. 2006) we report on a statistical study focused on the global H i properties of early-type galaxies. It is, however, crucial to also investigate the morphology and kinematics of the H i gas in early-type galaxies with higher spatial resolution. Only through the study of the detailed characteristics (morphology, column density, and kinematics) one can hope to understand the origin of this gas and the role it may have played in the evolution of the galaxy, while one can also investigate the effects of confusion in the HIPASS data. Therefore, we carried out ATCA follow-up observations of the HIPASS detections and these are the subject of this paper. Despite its potential importance, such detailed information is available only for a limited and inhomogeneous sample of early-type galaxies (e.g. Schiminovich et al. 1994, 1995; van Gorkom & Schiminovich 1997; Morganti et al. 1997, Balcells et al. 2001; Oosterloo et al. 2002), and only recently systematic studies have begun to shed light on this relatively unexplored field. Morganti et al. (2006) carried out a small but deep H i survey of nearby E/S0’s in the northern hemisphere. They observed a subset of the SAURON sample of early-type galaxies (de Zeeuw et al. 2002) with the Westerbork Synthesis Radio Telescope (WSRT). These observations are much deeper than most earlier work with detection limits of about few . Most interestingly, they found that a very high fraction (70%) of these systems contains H i, with morphologies ranging from small clouds to large, regular disks of low column density H i. This detection rate is very similar to that of the ionised gas in the SAURON sample (Sarzi et al. 2006). These high detection rates underline the importance of gas in the evolution of early-type galaxies.
The paper is structured as follows: we explain the selection of the sample in Sec.2; we describe the observations in Sec.3; we show the result of the observations in Sec.4; we discuss these results and compare them to those obtained by Morganti et al. (2006) in Sec.5; finally, we summarise the main conclusions in Sec.6.
2 Background of this study and selection of the sample
The selection of the sample of gas-rich early-type galaxies was done in 2000 and predates the construction of the final HIPASS catalogue (Meyer et al. 2004). Instead, the selection was done on the HIPASS data cubes themselves. As also described by Sadler et al. (2006), we used the HIPASS data cubes to create co-added H i spectra at the position of each E and S0 galaxy that is listed in the Third Reference Catalogue of Bright Galaxies (RC3; de Vaucouleurs et al. 1991) and is south of declination . We chose the RC3 because it contains reliable galaxy Hubble-type classifications based on uniform, high-quality plate material. This minimises the risk of contaminating our E/S0 galaxy sample with spirals. The co-added HIPASS spectra were inspected by two of us (TAO and EMS). The main criteria for identifying a candidate H i detection were as follows:
-
•
An integrated H i flux of at least 2.6 Jy km s-1 in the HIPASS spectrum at the position of the RC3 galaxy.
-
•
A measured H i velocity within 200 km s-1 of the catalogued optical velocity.
The 2.6 Jy km s-1 cutoff is fairly high and will exclude some genuine weak detections, but was chosen because the spectral baselines of the HIPASS data are, in some cases, not flat due to difficulties in calibration. A lower detection limit would cause contamination by noise peaks and would make the statistics less reliable. The requirement for a match between H i and optical velocities was similarly chosen to exclude spurious H i detections. Over 90% of the RC3 galaxies in our sample had a measured optical velocity at the time the HIPASS selection was done.
The HIPASS detection rate for galaxies with systemic velocities above 6500 km s-1 was significantly lower than for the rest of the sample, while galaxies with velocities less than 500 km s-1 can be lost in Galactic or HVC H i emission. The final sample is therefore restricted to objects with km s-1.
There are 132 E and 533 S0 galaxies in the RC3 which have optical velocities in this range and the cross-correlation with HIPASS resulted in many candidate H i detections. Thirteen E and 73 S0 galaxies were marked as such. Of these galaxies, for 3 E and 9 S0 galaxies good data are available in the literature and were therefore not re-observed (see Table 4). All 10 remaining E galaxies were observed in our ATCA follow up. Of the 64 remaining S0 galaxies, we observed with ATCA only those 32 for which optical images showed that more than one galaxy is present in the Parkes beam and hence that the HIPASS data may suffer from confusion with companion galaxies. If there is some correlation between the H i properties of S0 galaxies and their environment, this selection could imply some selection effect.
The final list of 42 objects observed with ATCA, grouped in E and S0, is given in Table 1. Information about the 12 galaxies of our sample for which the H i properties were already known from the literature is given in Table 4.
3 The ATCA observations
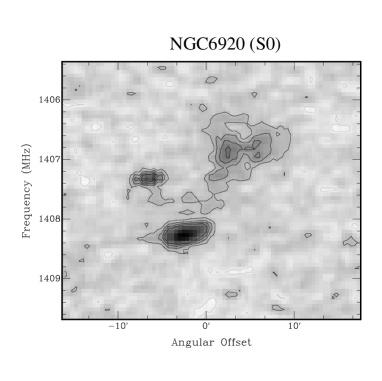
In total 42 objects were observed with ATCA between May 2001 and January 2002. All observations were performed using the 375-m array configuration and 256 channels covering a 16-MHz wide band centred on the frequency of the redshifted hydrogen line. In order to limit the total amount of observing time, several galaxies were observed within a single 12-hr observing slot. For most galaxies the data consist of several short cuts spread over 12 hrs to provide, given the relatively short integration time, a sufficient, albeit not optimal, -coverage for imaging the field. This resulted in typical integration times of 2 hours per galaxy and this is the main limitation to the quality of the images. For a small number of galaxies the scheduling allowed longer integration times and better coverage (see Table 1 for details). In a few datasets (in particular ESO 92–21 and NGC 6920) some H i emission is likely not detected because of RFI (Radio Frequency Interference) around 1408 MHz.
The calibration of the spectral data was done with the MIRIAD package (Sault et al. 1995), which has several features particularly suited for ATCA data, and was done following the standard recipes for ATCA data. The flux density scale was set by observations of PKS 1934–638, for which we adopted the standard spectrum as given in the ATCA manuals (which is, to zeroth order, a flux density of 14.9 Jy at 1400 MHz). This source was also used as bandpass calibrator. Spectral-line data sets were constructed by subtracting the continuum emission using a linear fit through the line-free channels of each visibility record and subtracting this fit from all the frequency channels (i.e. using the task UVLIN of MIRIAD). This also resulted in continuum datasets that were processed separately (see below). The final cubes were made with natural weighting. The velocity resolution of the data cubes is, after Hanning smoothing, about 26 km s-1. A summary of the integration times and noise levels is given in Table 1. The typical FWHM of the restoring beam is arcsec2 and the typical noise level is 2–3 mJy beam-1.
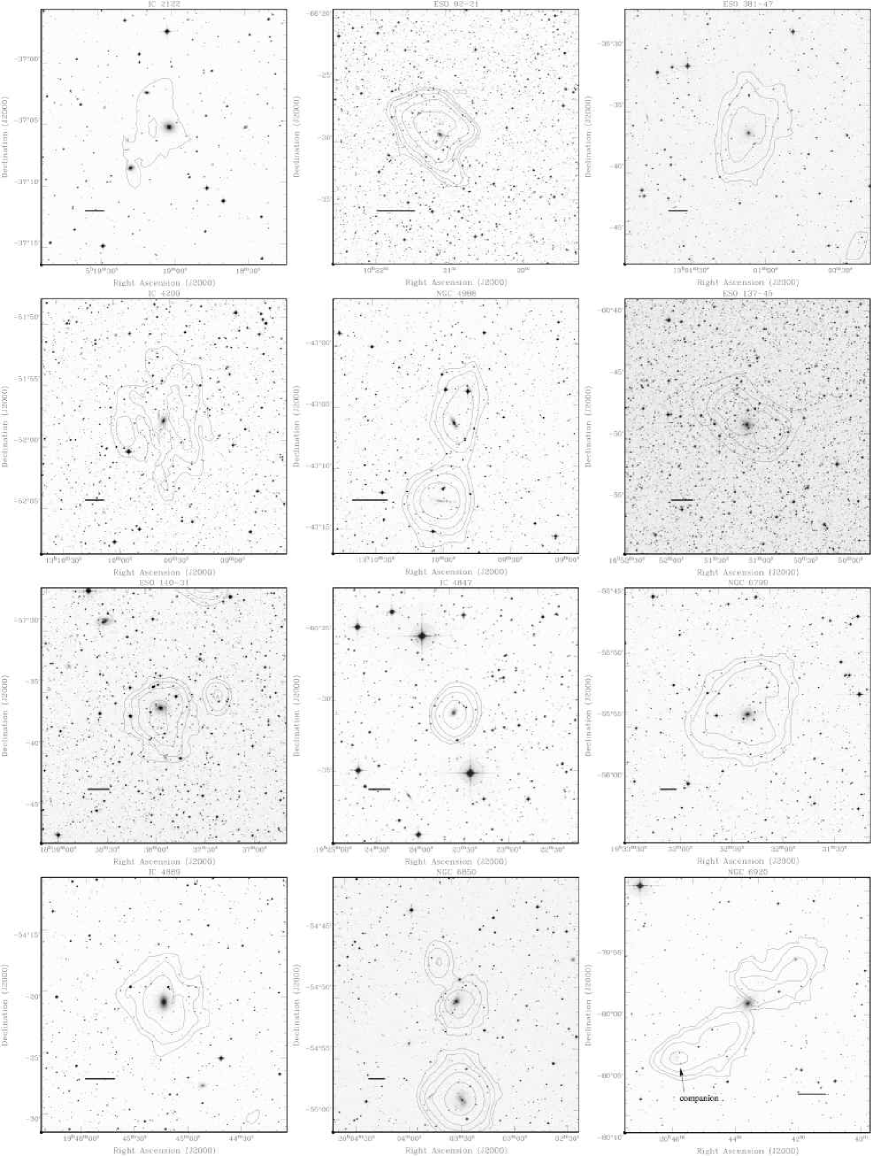
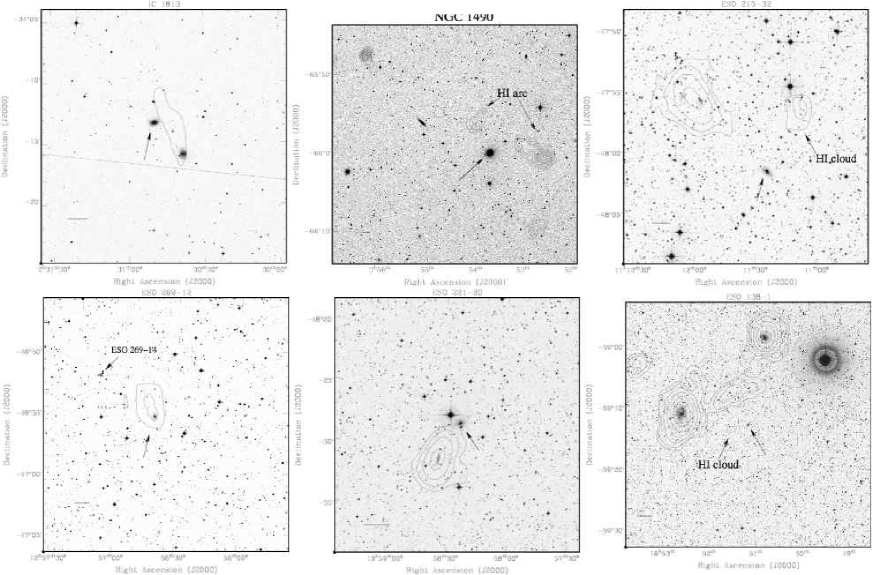
The moment analysis of the data cubes was also done in MIRIAD. The total intensity images of the H i emission were derived based on masks determined from data cubes made by spatially smoothing the original cube to a resolution about twice lower than the original. Pixels with signal below in the smoothed cube were set to zero in the original cube (van Gorkom & Ekers 1989). Figs 1 and 2 show the total H i contours of the detected galaxies superimposed on an optical image. For galaxies were no H i was detected, the upper limits on H i emission were calculated as three times the statistical error on having no signal over a width of 200 km s-1 and over one synthesised beam. The H i masses (or upper limits to them) are given in Table 2 together with the velocity width of the integrated H i profile111We adopt through this paper an Hubble constant of km s-1 Mpc-1. In the end, of the 54 galaxies of our sample, 30 turn out to have H i associated with them.
The continuum data were also reduced using MIRIAD. The final continuum images were made with uniform weighting. The RMS noise levels typically range between 1 and 2 mJy beam-1 (although there are a few cases with much higher noise). All the detected sources appear unresolved and their fluxes (as well as the upper limits for the non-detections) are given in Table 2. For some sources, the poor -coverage resulted in relatively low image quality and this increases the uncertainty of the fluxes given in Table 2.
In almost every field observed, objects other than the target galaxy were detected in H i. These objects are often close to the target and therefore are likely companion galaxies. This information is particularly useful for the study of the effects of the environment that is believed to be an important factor in the evolution of early-type galaxies. The results from the analysis of the environment will be discussed in a forthcoming paper.
4 Results
4.1 H i detections and their morphologies
Despite the limitations of the current data (sparse sampling and limited sensitivity), several interesting results are found. In 30 galaxies the kinematics and/or morphology suggests that the H i has some relation to the galaxy (18 in our new ATCA data and 12 cases from the literature). This includes objects where H i is detected at the position of the target galaxy or it is offset from the galaxy but not obviously associated to any other galaxy in the field and it has a velocity close to that of the target.


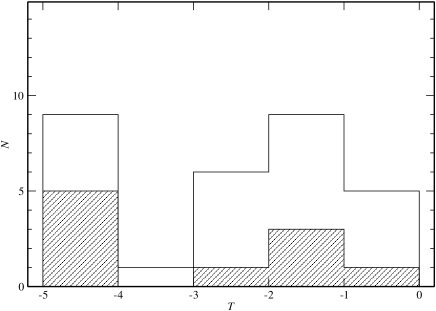
Due to the limited sensitivity of the HIPASS catalogue, the objects discussed here are extremely H i-rich objects. Our selection limit of 2.6 Jy km s-1 corresponds to a H i mass of about for a redshift of 3000 km s-s. Many galaxies in our sample have a higher redshift so our sample is incomplete for smaller masses. Therefore, the class of objects discussed here is somewhat different than those detected in the study of the SAURON galaxies (Morganti et al. 2006) because that is based on much more sensitive observations. This is also evident from the histograms in Fig. 3 showing the distribution of the H i masses of the detections of the two samples. The H i masses of the galaxies detected in our study range from a few times to more than (i.e., several times that of the Milky Way).
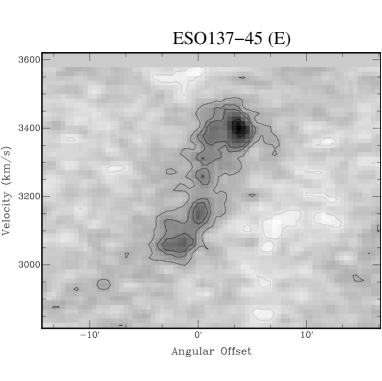
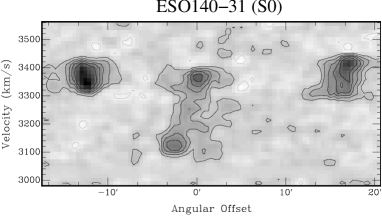
A look at the H i morphology reveals that in most of the detections (20 out of 30) the H i is distributed in a low column density disk or ring-like structure centred on the optical galaxy. Most of these large structures have regular kinematics. This is illustrated by the position-velocity diagrams taken along the kinematical major axis that are shown in Fig. 4. The relatively high incidence of these large structures and their characteristics represents the most important result of these observations. A smaller group of detections (e.g. ESO 221–20 and IC 1813) show tail-like structures pointing away from the galaxy or to the galaxy from a nearby companion. For ESO 269–12 it is uncertain whether it contains a disk or whether it has a tail toward the companion ESO 269–14. Another small subset of galaxies (e.g. NGC 1490, ESO 138–1 and ESO 215–32) shows cloud-like H i structures detected (many tens of kpc) away from the target with no obvious optical counterpart but with velocities similar to the systemic of the target galaxy.
4.2 Large rotating H i structures
About two-thirds of the galaxies from our sample have a more or less regular rotating H i structure.
The observed H i disks are sometimes very large. Their size is indicated in Tables 2 and 4 and ranges from a few tens of kpc up to more than 200 kpc in the case of NGC 6799. The kinematics of the H i structures suggests that the gas in these large structures has fairly regular rotation – at least at the low spatial resolution of our observations. However, it is clear that the low resolution and limited depth of the data are not sufficient to investigate the structures in all detail. Some of the cases here classified as disks may in fact be strongly warped or even polar rings. For example, in ESO 140-31 the H i structure appears to be perpendicular to the optical major axis. At the same time, the kinematics of NGC 6799 and IC 4889 suggests that a warp of 90∘ is present, similar to the already known cases such as NGC 1947, NGC 3108 (Oosterloo et al. 2002) and NGC 5266 (Morganti et al. 1997). Recent higher resolution and deeper observations of IC 4200 (Serra et al. 2006) show that also in this galaxy the disk is strongly warped. More elaborate observations of several galaxies discussed in this paper are already in progress to investigate the H i structures of some of these disks in more detail.
4.3 Tidal tails and offset clouds
There are 10 galaxies in our sample for which the H i is distributed in tail-like structures or in clouds offset from the target galaxy. The presence of these tails and clouds suggest that interactions occurred where some gas is captured from a companion.
An intriguing example is the field elliptical galaxy NGC 1490. A large H i cloud, together with 3 smaller H i clouds, forms an arc of kpc long that half encircles NGC 1490 (see Fig. 2 and Oosterloo et al. 2004 for more details). The total H i mass of the H i clouds is . None of the clouds has an optical counterpart on DSS images, but deeper images show that the largest cloud has a faint, low surface brightness optical counterpart. This is the H i-richest object known with an optical counterpart: . Most interestingly, two small H ii regions are present at the edge of the largest H i cloud, both about 80 kpc removed from any object detected in deep broadband optical images, and they appear to be inter-galactic H ii regions. The H luminosities of the H ii complexes are erg s-1 (i.e. 25-75 times Orion) and the ionised gas has metalicities around 0.25-0.5 solar (Oosterloo et al. 2004). NGC 1490 does not show any signs of accretion or interaction (A. Ferguson priv. comm.). The size of the system of H i clouds and the relative velocities imply a (kinematical) timescale of about 1 Gyr. This is too short for the signatures of a significant merger to disappear. The H i clouds found in the field of NGC 1490 are therefore most likely remnants of a galaxy that has been torn apart in a tidal interaction with NGC 1490 - tidal shredding - while passing a larger galaxy, without merging or accretion taking place (e.g. Bekki et al. 2004) . This kind of interaction can lead to structures of very low surface brightness well outside a large, apparently undisturbed galaxy.
4.4 Confusion & Environment
One of the motivations for the follow up ATCA observations was to quantify the effect of confusion on the detection statistics due to the large beam of the original HIPASS survey. The effects of confusion will be discussed in more detail in Paper II. However, from our observations it is clear that about half of the early-type galaxies whose HIPASS spectra show H i emission, have a nearby companion (i.e. inside the arcmin Parkes beam) with similar velocity, underlining that confusion is a major factor in studying the statistical properties of H i based on single-dish data such as HIPASS. The fact that confusion is an important factor also for early-type galaxies does show that many early-type galaxies do reside in a H i-rich environment.
5 Discussion
5.1 H i-rich early-type galaxies
The most important result from the observations presented here is the finding that in many H i-rich early-type galaxies the neutral hydrogen is distributed in very large, low surface brightness disk-like structures with large H i masses.
The existence of such structures was already known for a few single cases (Morganti et al. 1997, 1998, Oosterloo et al. 2002, van Gorkom & Schiminovich 1997), while also the much deeper observations of the small sample of SAURON early-type galaxies indicated that such disk-like structures exist. The present study is important because it indicates that these massive disk-like gaseous systems are relatively common in gas-rich early-type galaxies. This makes them relevant for the theories that describe the formation and evolution of E/S0’s.
Interestingly, as can be seen from Fig. 5, there is some difference between the H i morphologies properties of elliptical and of S0 galaxies. Tails and offset clouds of H i appear to be somewhat more common in elliptical galaxies, although the difference is statistically speaking not very significant ( vs ). We note that the large, regular structures occur in both types of galaxies, indicating that such structures are not strictly connected with the presence of a stellar disk. This confirms what was found for the SAURON sample (Morganti et al. 2006). These authors do not find evidence for a clear trend of the presence of H i with either the global age of the stellar population or with the global dynamical characteristics of the galaxies. More specifically, for the SAURON galaxies, the H i detections are uniformly spread through the diagram. If fast and slow rotators - galaxies with high and low specific angular momentum - represent the relics of different formation paths, this is not obvious from the presence and characteristics of the H i.
Fig. 3 shows the distribution of . Unlike what observed in spirals, but similar to what earlier observed for early-type galaxies by Knapp et al. (1985), the distribution appears very broad. This is especially clear if we take into account also the distribution found in deep H i observations, i.e. observations more sensitive than HIPASS. This distribution has led previous authors to the conclusion that in early-type galaxies the gas and the stellar content are decoupled and that in most early-type galaxies the gas has an external origin. However, recent studies of nearby spiral galaxies, including our own, show that also these galaxies are continuing to accrete material (van der Hulst & Sancisi 2004; Westmeier, Braun & Thilker 2005). The lack of correlation between the optical luminosity and the gas content observed for early-type galaxies must therefore have a more complex explanation. The very low column density of the gas disks observed in early-type galaxies could imply that what distinguishes a gas-rich early-type galaxy from a spiral is not so much whether accretion occurs or not, but instead is what happens with the material after it has been accreted. The observed column density of the H i typically peaks at values around 1020 cm-2 (the maximum column density is cm-2, observed in ESO 92–21). This is expected to be below the critical density for star formation. Given the low resolution of our data, it is likely that locally the density will be above the threshold for star formation and that stars are forming in a few small regions. However, star formation will not occur on any large scale. This implies that the disks will only slowly be consumed by star formation and that despite the large H i reservoir, the gas disks can stay intact for very long periods of time and that large stellar disks will develop only slowly over time. Perhaps galaxies with such a large H i structure are related to giant LSB galaxies like Malin 1 (Impey & Bothun, 1989). Such galaxies are characterised by a bright bulge surrounded by a large, very low surface brightness optical disk. If such a relation exist, deep optical imaging of the galaxies of our sample could reveal such LSB optical disks.
The large H i disks appear to have relatively regular kinematics. Although this will need to be further investigated with much deeper observations of higher resolution, the overall regularity of the kinematics is indicating that the gas is settled and therefore these disks must be relatively old and long-lived. The gas must have been around long enough in order to settle into a regular configuration. Thus, whatever is the process that created these structures, it must have happened at least a few times years ago (corresponding to a few orbital periods in the outer regions of the disks), with the oldest disks having formed before . These large gas disk must be relics of an important aspect of the evolution of these early-type galaxies.
5.2 Origin of the H i disks
As mentioned in the Introduction, the observed gas-rich galaxies can form via major merger, with the H i disks originating from the late-infall of high-angular-momentum gas. Simulations (Hibbard & van Gorkom 1996; Hibbard & Mihos 1995, Barnes 2002, Naab et al. 2006) show indeed that at first this gas forms the extended tidal tails and bridges observed in many merging systems. Later, it can be re-accreted by the newly formed galaxy and settle into an extended but dilute rotationally-supported disk. Indeed, some of the H i-rich early-type galaxies already known to be gas rich have been interpreted as the result of a major merger of gas-rich galaxies (e.g., Centaurus A, NGC 5266 and NGC 3108). Scaling the results of the simulations to the stellar mass of the sample galaxies, one can reproduce gas-disks of size and mass comparable with those observed. The presence of large amount of H i in regular structures could be connected to a specific type of merger. For example, Burkert & Naab (2004) suggest that the extended disk-like component naturally form in gas-rich fast-rotating, 3:1 merger remnants (Naab & Burkert 2001) although even in 1:1 mergers the remaining gas in the outer parts of the remnant has high enough angular momentum to form extended gas disks as it falls back (Barnes 2002).
If the neutral hydrogen in early-type galaxies is acquired via merger and/or accretion, one would perhaps have expected a larger number of tail-like structures or offset H i structures in our sample. The relatively small number of such structures is possibly due to the fact that our survey is shallow and that these tails may tend to have smaller masses. An indication for this comes from more sensitive observations of the SAURON sample (Morganti et al. 2006) where the fraction of galaxies with tails and offset clouds is somewhat higher. It is possible that a very extended and regular gas configuration is typical only of systems with a large H i mass, while irregular morphologies are easier to find among the less massive ones. An other possibility is that the rate of major mergers have been higher in the past. Indeed, given the size and regular appearance of the observed H i disks, they must be quite old, in many cases well over yr.
An alternative to the merger hypothesis is that accretion of gas from the IGM would also result in the formation of extended and regular cold-gas structures with masses up to 1010. According to simulations, a fraction of the accreted gas is not shock-heated to the virial temperature of the accreting halo, but is kept below 105 K (Binney 2004, Keres et al. 2005 and references therein). This colder gas can cool over a reasonable time-scale (provided the environment is not too hostile so it is not destroyed by neighbouring galaxies, and a few-percent enrichment from the stellar processes in the galaxy is allowed) providing the necessary supply of atomic gas. In some simulations, indeed large gaseous disks are found around galaxies that also show kinematics similar to that observed here, e.g., in the form of polar disks (Macció et al. 2006). So it appears that the formation of H i disks via cold accretion is viable.
A possible way to distinguish between the two scenarios is by studying different properties of the H i-rich galaxies in order to find other signatures of their evolution. If the formation of the gas disk can be traced back to a discrete event, than a merger seems a more likely explanation for its origin, while if it is the result of smooth accretion from the IGM, no such signature would be expected in, for example, the stellar population. Serra et al. (2006) showed this to be a good approach by relating deep H i observations, stellar populations analysis and the study of optical morphology for one of the galaxies of our sample (IC 4200). They found a strongly warped H i disk (containing almost of H i), a young stellar population in the centre of the galaxy and stellar shells. Furthermore, they could match the timescale for the formation of the gas disk, as estimated from the H i morphology/kinematics, with the presence of a distinct young stellar population. They conclude that IC 4200 formed via a major merger of two Milky-Way-like galaxies between 1 and 3 Gyr ago. These authors are carrying out a similar analysis on a sample of galaxies that contains several objects presented in the present paper and this will allow to make a more statistical assessment. It is clear, however, that the gas accretion cannot always be directly connected to the stellar population. Morganti et al. (2006) find that the properties of the stellar population of early-type galaxies do not correlate with the gas content, i.e., galaxies with a purely old stellar population as well as those where a young sub-population is present, can be either gas-poor or gas-rich. This suggests that at least in some cases accretion from the IGM may have occurred. Their sample mostly contains galaxies that have (much) less H i than those of the sample presented here and it remains to be seen whether the correlation is also absent for early-type galaxies containing more H i.

5.3 (Radio-loud) AGN and neutral hydrogen
Nuclear activity is often claimed to be related to the presence of interaction or merger in the life of a galaxy. Torques and shocks during the merger can remove angular momentum from the gas in the merging galaxies and this provides injection of substantial amounts of gas/dust into the central nuclear regions (see e.g. Mihos & Hernquist 1996). Because of this, it is of interest to explore whether any relation exists between the presence of continuum emission and the presence/structure of the neutral hydrogen.
The radio continuum for each target (or an upper limit to it) has been derived using the line-free channels of our ATCA observations. The fluxes and corresponding radio powers are listed in Table 2 and 4, and are plotted vs the H i mass in Fig. 6. It is clear that there is no correlation between the radio continuum and the H i mass.
Although our data cannot tell us whether the continuum emission is originating from star formation or from the active nucleus, emission from the latter is clearly present at least in some cases (e.g. IC 4200 and IC 5063). A detailed study of the origin of the continuum emission will need supplementary data. However, it is interesting at this stage to point out that the large-scale H i structures, that are possibly originating from major mergers, do not necessarily host a radio-loud source and none of them host a large-scale radio galaxy. This is interesting as gas-rich mergers between disk galaxies have been claimed to be at the origin of powerful radio galaxies. As describe above, these type of merger can form the large, H i-rich disks detected in this survey. The lack of detection of large radio galaxies could be related to some bias in the selection inside the HIPASS survey: sources with too strong a radio continuum would not be easily detected in H i using single dish observations. However, it would be consistent with what obtained from a H i survey in nearby radio galaxies (Emonts et al. 2006). From this study, the largest ( kpc scale) and richest in H i () structures are only associated to compact radio sources. These are sources that unlikely will grow to become large radio galaxies but may become comparable (once that the main phase of radio activity is past) to the galaxies with radio continuum and large H i structures observed in our HIPASS survey. Thus, all this indicates that either the trigger and continuous fuel needed to produce a large-scale radio galaxy happens through a different mechanism than the one producing the large H i disks or, alternatively, the presence of an extended radio galaxy prevents the formation of large H i structures (see also Emonts et al. 2006 for further discussion).
6 Conclusions
In this paper we have discussed the morphology and kinematics of the H i of 30 gas-rich early-type galaxies homogeneously selected on the basis of their H i properties. Given that these galaxies were selected from the HIPASS, they correspond to the most gas-rich early-type galaxies. The main result is that in about 2/3 of the galaxies the H i is in a regularly rotating disk- or ring-like structure. Only in about 1/3 of the galaxies the H i shows irregular morphologies. The high incidence of regular H i structures found in this sample confirms what was found for the SAURON sample of early-type galaxies (Morganti et al. 2006) for which a large fraction of regular H i structures is also detected. The regular disk-like structures shown here can be up to 200 kpc in size and contain up to of H i. Several of these disks are strongly warped. Given their size, some of these disks must be old and must have formed several Gyr ago. The column density of the H i is low and only very little star formation is expected to occur. Perhaps these systems are related to giant LSB galaxies like Malin 1. Given the low star formations rate, these disks will remain intact for very long periods of time. The H i properties correlate only weakly with the optical classification and H i disks are detected around both E and S0 galaxies, as is also the case for the galaxies from the SAURON sample. Therefore, if these two types of galaxies are the result of different formation paths, this is not strongly reflected in the presence and characteristics of the H i. Given the current data, both merging and gas accretion from the IGM are viable explanations for the origin of the gas in these galaxies. A more detailed investigation of the correlation with, e.g., the properties of the stellar population, is required in order to be able to distinguish between these two mechanisms.
Acknowledgements.
This work is based on observations with the Australia Telescope Compact Array (ATCA), which is operated by the CSIRO Australia Telescope National Facility. This research has made use of the NASA Extragalactic Database (NED), whose contributions to this paper are gratefully acknowledged. The Digitized Sky Survey was produced at the Space Telescope Science Institute under US Government grant NAG W-2166 RM and TO wish to thank the University of Sydney for the support during their visits.References
- (1) Balcells M., van Gorkom J.H., Sancisi R., del Burgo C. 2001 AJ 122, 1758
- (2) Barnes et al. 2001, MNRAS 322, 486
- (3) Barnes J.E. 2002 MNRAS 333, 481
- (4) Bekki K., Couch W.J., Ryan-Weber E.V., Webster R.L. 2004, in Recycling Intergalactic and Interstellar Matter, IAU 217, Eds. P.-A. Duc, J. Braine, and E. Brinks. ASP, p.418
- (5) Binney J. 2004, MNRAS 347, 1093
- (6) Burkert A. & Naab T. 2004 Cambridge University Press, as part of the Carnegie Observatories Astrophysics Series. Edited by L. C. Ho, 2004, p. 421. (astro-ph/0305076)
- (7) Chung A., Koribalski B., Bureau M., van Gorkom J. 2006 MNRAS in press (astro-ph/0605600)
- (8) de Vaucouleurs G., de Vaucouleurs A., Corwin H.G., Buta R.J., Paturel G., Fouque P., 1991, Third Reference Catalog of Bright Galaxies, Volume 1–3, XII, Springer-Verlag (RC3)
- (9) de Zeeuw et al. 2002 MNRAS 329, 513
- (10) Emonts B., Morganti R., Oosterloo T., van der Hulst J.M., van Moorsel G., Tadhunter C.N. 2006 A&A in press
- (11) Hibbard J.E. & Mihos J.C. 1995, AJ 110, 140
- (12) Hibbard J.E. & van Gorkom J.H. 1996, AJ 111, 655
- (13) Impey, C. & Bothun, G. 1989, ApJ, 341, 89
- (14) Keres D., Katz N., Weinberg D.H., Davé R. 2005, MNRAS 363, 2
- (15) Knapp G.R., Turner, E.L. & Cunniffe, P.E., 1985, AJ, 90, 545
- (16) Macció A., Moore B., Stadel J. 2006, ApJL 636, L25
- (17) Malin D. F. & Carter D. 1980, Nature, 285, 643
- (18) Malphrus B., Simpson C., Gottesman S.T., Hawarden T.G. 1997, AJ 114, 1427
- (19) Meurer G., Staveley-Smith L., Killeen N.E.B. 1998, MNRAS 300, 705
- (20) Meyer et al. 2004, MNRAS, 350, 1195
- (21) Mihos J.C. & Hernquist L. 1996, ApJ 464, 641
- (22) Morganti R., Sadler E.M., Oosterloo T.A., Pizzella A. & Bertola, F., 1997, AJ, 113, 937
- (23) Morganti R., Oosterloo T., Tsvetanov Z., 1998, AJ 115, 915
- (24) Morganti R., de Zeeuw T., Oosterloo T. et al. 2006, MNRAS 371, 157
- (25) Naab T., Burkert A., 2001, ApJ 555, L91
- (26) Naab T., Khochfar S., Burkert A. 2006, ApJ 638, 745
- (27) Oosterloo, T.A., Morgnati, R., Sadler, E.M., Vergani, D. & Caldwell, N. 2002, AJ 123, 729
- (28) Oosterloo et al. 2004, in Recycling Intergalactic and Interstellar Matter, IAU Symp 217, eds. P.-A. Duc, J. Braine, and E. Brinks, p.486 (astro-ph/0310632)
- (29) Oosterloo T., Morganti R., Sadler E. 1999 in Star Formation in Early Type Galaxies, ASP Conference Series 163, ed. P. Carral & J. Cepa 163, p.72 (astro-ph/9809075)
- (30) Roberts, M.S. & Haynes, M.P. 1994, ARA&A, 32, 115
- (31) Sadler E.M., Oosterloo T.A., Morganti R. & Karakas A., 2000, AJ 119, 1180
- (32) Sadler E.M., & Gerhard O.E. 1985, MNRAS, 214, 177
- (33) Sarzi M. et al. 2006, MNRAS, 366, 1151
- (34) Sault, R.J., Teuben, P.J. & Wright, M.C.H. 1995, in Astronomical Data Analysis Software and Systems IV, R. Shaw, H.E. Payne and J.J.E. Hayes, eds, Astronomical Society of the Pacific Conference Series, 77, p. 433
- (35) Schiminovich D., van Gorkom J., van der Hulst J.M., Kasow S. 1994, ApJ 423L, 101
- (36) Schiminovich D., van Gorkom J.H., van der Hulst J.M., Malin D.F. 1995 ApJ 444L, 77
- (37) Schneider et al. 1989, AJ, 97, 666
- (38) Schweizer F. 1998, in Galaxies: Interactions and Induced Star Formation, Saas-Fee Advanced Course 26. Kennicutt et al. eds. Springer-Verlag Berlin/Heidelberg; p.105
- (39) Schweizer F. & Seitzer P. 1992, AJ 104, 1039
- (40) Schweizer F., van Gorkom J., Seitzer P. 1989 ApJ 338,770
- (41) Serra P., Trager S.C., van der Hulst J.M., Oosterloo T.A., Morganti R. 2006, A&A, 453, 493
- (42) Tadhunter C.N., Robinson T.G., Gonzalez-Delgado R.M., Wills K., Morganti R., 2005, MNRAS 356, 480
- (43) Trager S.C., Faber S., Worthey G., Gonz’ales J.J. 2000, AJ 120, 165
- (44) van der Hulst, J.M., Sancisi, R. 2004,
- (45) van Gorkom J., Ekers R.D. 1989, in Synthesis imaging in radio astronomy, edited by Richard A. Perley, Frederic R. Schwab, and Alan H. Bridle. ASP vol. 6, p341
- (46) van Gorkom J., Schiminovich D. 1997 inThe Nature of Elliptical Galaxies; 2nd Stromlo Symposium, eds. M. Arnaboldi; G. S. Da Costa; and P. Saha (1997), ASP Conference Series; Vol. 116; p.310
- (47) Westmeier, T., Braun, R., Thilker, D. 2005, A&A, 436, 101
| Name | RA | Dec | Type | K | IRAS | Obs. | Exp. | noise | ||
|---|---|---|---|---|---|---|---|---|---|---|
| J2000.0 | J2000.0 | mag. | Jy | km s-1 | h | mJy beam-1 | ||||
| NGC 1490 | 03:53:34.5 | 66:01:02 | E1 | –5.0 | 9.05 | 0.033 | 5397 | 20Oct01 | 12 | 1.0 |
| ESO 88-18 | 07:29:06.1 | 66:54:44 | E5P | –5.0 | 11.72 | … | 5055 | 22Oct01 | 2.1 | 3.6 |
| NGC 2434 | 07:34:51.5 | 69:17:01 | E0 | –5.0 | 7.85 | 0.023 | 1390 | 22Oct01 | 2.1 | 3.5 |
| ESO 318-21 | 10:53:05.3 | 40:19:46 | E? | … | 9.52 | 0.044 | 4831 | 15Mar01 | 8.1 | 1.4 |
| ESO 137-45 | 16:51:03.5 | 60:48:30 | E0 | –5.0 | 8.54 | 0.180 | 3351 | 07Mar02 | 13 | 1.3 |
| ESO 138-1 | 16:51:20.6 | 59:14:11 | E? | … | (9.75) | 2.648 | 2740 | 09Mar02 | 10.6 | 1.2 |
| ESO 140-31 | 18:37:54.0 | 57:36:42 | E1 | –5.0 | 9.50 | … | 3150 | 03Jul01 | 5.7 | 1.5 |
| IC 4765 | 18:47:18.5 | 63:19:57 | E4 | –4.0 | 8.11 | 0.130 | 4507 | 02Jul01 | 1.5 | 3.2 |
| IC 4889 | 19:45:15.9 | 54:20:37 | E5 | –5.0 | 8.00 | 0.160 | 2574 | 03Jul01 | 5.7 | 1.5 |
| NGC 6877 | 20:18:37.1 | 70:51:16 | E6 | –5.0 | (…) | … | 4440 | 12Jun01 | 2.9 | 2.3 |
| IC 1724 | 01:43:09.1 | 34:14:31 | S0 | –1.0 | 10.02 | … | 3816 | 21Oct01 | 1.3 | 3.3 |
| ESO 153-4 | 01:58:30.5 | 56:14:57 | S0 | –3.0 | (…) | 0.390 | 5936 | 22Oct01 | 1.5 | 3.3 |
| IC 1813 | 02:30:49.1 | 34:13:14 | S0 | –0.5 | 10.04 | 0.220 | 4453 | 21Oct01 | 1.2 | 3.8 |
| IC 2041 | 04:12:34.3 | 32:48:59 | S0 | –2.0 | 11.65 | … | 1260 | 21Oct01 | 1.5 | 3.3 |
| IC 2122 | 05:19:01.1 | 37:05:16 | S0 | –2.7 | 9.40 | … | 4663 | 21Oct01 | 2.0 | 3.1 |
| IC 2200A | 07:28:06.7 | 62:21:45 | S0 | –2.7 | 9.47 | … | 3248 | 22Oct01 | 2.3 | 3.3 |
| NGC 2904 | 09:30:16.9 | 30:23:01 | S0? | –3.0 | 9.19 | 0.075 | 2395 | 21Oct01 | 2.7 | 4.0 |
| ESO 92-21 | 10:21:05.5 | 66:29:31 | S0 | –3.0 | (9.76) | … | [2023] | 14Mar02 | 2.5 | 3.1 |
| ESO 215-32 | 11:11:22.9 | 48:01:07 | S0? | –2.0 | 9.88 | … | 4311 | 08Mar02 | 2.1 | 2.8 |
| MCG-7-26-21 | 12:39:50.4 | 41:06:20 | S0 | –2.0 | 9.46 | … | 4391 | 08Mar02 | 2.1 | 2.9 |
| ESO 322-84 | 12:48:00.0 | 39:37:51 | S0 | –2.0 | 10.26 | … | 4469 | 08Mar02 | 2.4 | 2.8 |
| ESO 323-13 | 12:51:32.4 | 41:13:42 | S0? | … | 10.44 | 0.374 | 4802 | 08Mar02 | 2.1 | 3.0 |
| ESO 269-12 | 12:56:40.8 | 46:55:31 | S0? | –2.0a | 10.13 | … | 4950 | 10Mar02 | 2.1 | 3.6 |
| ESO 269-14 | 12:57:06.9 | 46:52:19 | S0? | … | 10.82 | 1.556 | 4850 | 10Mar02 | 2.1 | 3.6 |
| ESO 381-47 | 13:01:05.4 | 35:37:00 | S0? | –2.0a | 10.50 | … | 4771 | 08Mar02 | 2.0 | 3.2 |
| IC 4200 | 13:09:34.7 | 51:58:07 | S0 | –2.0 | 8.72 | … | 3938 | 10Mar02 | 1.8 | 3.1 |
| NGC 4988 | 13:09:54.1 | 43:06:22 | S0 | –1.4 | 10.23 | 1.529 | 2097 | 14Mar02 | 2.0 | 2.7 |
| ESO 269-80 | 13:19:01.7 | 47:15:27 | S0 | –3.0 | 9.01 | 0.550 | 3202 | 15Mar02 | 1.3 | 3.3 |
| NGC 5234 | 13:37:29.9 | 49:50:16 | S0 | –0.6 | 9.51 | … | 3650 | 14Mar02 | 2.2 | 2.8 |
| IC 4312 | 13:40:31.3 | 51:04:16 | S0 | –2.0 | 8.81 | 2.106 | 4001 | 10Mar02 | 1.7 | 3.2 |
| ESO 221-20 | 13:58:23.4 | 48:28:29 | S0p | –3.0 | 9.24 | … | 2780 | 14Mar02 | 2.4 | 2.7 |
| ESO 137-44A | 16:50:56.0 | 61:48:54 | S0? | –2.0 | 8.60 | … | 4493 | 10Mar02 | 1.9 | 3.8 |
| IC 4647 | 17:26:02.2 | 80:11:41 | S0 | –2.0 | 10.24 | … | 4872 | 10Mar02 | 1.9 | 4.0 |
| ESO 103-49 | 18:42:02.8 | 65:05:50 | S0? | … | 10.37 | … | 4610 | 12Jun01 | 2.9 | 2.3 |
| IC 4847 | 19:23:32.7 | 65:30:25 | S0? | –2.0a | 11.35 | 0.378 | 4300 | 11Jun01 | 2.5 | 1.5∗ |
| 02Jul01 | 4.3 | |||||||||
| NGC 6799 | 19:32:16.2 | 55:54:30 | S0 | –3.7 | 9.46 | 0.050 | 5990? | 11Jun01 | 2.5 | 1.0 |
| 01Jul01 | 12 | |||||||||
| 04Jul01 | 5.4 | |||||||||
| NGC 6850 | 20:03:29.9 | 54:50:45 | S0p | –1.0 | 9.19 | 0.426 | 4950 | 12Jun01 | 3.0 | 1.3 |
| 02Jul01 | 3.9 | |||||||||
| IC 4970 | 20:16:57.9 | 70:44:57 | S0p | –3.2 | 10.89 | … | 4727 | 12Jun01 | 2.9 | 2.8 |
| ESO 234-11 | 20:22:02.7 | 47:59:12 | S0 | –1.6 | 10.38 | … | 5702 | 12Jun01 | 2.7 | 2.4 |
| NGC 6920 | 20:43:56.6 | 80:00:03 | S0 | –2.0 | 8.34 | 0.310 | 2774 | 11Jun01 | 2.2 | 2.2 |
| 04Jul01 | 4.9 | |||||||||
| NGC 7166 | 22:00:32.8 | 43:23:22 | S0 | –3.0 | 8.48 | 0.210 | 2426 | 11Jun01 | 2.0 | |
| ESO 240-10 | 23:37:44.3 | 47:30:17 | S0p | –2.0 | 8.69 | … | 3221 | 11Jun01 | 1.7 | 2.8 |
Notes: ∗ when more than one observations is available, the noise is from the combined data; a From ESO Cat on NED.
| Name | / | log | Morphology | |||||
| Jy km s-1 | km s-1 | ( mJy | W Hz-1 | Contour levels (CL) in cm-2 | ||||
| Ellipticals | ||||||||
| NGC 1490 | 34.9 | 5.7 | 8.0 | … | 0.23 | 5.7 | 21.55 | H i tail/ring 100 kpc |
| from the galaxy1 | ||||||||
| ESO 88-18 | 9.0 | … | … | 20.0 | 22.09 | |||
| NGC 2434 | 4.3 | … | … | |||||
| ESO 318-21 | 17.9 | … | … | |||||
| ESO 137-45 | 14.5 | 13.34 | 6.8 | 480 | 0.47 | 16.8 | 21.58 | disk of kpc |
| CL: 4, 8, … | ||||||||
| ESO 138-1 | 3.5 | 0.31 | 0.11 | … | 0.03 | 30.6 | 21.65 | possible H i off-galaxy cloud or |
| companion kpc from target | ||||||||
| 2, 4, 8, 16, … | ||||||||
| ESO 140-31 | 9.1 | 7.7 | 3.8 | 310 | 0.42 | disk or polar ring( kpc) | ||
| CL: 2, 4, 8, 16, … | ||||||||
| IC 4765 | 68.6 | … | … | 5.6 | 21.41 | |||
| IC 4889 | 20.6 | 7.1 | 2.1 | 160 | 0.10 | disk of kpc in size | ||
| CL: 2, 4, 8, 16, … | ||||||||
| NGC 6877 | 28.7 | … | … | IC 4070 field | ||||
| S0s | ||||||||
| IC 1724 | 9.2 | … | … | |||||
| ESO 153-4 | 14.1 | … | … | |||||
| IC 1813 | 12.1 | … | 125 | 21.20 | interacting? H i tail | |||
| ( kpc) from a companion | ||||||||
| CL: 4, 8, 16, … | ||||||||
| IC 2041 | 0.6 | … | … | 19.44 | ||||
| IC 2122 | 18.4 | 5.7 | 5.9 | 200? | 0.32 | disk (of kpc), interacting? | ||
| CL: 4, 8, 16, … | ||||||||
| IC 2200A | 8.8 | … | … | 15.4 | 21.51 | dumbell system | ||
| NGC 2904 | 5.1 | … | … | |||||
| ESO 92-21 | 2.7 | 19.2 | 3.4 | 250 | 1.26 | disk ( kpc in size) | ||
| CL: 2, 4, 8, 16, … | ||||||||
| ESO 215-32 | 10.7 | 0.68 | 0.6 | … | 0.06 | off- galaxy cloud, | ||
| about kpc from target | ||||||||
| CL: 2, 4, 8, 16, … 1019 | ||||||||
| MCG-7-26-21 | … | … | … | |||||
| ESO 322-84 | 9.4 | … | … | 15.26 | 21.81 | |||
| ESO 323-13 | 10.3 | … | … | |||||
| ESO 269-12 | 8.9 | 1.0 | 1.2 | 0.13 | faint disk ( kpc) or tail | |||
| toward ESO 269-14 | ||||||||
| CL: 2, 4, 8, 16, … | ||||||||
| ESO 269-14 | 9.7 | … | … | 9.0 | 21.65 | see ESO 269-12 | ||
| ESO 381-47 | 15.9 | 7.1 | 7.6 | 130 | 0.48 | disk ( kpc) | ||
| + cloud ( kpc from target) | ||||||||
| CL: 2, 4, 8, 16, … | ||||||||
| IC 4200 | 11.7 | 8.7 | 5.9 | 210 | 0.51 | 11.5 | 21.56 | disk2 (about 160 kpc in size) |
| CL: 2, 4, 8, 16, … 1019 | ||||||||
| NGC 4988 | 3.1 | 10.0 | 2.11 | 170 | 0.68 | disk of kpc | ||
| CL: 4, 8, 16, … | ||||||||
| ESO 269-80 | 7.9 | … | … | |||||
| NGC 5234 | 9.0 | … | … | |||||
| IC 4312 | 18.7 | … | … | 4.2 | 21.14 | |||
| ESO 221-20 | 9.9 | … | … | tail to target from companion | ||||
| CL: 4, 8, 16, … |
| Name | / | log | Morphology | |||||
| Jy km s-1 | km s-1 | mJy | W Hz-1 | Contour levels (CL) in cm-2 | ||||
| ESO 137-44A | … | … | … | … | 15.2 | 21.80 | ||
| IC 4647 | … | … | … | … | ||||
| ESO 103-49 | 6.2 | … | … | |||||
| IC 4847 | 5.3 | 4.03 | 3.1 | 220 | 0.58 | disk of kpc in size | ||
| CL: 2, 4, 8, 16, … | ||||||||
| NGC 6799 | 43.9 | 14.30 | 7.6 | 250 | 0.17 | disk of kpc in size, | ||
| possible 90∘ warp | ||||||||
| CL: 2, 4, 8, 16, … | ||||||||
| NGC 6850 | 26.8 | 2.92 | 3.0 | 300 | 0.11 | disk of kpc | ||
| CL: 2, 4, 8, 16, … | ||||||||
| IC 4970 | 13.4 | … | … | |||||
| ESO 234-11 | 13.8 | … | … | |||||
| NGC 6920 | 11.3 | 13.09 | 4.4 | 420 | 0.39 | 4.1 | 20.78 | disk of kpc in size |
| CL: 2, 4, 8, 16, … | ||||||||
| NGC 7166 | 13.5 | … | … | |||||
| ESO 240-10 | 27.0 | … | . .. |
References: ∗ from NVSS; 1 Oosterloo et al. (in prep); 2 Serra et al. (2006)
| Name | RA | Dec | vhel | L/B | log | Morph. | Ref. | |||||
|---|---|---|---|---|---|---|---|---|---|---|---|---|
| (J2000) | km s-1 | mJy | W Hz-1 | |||||||||
| NGC 802 | S0 | 01 59 07.1 | 67 52 11 | 0.8 | 1505 | 1.1 | 0.40 | 0.42 | 1.9 | 20.0 | disk 13 kpc | 1 |
| IC 2006 | S0 | 03 54 28.4 | 35 58 02 | 4.5 | 1364 | 8.7 | 0.24 | 0.03 | 3.0 | 20.1 | ring 30 kpc | 2 |
| ESO 118–34 | S0 | 04 40 17.2 | 58 44 47 | 2.0 | 1171 | 1.1 | 0.13 | 0.12 | 4.0 | 20.1 | disk 7 kpc | 1 |
| NGC 1596 | S0 | 04 27 37.8 | 55 01 37 | 2.0 | 1465 | 8.5 | 0.8 | 0.03 | 1.0 | 19.7 | tail 40 kpc | 3 |
| NGC 1947 | S0 | 05 26 47.5 | 63 45 41 | 3.0 | 1157 | 9.2 | 0.17 | 0.02 | 13.0 | 20.6 | disk 10 kpc | 5 |
| NGC 2328 | S0 | 07 02 36.7 | 42 04 09 | 2.9 | 1159 | 3.3 | 0.10 | 0.07 | 8.1 | 20.4 | disk 15 kpc | 1 |
| NGC 3108 | S0 | 10 02 29.5 | 31 40 37 | 1.0 | 2673 | 25.0 | 2.34 | 0.09 | 1.4 | 20.4 | disk 30 kpc | 5 |
| NGC 4936 | E | 13 04 17.1 | 30 31 34 | 5.0 | 3215 | 35,3 | 1.1 | 0.03 | 39.8 | 22.0 | offset cloud 80 kpc | 9 |
| NGC 5266 | S0 | 13 43 01.7 | 48 10 12 | 3.0 | 2989 | 70.9 | 12.9 | 0.18 | 12.3 | 21.4 | disk 200 kpc | 7 |
| NGC 5291 | E | 13 48 49.1 | 30 13 07 | 4.6 | 4376 | 6.3 | 1.6 | 0.25 | 5.8 | 21.4 | tail 180 kpc | 8 |
| IC 5063 | S0 | 20 52 02.1 | 57 04 12 | 0.8 | 3420 | 32.1 | 4.3 | 0.13 | 2100 | 23.8 | disk 30 kpc | 5 |
| IC 1459 | E | 22 57 09.5 | 36 27 37 | 5.0 | 1836 | 34.0 | 0.2 | 0.06 | 1281 | 23.0 | tails kpc | 6 |
References:
1) Sadler et al. 2000;
2) Schweizer, van Gorkom & Seitzer 1989;
3) Chung et al. 2006 (astroph/0605600)
4) Meurer, Staveley–Smith & Killeen 1998;
5) Oosterloo et al. 2002;
6) Oosterloo et al. 1999;
7) Morganti et al. 1997;
8) Malphrus et al. 1997;
9) J. van Gorkom & T. Oosterloo priv. comm.