∎
28040-Madrid (Spain), 22email: mercedes.molla@ciemat.es 33institutetext: E. Hardy 44institutetext: NRAO, Casilla El Golf 16-10, Santiago (Chile),
44email: ehardy@nrao.edu
The National Radio Astronomy Observatory is a facility of the National Science Foundation operated under cooperative agreement by Associated Universities, Inc. 55institutetext: A. I. Díaz 66institutetext: Dpto. de Física Teórica, Universidad Autónoma de Madrid,
Cantoblanco, 28049-Madrid (Spain), 66email: angeles.diaz@uam.es
The H2 density within spiral and irregular galaxies at high redshift: estimating CO detection limits
Abstract
We have computed a grid of chemical evolution models for a large set of spiral and irregular theoretical galaxies of different total mass. In our models, the gas phase has two components, the diffuse and the molecular one (). It is possible, therefore, to follow the time (or redshift) evolution of the expected density of the phase. We will show the predictions of this gas density at hight redshift, which might be detected with ALMA, in this type of galaxies.
Keywords:
Galaxies:Spirals Galaxies: Irregulars Interstellar medium Molecular gas1 Introduction
The molecular interstellar medium plays a critical role in the evolution of galaxies since it provides the material from which stars form. There are observations sol05 of rotational transitions of CO within , mostly in quasars and Early Universe Molecular Emission Line Galaxies (hereinafter QSO’s and EMGs, respectively) which demonstrate that molecular clouds exist already at the epoch of the galaxy formation. However, the current sample is scarce for , where the study of the star and galaxy formation is specially interesting. ALMA is the instrument that may solve this problem.
In our chemical evolution models the gas phase has two components, the diffuse and the molecular phases of gas, which we treat separately. This way, it is possible to follow the evolution of the expected density of H2 with redshift. We will show here our predictions about the density at high redshift, and we will analyze if they might be detectable with ALMA.
2 A grid of multiphase chemical evolution models
We have computed a wide grid of chemical evolution models for a large set of theoretical spiral and irregular galaxies of different total mass mol05 by using the multiphase chemical evolution model from fer92 ; fer94 ; mol96 . We have simulated theoretical models with 44 different radial distributions of total mass and 10 star-forming efficiencies, with values in the range [1–0], which we denoted by from 1 to 10, for each one of them. The 440 resulting models provide the time evolution for specific radial regions within each galaxy modeled, with the corresponding mass in each gaseous or stellar phase, as well as their elemental abundances. This type of model was already applied to several individual spiral galaxies in mol97 , where it was shown that the model is adequately calibrated and that it may be used for galaxies of different morphological types and different total masses.
The code assumes that a total mass, , initially as diffuse gas, is located within a protogalaxy or halo. The gas falls onto the equatorial plane forming out the spiral disk at a rate defined by a collapse time-scale which depends on . In each zone, halo or disk, several radial regions are defined. We follow separately the evolution in each region.
The assumed star formation in the halo is a power law of the diffuse gas. In the disk, however, we assume that the star formation occurs in two steps: first, molecular clouds () form from the diffuse gas (HI) also following a power law.
Then, stars form by two means: 1) cloud-cloud collisions, and 2) by the interaction of the massive stars with the surrounding molecular clouds: This way, in our models the gas has two components: HI and .
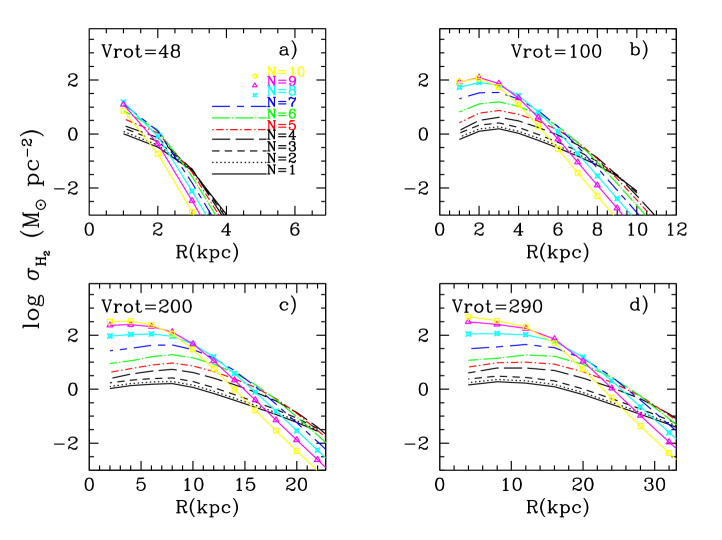
Since we have computed separately the diffuse gas evolution and the molecular clouds evolution, we obtain the radial distributions of the molecular gas mass, which is represented in Fig. 1. There we show the radial distributions of the molecular gas density at the present-time for 4 values of the rotation velocity, or total mass of the Galaxy. Thus, panel a) shows the radial distributions produced in a low mass galaxy while d) represents a massive galaxy. Panel c) is the modeled galaxy most similar to our Milky Way Galaxy and panel d) is an intermediate mass galaxy. In each one of these panels models for different star formation efficiencies, named by , are represented. The lines in color correspond to the lowest star-forming efficiencies (high values), which maintain a higher density than in cases where stars are formed more efficiently (black lines). The distributions are close to exponential in the external regions but are flatter at the inner regions, mostly when the N is low, as is in fact observed in Nature nish01 .
The evolution of the total mass of in galaxies is represented in Fig 2. The magenta open stars are estimates from ber05 for nearby QSOs. The predicted present time molecular gas masses are similar to those ones of local objects with a maximum for in agreement with the observational limit , shown by a green solid line, obtained for those authors. The red full dots are the estimates from sol05 for EMGs. The observed molecular gas masses are decreasing for decreasing in agreement with the most of our model results. Only the models with low star-forming efficiencies (colored lines) are still producing .
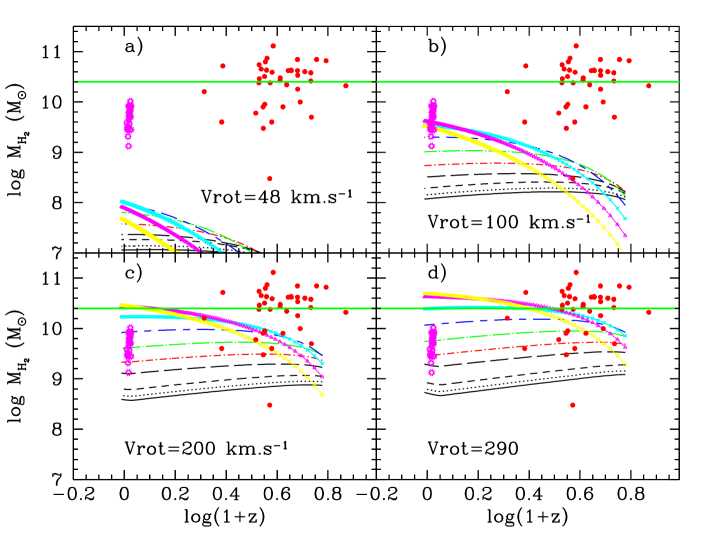
On the other hand, following that work sol05 , and taking into account the estimates for the star formation rate and molecular gas total mass, these objects might be bulges or starbursts in centrally concentrated disks, but not elliptical galaxies as it was initially assumed. Our models are also in agreement with this statement: the total mass of for the most massive spiral galaxies (with in the range 100-300 km.) and high star formation efficiencies () are always below of the EMGs data region since in those cases the molecular gas is very quickly consumed. Only the models for massive galaxies -panels c) and d) with the lowest efficiencies show values closer to the observations of EMG’s. At this high redshift, these particular models show star formation only at the central regions and therefore they would appear as concentrated disks, with a large quantity of .
3 The CO detection limits
Observation of emission from CO rotational transitions is the usual means of detecting interstellar molecular clouds.
CO is a very stable molecule and the most abundant after H2. Following com01 levels are the best ones to detect molecular gas at high redshifts.
In order to verify if our densities of molecular gas may be detected with ALMA, we need to transform the limiting flux for this instrument to a limit in gas density. The flux limit depends on the observed frequency. We take the highest value from the report ”Science with ALMA”, and we use Eq. 1 from sol05 , to calculate the minimum LCO necessary for detection. This luminosity is transformed into gas mass by using, as those authors, a constant conversion factor (which assumes independence of redshift ).
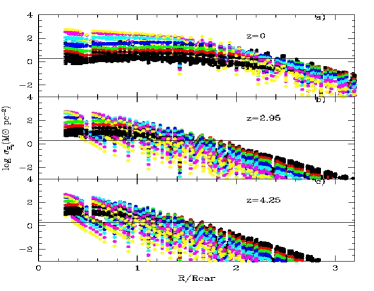
The result is shown as a thick line in Fig 3, where we show the expected radial distributions of molecular gas density normalized to a characteristic radius , taken as the half optical radius, for each total mass radial distribution. We show in top panel a) the results for (present time) while panels b) and c) represents the same models for the higher redshifts ( Gyr) and ( Gyr), respectively. For most modeled galaxies show distributions with values higher than the limiting value which may be detected with ALMA down to the optical radius, while for high redshifts only our inner disks, mainly of low efficiencies (colored) models, have a flux density sufficiently high to be detected. Therefore, if the red points of Fig. 2 would correspond to spiral galaxies, they must represent, effectively, their central parts.
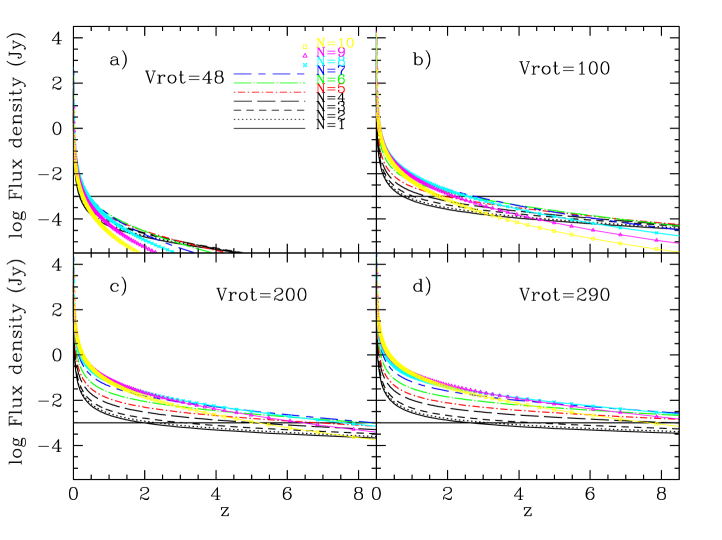
In Fig. 4 we represent the expected evolution of the flux density of CO lines as a function of , for an integrated galaxy, computed from the molecular gas density ) obtained from our models, transformed to fluxes by using the method outlined. The most massive galaxies -panel d- and those with high star formation efficiencies -black lines– maintain an almost constant density and flux density up to , with values just over the detection limits. Thus, such as we have before claimed, the most efficient galaxies in forming stars, which consume very quickly the molecular gas, are not the most probable objects to be detected. Those with low rotation velocities km.s-1, on the other hand, show increasing densities for decreasing z, having values lower than the limiting flux for . Only the massive galaxies km.s-1 with have fluxes above the observational limit even at . Therefore, the most plausible objects to be observed with ALMA will be the centers of low-intermediate efficiencies massive galaxies.
4 Conclusions
-
•
At redshift only the central regions of galaxies might be observed in CO with ALMA
-
•
EMGs are not necessarily the largest or the most massive stellar disks.
References
- (1) Bertram, T., Eckart, A., Krips, M., Straubmeier, C., Fischer, S., & Staguhn, J. G. 2006, New Astronomy Review, 50, 712
- (2) Combes, F. 2001, SF2A-2001: Semaine de l’Astrophysique Francaise, 237
- (3) Ferrini F., Matteucci F., Pardi C., Penco U., 1992, ApJ, 387, 138
- (4) Ferrini F., Mollá M., Pardi M. C., Díaz A. I., 1994, ApJ, 427, 745
- (5) Mollá M., Díaz A. I., 2005, MNRAS, 358, 521
- (6) Mollá, M., Ferrini, F., & Díaz, A. I., 1996, ApJ, 466, 668
- (7) Mollá, M., Ferrini, F., & Díaz, A. I., 1997, ApJ, 475, 519
- (8) Nishiyama, K. & Nakai, N., 2001, PASJ, 53, 713
- (9) Solomon, P. M., & Vanden Bout, P. A. 2005, ARA&A, 43, 677