Detection of M31 Binaries via High-Cadence Pixel-Lensing Surveys
Abstract
The Angstrom Project is using a distributed network of two-meter class telescopes to conduct a high cadence pixel-lensing survey of the bulge of the Andromeda Galaxy (M31). With the expansion of global telescope network, the detection efficiency of pixel-lensing surveys is rapidly improving. In this paper, we estimate the detection rate of binary lens events expected from high-cadence pixel-lensing surveys toward M31 such as the Angstrom Project based on detailed simulation of events and application of realistic observational conditions. Under the conservative detection criteria that only high signal-to-noise caustic-crossing events with long enough durations between caustic crossings can be firmly identified as binary lens events, we estimate that the rate would be per season, where is the fraction of binaries with projected separations of out of all lenses and is the rate of stellar pixel-lensing events. We find that detected binaries would have mass ratios distributed over a wide range of but with separations populated within a narrow range of . Implementation of an alert system and subsequent follow-up observations would be important not only for the increase of the binary lens event rate but also for the characterization of lens matter.
Subject headings:
gravitational lensing – galaxies: individual (M31)1. Introduction
Surveys to detect transient variations of stellar brightness caused by gravitation microlensing have been and are being conducted towards various star fields. These fields include the Magellanic Clouds (MACHO: Alcock et al. (2000), EROS: Afonso et al. (2003)), Galactic bulge (MACHO: Alcock et al. (2001), EROS: Hamadache et al. (2006), OGLE: Sumi et al. (2006), MOA: Bond et al. (2001)), and M31 (AGAPE: Ansari et al. (1999), POINT-AGAPE: Calchi Novati et al. (2005), VATT-Colombia: Uglesich et al. (2004), MEGA: de Jong et al. (2004), WeCAPP: Riffeser et al. (2003)). The number of lensing events detected so far from these surveys is about 3000. Most of these events were detected toward the Galactic bulge field and the number of events detected toward the Magellanic Cloud and M31 fields, which are several dozens toward the individual fields, have meager contributions to the total number of events. Towards the Magellanic Cloud field, the line of sight passes mainly through the halo of our Galaxy and thus the low detection rate is attributed to the scarcity of massive compact halo objects that can work as lenses (Alcock et al., 2000; Tisserand, et al., 2006). On the other hand, the line of sight toward M31 passes through the dense stellar region of M31 and thus the small number of detected stellar lensing events is mainly due to the low detection efficiency of the surveys.
With the expansion of global telescope network, however, the detection efficiency of M31 lensing surveys is expected to greatly improve. For example, a new M31 pixel-lensing survey, the Andromeda Galaxy Stellar Robotic Microlensing (Angstrom) Project111http://www.astro.livjm.ac.uk/angstrom/ will be able to achieve a monitoring frequency of observations per 24-hour period by using a network of telescopes, including the robotic 2m Liverpool Telescope at La Palma, Faulkes Telescope North in Hawaii, 1.8m telescope at the Bohyunsan Observatory in Korea, the 2.4m Hiltner Telescope at the MDM Observatory in Arizona, and 1.5m at the Maidanak Observatory in Uzbekistan. Intensive monitoring programs such as Angstrom are expected to detect events with a rate of per season (Kerins et al., 2006). Among them, a considerable fraction would be caused by binaries. Baltz & Gondolo (2001) pointed out that the rate of binary events relative to single lens events is higher in pixel-lensing because many of binary events involve caustic crossings during which the magnification is high and thus more detectable. In this work, we estimate the detection rate of binary lens events expected from a high cadence pixel-lensing survey toward M31 based on detailed simulation of events and application of realistic observational conditions.
The paper is organized as follows. In § 2, we describe basics of binary lensing. In § 3, we investigate the dependency of the detection efficiency on the binary lens parameters. In § 4, we estimate the event rate based on the simulation of M31 pixel-lensing events. We describe the details of the simulation and the criteria applied for the selection of binary events. We also investigate the characteristics of the binaries detectable from the survey. We end with a brief summary of the results and discussion in § 5.
2. Basics of Binary Lensing
General relativity predicts that a light ray passing by a stellar object is deflected. If a source star is gravitationally lensed by a binary lens, the equation of lens mapping from the lens plane to the source plane is expressed as
| (1) |
where , , and are the complex notations of the source, lens, and image positions, respectively, denotes the complex conjugate of , are the masses of the individual lens components, and is the total mass of the system (Witt, 1990). Here all lengths are normalized to the radius of the Einstein ring of the total mass of the system. The Einstein radius is related to the physical parameters of the lens system by
| (2) |
where and are the distances to the lens and source, respectively. Due to lensing, the source star image is split into several segments. For binary lensing, the number of images, , is either three or five depending on the source position with respect to the lens position. The lensing process conserves the source surface brightness and thus the magnifications of the individual images correspond to the ratios between the areas of the images and source. For an infinitesimally small source element, the magnification is
| (3) |
Then, the total magnification corresponds to the sum over all images, .
The main new feature of binary lensing compared to single lensing is the formation of caustics. Caustics are the set of positions in the source plane on which the magnification of a point-source event is infinite. The set of caustics form closed curves, which are composed of multiple concave line segments (fold) that meet at points (cusp). When the source enters the caustic curve, two new images appear and the number of images changes from three into five. Due to the divergent nature of the magnification near a caustic, the light curve during the caustic crossing of a binary lens event is characterized by a sharp spike. Since the caustic curve is closed, the number of caustic crossings is a multiple of two. The light curve between a set of two caustic crossings is characterized by its distinctive “U”-shape.
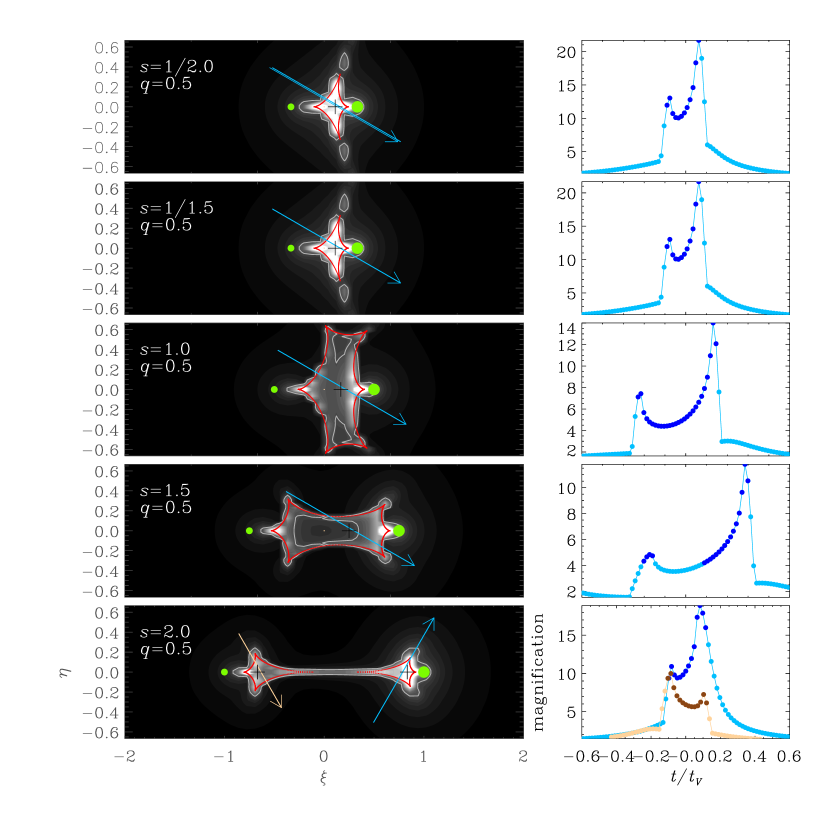
The number and shape of caustics vary depending on the separation, (normalized by ), and mass ratio, , between the two lens components. If the separation is substantially smaller than the Einstein radius, , there exist three sets of caustics. One big caustic is located close to the center of mass of the binary and the other two tiny ones are located away from the center of mass on the heavier lens side. If the separation is substantially larger than the Einstein radius, , on the other hand, there exist two sets of caustics. They are located close to the positions of the individual lens components but slightly shifted toward the lens component of the other side. The amount of the shift is
| (4) |
where is the position of the lens component on the same side of each set of caustics while and represent the mass fraction and position of the other lens component located on the opposite side, respectively (Di Stefano & Mao, 1996). If the binary separation is equivalent to the Einstein ring, , the caustic curve forms a single large closed figure with its center roughly at the center of mass of the binary. In Figure 1, we present the caustic pattern for various binary lenses with different separations. The dependence of the caustic size on the mass ratio is weak. As a result, the caustic size is not negligible even for an extreme case of a star-planet binary lens pair with . This makes microlensing an efficient method for planet searches (Mao & Paczyński, 1991).
3. Detection Efficiency
Due to the variation of the caustic characteristics depending on the binary lens parameters, the detection efficiency of binary lens events also depends on these parameters. In the section, we investigate the dependencies of the detection efficiency on the binary lens parameters.
We estimate the efficiency for an example M31 event. We choose a representative event based on the simulation of M31 pixel-lensing events conducted by Kerins et al. (2006). In the simulation, M31 matter density distribution is based on standard double-exponential disk plus triaxial bulge models. The velocity is modeled by an isotropic Maxwellian distribution. The mass function of lenses are modeled by a broken power-law represented by
| (5) |
where is a proportional constant. According to this simulation, the total number of events expected to be detected by the Angstrom survey is events per season over an area of of the M31 bulge field under the assumption that all lenses are composed of a single stellar component. Based on these events, we select a representative event as the one caused by a binary lens system with a primary lens mass of . The assumed distances to the source star and lens are kpc and kpc, respectively. For a representative value of the Einstein timescale (time needed for the source to transit the Einstein radius of the primary lens), we adopt days based on the simulation of Kerins et al. (2006). For the source star, we choose a giant with a brightness . We consider finite-source effects by adopting a source radius of . We assume an -band background brightness of . We let the mass ratio and separation between binary lens components vary as free parameters.
Once the lensing parameters are set, we then produce lensing events. Due to the high background flux level, detections of lensing events toward M31 field are limited only to those with high magnifications. In the background-dominated regime such as the M31 field, the signal-to-noise ratio of a pixel-lensing event is
| (6) |
where and represent the flux from the source and background, respectively, and represents the exposure time. If the threshold signal-to-noise ratio is , the threshold magnification and the corresponding normalized (by ) impact parameter of the source trajectory for event detection are defined respectively as
| (7) |
and
| (8) |
We, therefore, produce events with impact parameters of the source trajectory with respect to the effective single lens position, , less than the threshold value defined in equation (8) with an adopted threshold signal-to-noise ratio of , i.e. detection. The effective single lens position represents the location of a single lens at which the resulting single lensing light curve best describes the light curve of a binary lens event. For example, the light curve of an event caused by a close binary lens is well described by the light curve of a single lens event caused by a mass equal to the total mass of the binary located at the center of mass of the binary. In this case, the effective single lens position is the center of mass of the binary. For the case of a wide-separation binary, on the other hand, the individual lens components behave as if they are two independent single lenses located roughly at the centers of the individual sets of caustics, i.e. . In this case, there are two effective lens positions located at the center of the individual caustics.222We distinguish wide-separation binaries from close binaries if the caustic is divided into two pieces. In Figure 1, the effective single lens positions are denoted by cross marks for various cases of binary lenses. Once events are produced, we estimate the detection efficiency of binary lens events as the ratio of the number of events that can be firmly identified to be caused by binary lenses out of all produced events.
Light curves of events are produced under the following observational conditions. For the photometry, we assume that the instrument can detect 1 photon per second for an star following the specification of the Liverpool Telescope. The observation is assumed to be carried out such that small-exposure images are combined to make a 30 min exposure image to obtain a high signal-to-noise ratio while preventing saturation in the central bulge region. We assume that 5 such combined images are obtained per 24-hour period from the observations by using network telescopes. The photometry is done based on difference imaging (Alard & Lupton, 1998). The flux variation is assumed to be measured at an aperture that maximizes the signal-to-noise ratio of the measured flux variation. Under the assumption of a Gaussian point spread function, the optimal aperture that maximize the signal-to-noise ratio is (Kerins et al., 2006). We assume that the average seeing is . With the adoption of this aperture, the fraction of the source flux within the aperture is , where is the flux measured at .
We assume the following criteria for the identification of binary lens events. The light curves of binary events exhibit diverse patterns. In many cases, it is difficult to firmly distinguish light curves from those caused by single lenses or other types of source variability. Fortunately, a fraction of binary lens events involve caustic crossings and the characteristic features (e.g. spikes during caustic crossings and U-shape curve between caustic crossings) in the resulting light curves can be used to securely identify not only the lensing-induced variability but also the binary nature of lenses. We, therefore, restrict detectable binary events only to caustic-crossing events. For the confirmation of caustic crossings, we require events should have at least 5 data points with on the part of the light curve between caustic crossings. Considering that the assumed observation frequency is 5 times per day, this requirement is equivalent that source star should stay in the caustic at least for a day. We note that the data points with do not have to be consecutive.
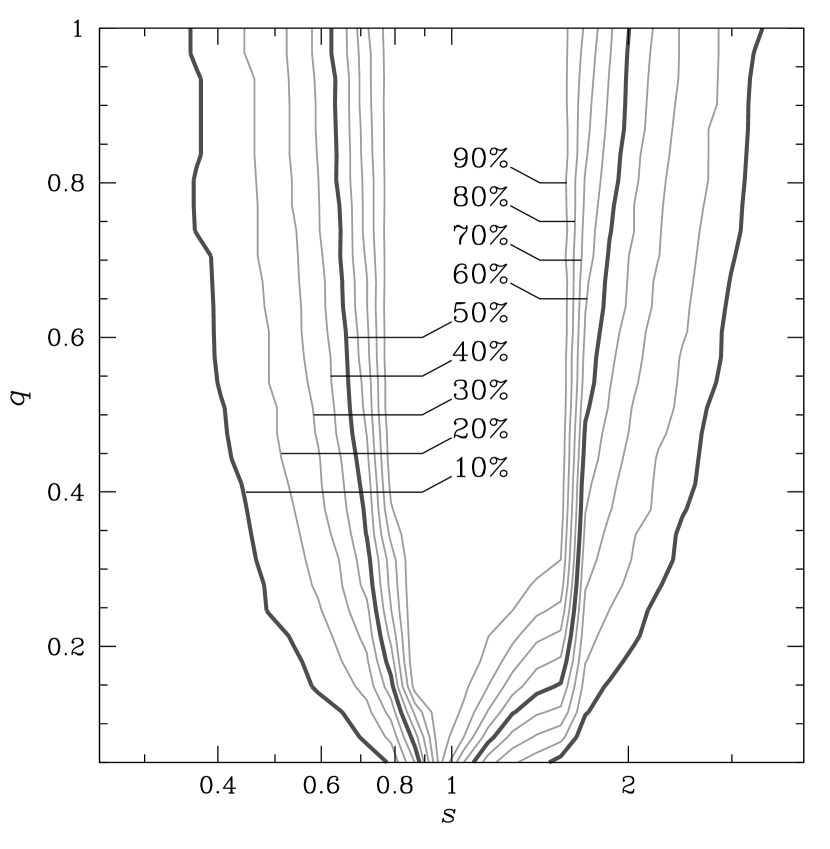
In Figure 2, we present the detection efficiency of binary pixel-lensing events toward the M31 bulge field as a function of the binary separation and mass ratio. From the figure, one finds that binaries with separations can be efficiently detected. Especially for binaries with separations very close to the Einstein radius, the efficiency is nearly 100%. One also finds that the dependency of the efficiency on the mass ratio is weak and thus detections can be extended to low-mass companions.
4. Binary-Lens Event Rate
Pixel-lensing events have diverse physical parameters. For the estimation of the binary event rate, then, convolution of the efficiency estimated for a specific event with distributions of the physical lens parameters is required.

The physical parameters involved with primary lens components are based on the simulation of Kerins et al. (2006) described in § 3. Once these parameters are set, we then set the parameters related to companions. Following Abt (1983), we model the binary separation as uniformly distributed in , i.e. . For the mass ratio distribution, we test three models. The first model is based on the assumption that the two masses of the binary components are drawn independently from the same mass function as that of single stars. This model is the natural result of binary formation process where binaries are formed through interactions between protostellar disks (Pringle, 1989) or some other form of capture. We refer to this model as the ‘capture’ model. Other possible mechanisms of binary formation are fission of a single star and fragmentation of a collapsing object. Numerical calculations suggest that the former process results in a mass ratio distribution peaking at around (Lucy, 1977), while the latter results in more equal masses (Norman & Wilson, 1978). We refer to these models as the ‘fission’ and ‘fragmentation’ models, respectively. We model the mass ratio distribution in the fission model as
| (9) |
The distribution of the fragmentation model is modeled as
| (10) |
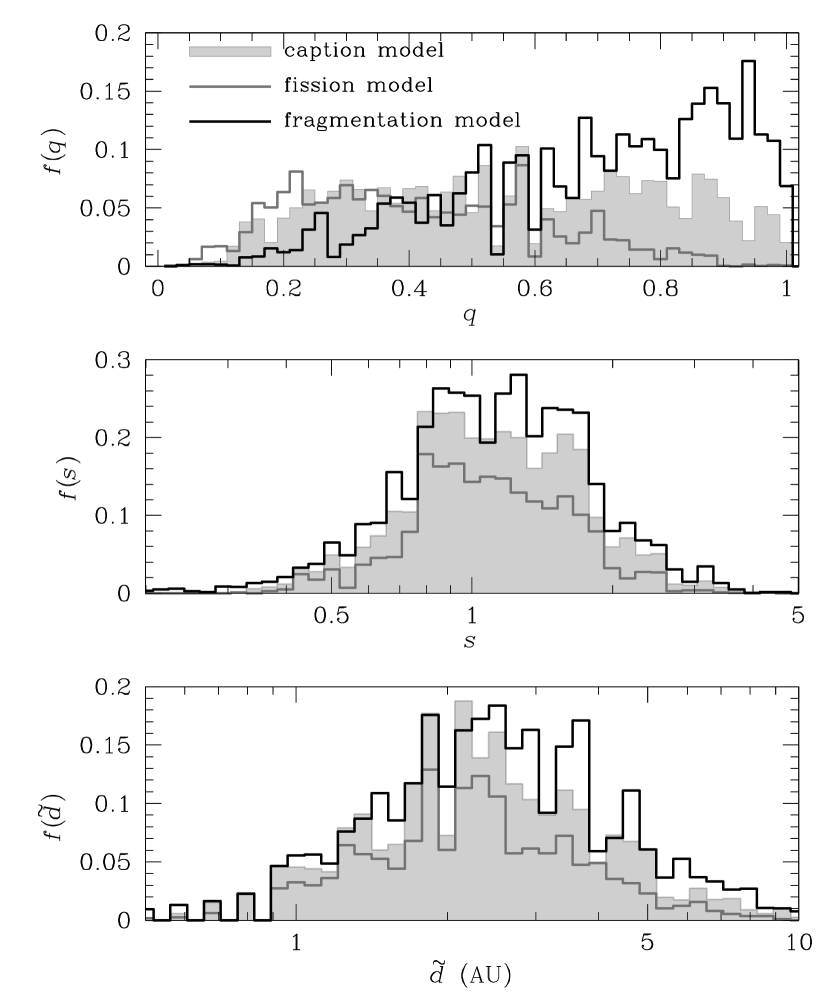
In Figure 3, we present the mass ratio distributions of the three tested models. In the capture and fragmentation models, the mass of the primary is drawn from the single lens mass function and the mass of the companion is determined based on the mass ratio derived from the mass ratio distribution. In the fission model, on the other hand, we set the total mass of the binary to be the same as that of a single lens because a single mass is split into two components of a binary in this model. Then, the total mass of the binary is drawn from the mass function of single lenses and the masses of the individual binary components are deduced from the mass ratio. As a result, the average mass of the binary lenses in the fission model is smaller than those in the capture and fragmentation models.
| mass ratio model | binary event rate |
|---|---|
| capture model | 12.0 events per season |
| fission model | 7.4 events per season |
| fragmentation model | 15.2 events per season |
Note. — Rates of binary lens events expected to be detected by a high-cadence pixel-lensing survey toward M31 field under three different models of binary mass-ratio distributions. The quantity represents the fraction of binaries with projected separations of out of all lenses.
In Table 1, we present the expected rates of binary lens events under three different models of binary mass ratio distribution. We note that the event rate is normalized so that it becomes 50 events per season if all lenses are composed of a single component following the estimation of Kerins et al. (2006). We find that the rate of binary lens events is – events per season, where is the fraction of binary lenses with projected separations of out of all lenses. By adopting a value of and considering the -month duration of M31 season (from August through to February), this rate roughly corresponds to events per month. We find that the dependence of the detection rate on the binary mass ratio distribution is such that the rate increases as more companions are populated in higher mass-ratio region. As a result, the rate becomes bigger in the order of the fission, capture, and fragmentation models. In Figure 4, we also present the distributions of mass ratios and separations (both normalized and physical separations) between the components of binary lenses. From the figure, we find that binaries to be detected by high-cadence pixel-lensing surveys will have mass ratios distributed over a wide range of . By contrast, separations of binaries will be populated within a narrow range of .
5. Discussion and Conclusion
We estimated the detection rate of binary lens events expected from high-cadence pixel-lensing surveys toward M31 such as the Angstrom Project based on detailed simulation of events and application of realistic observational conditions. Under the conservative detection criteria that only high signal-to-noise caustic-crossing events with long enough durations between caustic crossings can be firmly identified as binary lens events, we estimated that the rate would be per season, where is the rate of stellar pixel-lensing events. We found that detected binaries would have mass ratios distributed over a wide range of but with separations populated within a narrow range of .
The Angstrom survey is currently commissioning operation with a real-time data processing pipeline and a web-based transient and microlensing alert system (Darnley et al., 2007). Realization of the alert system and subsequent follow-up observations would greatly increase the observation frequency and thus overall event rate. Considering that a significant fraction of caustic crossing events are not detected from detections due to the short duration between caustic crossings, increasing the monitoring frequency from follow-up observations would be able to dramatically increase the binary event rate.
Follow-up observation of binary lens events would be important not only for the increase of the event rate but also for the characterization of lens matter. The majority of M31 pixel-lensing events are associated with giant stars with large angular radii. The large source size allows resolution of caustic crossings because the duration of the caustic crossing is proportional to the source radius, i.e.
| (11) |
where is the normalized source radius and is the incidence angle of the source trajectory with respect to the caustic curve. For a typical M31 pixel-lensing event with and days, the caustic-crossing duration is hours. Then, if events can be followed up with a frequency higher than once every hour, the caustic crossing can be resolved. Once the value of is known from the analysis of the light curve, one can estimate the Einstein radius with additional information of the source radius by . Since the Einstein radius is related to the physical parameters of the lens by the relation in equation (2), one can better constrain the nature of the lens.
References
- Abt (1983) Abt, H. A. 1983, ARA&A, 21, 343
- Afonso et al. (2003) Afonso, C., et al. 2003, A&A, 400, 951
- Alard & Lupton (1998) Alard, C., & Lupton, R. 1998, ApJ, 503, 325
- Alcock et al. (2000) Alcock, C., et al. 2000, ApJ, 542, 281
- Alcock et al. (2000) Alcock, C., et al. 2000, ApJ, 542, 281
- Alcock et al. (2001) Alcock, C., et al. 2001, ApJ, 557, 1035
- Ansari et al. (1999) Ansari, R., et al. 1999, A&A, 344, L49
- Baltz & Gondolo (2001) Baltz, E. A., & Gondolo, P. 2001, ApJ, 559, 41
- Bond et al. (2001) Bond, I. A., et al. 2001, MNRAS, 327, 868
- Calchi Novati et al. (2005) Calchi Novati, S., et al. 2005, A&A, 443, 911
- Darnley et al. (2007) Darnley, M. J., et al. 2007, ApJ, submitted
- de Jong et al. (2004) de Jong, J. T. A., et al. 2004, A&A, 417, 461
- Di Stefano & Mao (1996) Di Stefano, R., & Mao, S. 1996, ApJ, 457, 93
- Hamadache et al. (2006) Hamadache, C., et al. 2006, A&A, 454, 185
- Kerins et al. (2006) Kerins, E., Darnley, M. J., Duke, J. P., Gould, A., Han, C., Jeon, Y.-B., Newsam, A., & Park, B.-G. 2006, MNRAS, 365, 1099
- Lucy (1977) Lucy, L. B. 1977, AJ, 82, 1013
- Mao & Paczyński (1991) Mao, S., & Paczyński, B. 1991, ApJ, 374, L37
- Norman & Wilson (1978) Norman, M. L., & Wilson, J. R. 1978, ApJ, 224, 497
- Pringle (1989) Pringle, J. E. 1989, MNRAS, 239, 361
- Riffeser et al. (2003) Riffeser, A., Fliri, J., Bender, R., Seitz, S., & Gössl, C. A. 2003, ApJ, 599, L17
- Sumi et al. (2006) Sumi, T., et al. 2006, ApJ, 636 240
- Tisserand, et al. (2006) Tisserand, P., et al. 2006, A&A, submitted (astro-ph/0607207)
- Uglesich et al. (2004) Uglesich, R. R., Crotts, A. P. S., Baltz, E. A., de Jong J., Boyle, R. P., & Corbally, G. J. 2004, ApJ, 612, 877
- Witt (1990) Witt, H. J. 1990, A&A, 236, 311