H i study of extremely metal-deficient dwarf galaxies.
Abstract
Aims. The goal of this study is to measure parameters of the integrated H i emission for twenty-two dwarf galaxies with oxygen abundance 12+(O/H) in the range of 7.42 to 7.65, which are representatives of the eXtremely Metal-Deficient (XMD) galaxy group. Some of them are expected to be similar to the well-known candidates for local young galaxies, I Zw 18 and SBS 0335052 that have most of their baryon mass in the form of neutral gas. Therefore, the H i 21-cm line observations are crucial to understanding their group and individual properties.
Methods. The Nançay Radio Telescope (NRT) with the upgraded focal receiver was used for observations of the 21-cm H i-line. This permitted the detection of the faintest sources with rms of 1 mJy per 10.5 km s-1 resolution element.
Results. For eighteen detected galaxies we present the parameters of their integrated H i line emission and describe the data on individual objects in more detail. For four undetected XMD galaxies, we give upper limits on their (H i). For 70% of the twenty studied non-LSB (low surface brightness) XMD galaxies, we find evidence (both from H i and optical data) for their interaction with neighboring objects. In the brief discussion of the group H i properties of the observed subsample (the total O/H range is of 0.23 dex, or a factor of 1.7), we underline the broad distributions of the H i mass (range is of 2 orders of magnitude), of the ratio M(HI)/LB (of 1 order of magnitude), and of the blue luminosity (range is of 2 orders of magnitude). We also obtained H i parameters of six galaxies that do not belong to the XMD sample. As a by-product, we have detected an H i-object with V188 km s-1, which is probably a part of a new high-velocity H i cloud (HVC 234.3-16.8+208) near our Galaxy, in the direction of AM 0624–261.
Conclusions. These data increase the number of XMD galaxies with known integrated H i parameters (or upper limits) by a factor of two. This allows us to address statistical properties of this group, which will be presented in a forthcoming paper.
Key Words.:
galaxies: dwarf – galaxies: H i – galaxies: star formation – galaxies: abundances – radio lines: galaxies1 Introduction
The oxygen abundances in the great majority of actively star-forming low-mass galaxies (BCGs - blue compact and H ii galaxies) correspond to metallicities of (0.1–0.5) Z⊙111Updated Z⊙ corresponds to 12+(O/H) = 8.66, according to the recent data by Asplund et al. (Solar04 (2004)). (e.g., Terlevich et al. SCHG (1991); Izotov et al. Izotov92 (1992); Ugryumov et al. HSS-LM (2003); Kniazev et al. SHOC (2004); Salzer et al. Salzer05 (2005); Pustilnik et al. 2006c ; 2006b , among others). Some BCGs, due to their low metallicities, were originally considered as probable young galaxy populations. However, it has been shown that the great majority of BCGs contain a measurable number of old stars and thus, are old systems (e.g., Papaderos et al. Papa96 (1996); Doublier et al. Doub99 (1999); Cairos et al. Cairos03 (2003)). Only a few BCGs with the lowest known metallicities (12+(O/H) of 7.12–7.54, or Z = Z⊙/34 – Z⊙/13) of those with well studied deep photometry show no evidence for stellar populations older than one Gyr. They include I Zw 18 (Papaderos et al. Papa02 (2002); Izotov & Thuan 2004b ; Östlin & Mouhcine Ostlin05 (2005)); SBS 0335–052 E and W (Papaderos et al. Papa98 (1998); Pustilnik et al. 2004b ; Izotov & Thuan IT05W (2005)), Tol 65 (Papaderos et al. Papa99 (1999)), and probably DDO 68 (Pustilnik et al. 2005a ). These BCGs show an additional blue color excess and a luminosity excess, which are not accounted for by the color-metallicity (Guseva et al. 2003a ) and the luminosity-metallicity relations for other BCGs (e.g., Pustilnik et al. 2003a ; Kniazev et al. SDSS (2003)). In addition, they have very high gas mass-fractions = Mg/(Mg + Mstar): up to 0.95–0.99 (van Zee et al. vanZee98 (1998); Papaderos et al. Papa02 (2002); Pustilnik et al. 2004b ). These properties can be understood if these BCGs are young objects, with non-cosmological ages.
The number of known eXtremely Metal-Deficient (XMD, 12+(O/H) 7.65) galaxies has grown to 50 during the last decade thanks to dedicated searches, conducted mainly with objective prism surveys of Emission Line Galaxies (e.g., Izotov et al. Izotov92 (1992); Kniazev et al. Kniazev98 (1998); Melbourne & Salzer KISS (2004); Ugryumov et al. HSS-LM (2003)) and with spectroscopy of large number of faint galaxies from the Sloan Digital Sky Survey (SDSS, presented, e.g., by Kniazev et al. SDSS (2003, 2004) and Izotov et al. SDSS_DR3 (2006)). Such ‘unevolved’ objects comprise only a small fraction of known galaxies in the nearby Universe. Most of the known XMD galaxies are of the BCG type.
Different evolutionary scenarios can lead to very low metallicity of galaxy ISM. They include: a) the loss of metals due to superwinds related to powerful star formation (SF) events (e.g., Mac Low & Ferrara MLF99 (1999)); b) primordial gas inflow or intergalactic cloud accretion (e.g., Matteucci & Chiosi Matteucci83 (1983); Combes Combes05 (2005)); c) the very slow astration and related metal production, characteristic of conditions in some LSB galaxies (Low Surface Brightness – e.g., Legrand et al. Legrand00 (2000)), and finally, d) truly young galaxies in which the first SF episode took place less than 1 Gyr ago. In particular, for a few LSB dwarfs with sufficiently bright H ii regions the measurements gave very low values of 12+(O/H) of 7.3 to 7.5 (Ronnback & Bergvall Ronnback95 (1995); van Zee et al. vanZee96 (1996); van Zee vanZee00 (2000)). Several dwarf irregular galaxies (DIG) from the Local Volume were claimed as XMD objects long ago (e.g., Skillman et al. Skillman89 (1989)). The recent data confirmed the XMD classification for GR 8 and Leo A (van Zee et al. vanZee06 (2006)), DDO 53 (Pustilnik et al. 2003c ) and Sextans A and B (Kniazev et al. Sextans (2005)). All nearby XMD LSB dwarfs and DIGs studied with the Color-Magnitude Diagram (CMD) method appeared to have a substantial fraction of stars belonging to an old stellar population. Thus, they are old systems. In contrast to these “non-active” dwarfs, the CMD data for the second most metal-poor BCG I Zw 18 imply that it is probably a young galaxy (Izotov & Thuan 2004b ; Östlin & Mouhcine Ostlin05 (2005); this result has been questioned, however, by Momany et al. Momany05 (2005)). Therefore, low ISM metallicity is a necessary but not sufficient property to assign an object as a candidate for a young galaxy.
The high- dwarf galaxies are near still or below the limit of detectability with the most powerful instruments (e.g., Pello et al. Pello05 (2005); Yan et al. Yan05 (2005); Bouwens & Illingworth BI2006 (2006)). Local XMD galaxy properties are similar to those of young dwarf galaxy populations at high redshift, so their detailed study is an effective way to probe early galaxy evolution. Since the cold/warm gas should be the main component of baryonic matter in unevolved galaxies, the 21-cm H i line is one of the primary means to study their properties.
Our multi-wavelength study of the XMD galaxy sample includes long-slit spectroscopy, optical/NIR imaging, photometry, and H i 21-cm spectral observations. We present the measurements of integrated H i parameters for 22 galaxies with 12+(O/H) = 7.42–7.65 here. These data are used for H i mapping of some XMD galaxies at the Giant Meterwave Radio Telescope (GMRT, India). In Sect. 2 we describe the sample. Observations and data reduction are described in Sect. 3. The results are presented in Sect. 4. In Sect. 5 we discuss the results and draw preliminary conclusions. The analysis of 40 XMD galaxies with available H i data is deferred to a forthcoming paper.
2 The sample
The list of XMD galaxies was compiled by Kunth & Östlin (KO (2000), hereafter KO). A significant number of new XMD galaxies was added in the recent papers cited below. Metallicities of the galaxies from the KO list, based on old, lower accuracy determinations, were revisited, and four of them were excluded from the XMD group (Kniazev et al. Kniazev01 (2001); Pustilnik et al. 2002a ).
Three of the 22 galaxies are well known. AM 0624–261 is classified as a blue LSB galaxy (Ronnback & Bergvall Ronnback94 (1994), Ronnback95 (1995)). Two others - Tol 21 and Tol 65 are BCGs from the Tololo survey (Masegosa et al. Masegosa94 (1994); Thuan & Izotov TI97 (1997); Papaderos et al. Papa99 (1999); Fricke et al. Fricke01 (2001), and references therein). For these three, only AM 0624–261 has published H i data (S/N 4, Gallagher et al. Gallagher95 (1995)). The remaining 19 galaxies were found recently as XMD objects. Seven of them are from the HSS sample (Kniazev et al. Kniazev98 (1998); Pustilnik et al. HSS-2 (1999); 2006b ), four are from the HSS-LM sample (Ugryumov et al. HSS-LM (2003); Pustilnik et al. 2006a ), and one is from the SBS sample (Izotov & Thuan IT99 (1999)). Six more galaxies were found in the SDSS (Kniazev et al. SDSS (2003)). One galaxy is from the KISS sample (Lee et al. Lee04 (2004)).
No data on H i parameters of these galaxies were known in the period of our NRT observations, except for HS 0122+0743 and SDSS J1121+0324. The former was suggested as a probable merger, so we tried to find some additional indications in its H i profile. The latter was serendipitously detected in H i at the VLA by Hibbard & Sansom (Hibbard03 (2003)). The main parameters of all observed galaxies with references to the sources are shown in Table 1. Some -magnitudes were derived from the photometry presented in the Sloan Digital Sky Survey (SDSS) Data Release 4 by Adelman-McCarthy et al. (DR4 (2006)), with the use of the transformation equation from and magnitudes as given by Smith et al. (Smith02 (2002)).
| IAU style | Other | Type | Coord. (2000.0) | Angul. | Vopt | ∗ | O/H† | Alternative | ||
| name | name or | R.A. | Dec. | sizea | km s-1 | mag | mag | name | ||
| prefix | h m s | ∘ ′ ′′ | a | |||||||
| (1) | (2) | (3) | (4) | (5) | (6) | (7) | (8) | (9) | (10) | (11) |
| 0017+1055 | HS | BCG | 00 20 21.35 | +11 12 20.7 | … | 563030 | 18.21 | –16.7 | 7.63 | |
| 0122+0743 | HS | IP | 01 25 34.18 | +07 59 22.2 | 5930 | 292630 | 15.51 | –17.7 | 7.63 | UGC 993 |
| J0133+1342 | SDSS | BCG | 01 33 52.56 | +13 42 09.4 | … | 259920 | 18.15 | –14.4 | 7.60 | |
| J0205–0949 | SDSS | SmPec | 02 05 49.13 | –09 49 18.1 | 9648 | 190818 | 15.55 | –16.6 | 7.60 | KUG 0203-100 |
| 0624–261 | AM | LSB | 06 26 16.99 | –26 15 56.3 | 4926 | 49517 | 16.01 | –12.5 | 7.49 | ESO 489-056 |
| 0846+3522 | HS | BCG | 08 49 40.26 | +35 11 39.2 | … | 217727 | 18.15 | –14.6 | 7.65 | |
| 0937+2949 | KISSB23 | dIrr | 09 40 12.85 | +29 35 28.8 | 3612 | 54311 | 16.33 | –13.6 | 7.65 | KUG 0937+298 |
| 0940+4025 | HS | BCG | 09 43 36.34 | +40 11 18.1 | … | 531040 | 18.55 | –16.0 | 7.61 | |
| 1013+3809 | HS | BCG | 10 16 24.59 | +37 54 44.5 | … | 118520 | 16.05 | –15.4 | 7.59 | KUG 1013+381 |
| 1033+4757 | HS | BCG | 10 36 25.11 | +47 41 52.3 | … | 154121 | 17.75 | –14.3 | 7.65 | |
| 1059+3934 | HS | BCG | 11 02 09.81 | +39 18 45.3 | … | 299570 | 17.25 | –16.1 | 7.62 | |
| J1105+6022 | SDSS | BCG | 11 05 53.62 | +60 22 28.5 | 3018 | 134020 | 16.65 | –15.1 | 7.62 | SBS 1102+606 |
| J1121+0324 | SDSS | BCG | 11 21 52.80 | +03 24 21.2 | 4312 | 122338 | 16.95 | –14.6 | 7.62 | |
| J1201+0211 | SDSS | BCG | 12 01 22.32 | +02 11 08.5 | … | 98620 | 17.94 | –13.5 | 7.54 | |
| 1159+545 | SBS | BCG | 12 02 02.36 | +54 15 50.1 | … | 353740 | 18.75 | –14.9 | 7.49 | |
| J1215+5223 | SDSS | LSB | 12 15 46.56 | +52 23 13.9 | 7240 | 16215 | 15.45 | –12.9 | 7.42 | CGCG 269–049 |
| 1214–277 | Tol | BCG | 12 17 17.09 | –28 02 32.6 | … | 779550 | 18.46 | –16.9 | 7.54 | Tol 21 |
| 1223–359 | Tol | BCG | 12 25 46.96 | –36 14 00.6 | … | 281130 | 17.67 | –15.6 | 7.54 | Tol 65 |
| 1442+4250 | HS | BCG | 14 44 11.35 | +42 37 34.7 | 6012 | 66015 | 15.68 | –14.9 | 7.63 | UGC 9497 |
| 1704+4332 | HS | BCG | 17 05 45.39 | +43 28 48.9 | … | 207612 | 18.48 | –14.5 | 7.55 | |
| 2134+0400 | HS | BCG | 21 36 58.95 | +04 14 04.1 | … | 507050 | 19.31 | –15.1 | 7.44 | |
| 2236+1344 | HS | BCG | 22 38 31.15 | +14 00 28.6 | … | 616020 | 17.91 | –16.9 | 7.50 | |
| 1059+395 | KUG | BCG | 11 02 00.14 | +39 19 06.4 | … | 306760 | 16.63 | –16.8 | 8.11 | |
| 1102+6038 | MCG | LSB | 11 05 34.05 | +60 22 06.6 | 5734 | – | 16.5:5 | –15.1 | MCG+10-16-056 | |
| J1106+6015 | MCG | dIrr | 11 06 47.99 | +60 15 46.8 | 5117 | 1273 3 | 16.35 | –15.3 | MCG+10-16-062 | |
| J1202+0215 | LSB/dI | 12 02 20.94 | +02 15 58.5 | … | – | 18.85 | – | |||
| 1342+4210 | HS | BCG | 13 44 59.49 | +41 55 05.4 | … | 378050 | 18.35 | –15.5 | 7.78 | |
| 2236+136 | KUG | GPair | 22 39 21.95 | +13 52 55.8 | … | 518415 | 15.45 | –19.0 | ||
| () – In units 12+(O/H). Data are from Ronnback & Bergvall (Ronnback95 (1995)); Lee et al. (Lee04 (2004)); Kniazev et al. (1998); | ||||||||||
| Kniazev et al. (SDSS (2003)); Fricke et al. (Fricke01 (2001)); Guseva et al. (2003b ), Pustilnik et al. (2006a ), Pustilnik et al. (2006b ); | ||||||||||
| () – Photometric data are from: 1 Pustilnik et al. in prep.; 2 Ronnback & Bergvall (Ronnback94 (1994)); 3 Salzer et al. (KISSB_02 (2002)); 4 Kniazev | ||||||||||
| et al. (SDSS (2003)); 5 SDSS DR4; 6 Fricke et al. (Fricke01 (2001)); 7 Papaderos et al. (Papa99 (1999)); 8 Gil de Paz et al. (GM03 (2003)) | ||||||||||
| (a) – Optical diameters (in , measured at the 25 -mag. arcsec-2 level); | ||||||||||
| (∗) – Corrected for AB according to Schlegel et al. (Schlegel98 (1998)) and with the distances from Table 2. | ||||||||||
3 Observations and reduction
The H i-observations with the
Nançay222The Nançay Radioastronomy Station is part of the
Observatoire de Paris and is operated by the Ministère de l’Education
Nationale and Institut des Sciences de l’Univers of the Centre National
de la Recherche Scientifique.
radio telescope (NRT) with a collecting area of
20034.5 m are characterized by a half-power beam width (HPBW) of
3.7′ (East-West) 22′ (North-South) at
declination =0∘
(see also http://www.obs-nancay.fr/nrt).
The data were acquired during the years 2002–2004. We used
the new antenna/receiver system F.O.R.T. (e.g., Granet et al. Granet97 (1997);
Martin et al. FORT (2002)) with improved overall sensitivity.
The system temperature was 35 K for both the horizontal and vertical
linear polarizations of a dual-polarization receiver.
The gain of the telescope was 1.5 K Jy-1 at declination
=0∘.
The new 8192-channel correlator was used
covering a total bandwidth of 12.5 MHz. The total velocity range covered
was about 2700 km s-1, with the channel spacing of 1.3 km s-1 before smoothing.
The effective resolution after averaging of four adjacent channels and
Hanning smoothing was 10.5. km s-1.
The observations consisted of separate cycles of ‘ON’ and ‘OFF’ integrations,
each of 40 seconds in duration. ‘OFF’ integrations were acquired at the
target declination, usually with the East R.A. offset of
15′ . For a few cases, when we clearly
suspected confusion from a galaxy near an ‘OFF’ position, we selected a
different ‘OFF’ position to avoid possible confusion.
For the flux calibration we used a noise diode. Its power was regularly monitored throughout the observations by pointing at known continuum and line sources. The comparisons of our measured fluxes with independent measurements of the same objects by other telescopes indicates the consistency of the flux scale to within 10%.
With an rms noise of 1 to 7 mJy per resolution element after smoothing (10.5 km s-1), we obtained a S/N ratio of 30–40 for the HI line peak flux densities of the brightest detected objects, while for the faintest ones we had detections with a S/N ratio of 3–4. Total integration times per galaxy (‘ON’+‘OFF’) varied between 1 and 10 hours. For four of the twenty-two observed XMD galaxies, we obtained only upper limits on their , and estimated limits on their integrated H i flux.
The data was reduced using the NRT standard programs NAPS and SIR, written by the telescope staff (see description on http://www.obs-nancay.fr/nrt/support). Horizontal and vertical polarization spectra were calibrated and processed independently and then averaged together. The error estimates were calculated following Schneider et al. (Schneider86 (1986)). The baselines were generally well-fit by a third order or lower polynomial and were subtracted out. For a few nearby extended galaxies with an angular size comparable to the NRT horizontal HPBW, a correction for resolution of the observed H i flux has been done. Having no information on the H i spatial distribution, we used the galaxies’ optical sizes and followed the procedure described by Thuan et al. (Thuan99 (1999)). The latter takes into account the statistical relation between the BCGs’ optical size and their characteristic size in H i.
4 Results and preliminary analysis
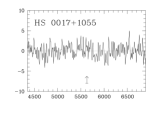
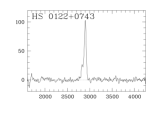
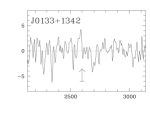
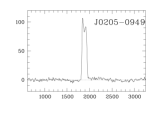
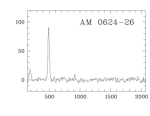
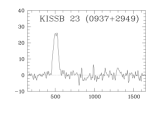
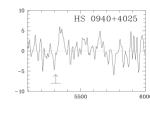
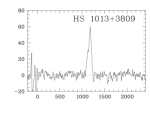
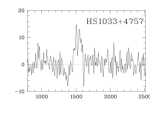
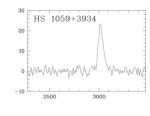
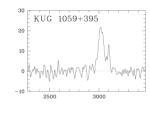
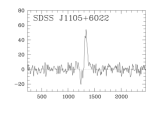
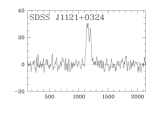
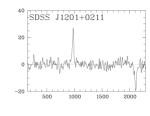
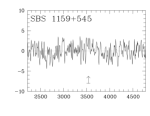
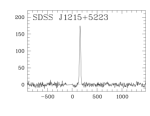
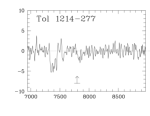
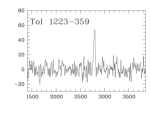
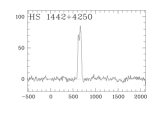
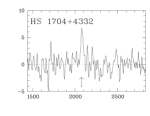
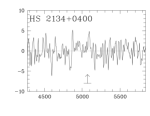
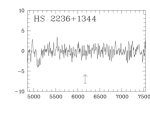
The H i-profiles of the studied galaxies, smoothed to 10.5 km s-1 are shown in Fig. 1. The related parameters are presented in Table 2. The velocity profiles show significant diversity in form and width. They are described individually in more detail below. In Sect. 5 we briefly discuss some properties of the observed galaxies as a group.
In Table 2 we present the following data. In Col. (1) – the galaxy IAU type name. In Col. (2) - the central heliocentric velocity of the H i-profile, derived as the mid-point of profiles at 50% of the peak, with its rms uncertainty. The related estimate of the distance, given in Col. (3), follows that of Karachentsev et al. (Kara04 (2004)) for their Catalog of Neighboring Galaxies, with the adopted value of H0 = 72 km s-1 Mpc-1. The observed widths of H i-profiles at the levels of 50 and 20 % of the peak value with their r.m.s. errors are given in Cols. (4) and (5). Column (6) gives the observed H i flux (the area under the profile). The errors for the values in Cols. 4, 5, and 6 are calculated similarly to the method suggested by Schneider et al. (Schneider86 (1986)). Where it is appropriate, we show in Col. (7) H i flux, corrected for the beam resolution. The respective formula (see below) was discussed in detail, e.g., by Thuan et al. (Thuan99 (1999)). The correction for source extension in the north-south direction is negligible since the NRT vertical beam (FWHM = 22′) is much larger than the largest size of any of the target galaxies. The correction for extension in the east-west direction (for NRT beam of 37) is necessary for some of the targets with optical diameters larger than 05. We follow the work by Thuan & Martin (TM81 (1981)), and assume that neutral gas in these galaxies is distributed like an elliptical Gaussian. Then:
Fc = FH 1 + (a2 sin2 PA + b2 cos2 PA / ]1/2,
where and are the FWHM diameters (in arc minutes) of the assumed elliptical distribution of H i, which are adopted for BCGs/H ii galaxies (following Lee et al. Lee02HI (2002)) as 2.0 times of the optical sizes and in Table 1. PA is the position angle of the major axis, and is the HPBW of the Nançay telescope in the East-West direction. In Col. 8 we present the logarithm of the total H i mass in solar units, derived according to the well-known formula below.
= 2.36 105 Fc ,
where MHI is in ⊙, Fc is the object’s integrated flux in Jy km s-1, and is the distance to the object in Mpc. Finally, in Col. 9 we show the ratio M(HI)/LB (in solar units, MB⊙ = 5.48, or LB⊙ = 2.121033 erg s-1), where M(HI) is from Col. 8, and LB corresponds to the absolute magnitude MB from Table 1.
Besides the target galaxies, we detected H i emission from several galaxies appearing either in the ‘ON’ beam, or in the ‘OFF’ beam at the radial velocities outside the uncertainty ranges for target galaxies. We examined the respective sky regions in NED and for many cases found a candidate galaxy that probably appeared in our H i spectrum. Their observed H i fluxes, corrected for the offset attenuation, are given in Col. 7. Below we give more details on the H i emission of individual galaxies from this program, as well as other information related to the discussion of their properties in Sect. 5.
4.1 HS 01220743 = UGC 993
This object is considered by some authors as a galaxy pair. Its morphology indeed suggests that we are witnessing merging of the E and W components, which seem already to be in contact. We aimed to find more evidence for two different components in its H i profile and probable high-velocity tails. Previous H i observations with a lower S/N ratio (Garcia et al. Garcia94 (1994); Lu et al. Lu93 (1993)) indicated the separate faint component in the H i profile with = –90 km s-1 relative to that of the main emission. There was a hint in the Lu et al. (Lu93 (1993)) profile of the very low contrast broad velocity component. In our profile, the fainter component with = –75 km s-1, W35 km s-1 is well detected, but no broad component is visible. The width of the H i profile of this object (W50=50 km s-1) is rather narrow for its high neutral gas mass (M(H i)=2.7109 M⊙). According to the optical morphology of this system, the narrow profile is probably not due to the object being seen close to face-on. The recent GMRT H i mapping of this system shows clear evidence of merging in this XMD object.
4.2 SDSS J01331342
The galaxy is marginally detected in H i. Its narrow H i profile is consistent with its low optical luminosity and a small H i mass. On the DSS-2 image this galaxy is compact (maximum extent is 16″ or 3 kpc), with a bright central knot. Its morphology is very disturbed. The galaxy is almost connected by a bridge to a 3.5-mag (in -band) fainter reddish galaxy at 13″ N, and looks like a merging system.
4.3 SDSS J02050949 = KUG 0203100
This object has a double-horn profile, typical of disk galaxies, with W20, corresponding to the rotation velocity amplitude of 70 km s-1, which is consistent with its optical classification in NED as SB(s)m pec. Optical morphology, especially in the outer parts, is rather disturbed, suggesting significant interaction. The disk is warped on both edges. A potential candidate for a disturber is a LSB galaxy, 35 fainter (with 12.5 if at the same distance), at 14 SW (11.5 kpc in projection). This galaxy is the only candidate within the NRT beam that might be responsible for a hint of emission in the H i profile at +100 km s-1.
The total magnitude of SDSS J02050949 (as recalculated from its SDSS photometry) is 1546 (not =1838, as in Kniazev et al. SDSS (2003); the latter is likely based on the light picked up by an optical fiber of only 3″ aperture, thus missing a lot of the light). With its absolute magnitude of 16.64, it is somewhat bright for a galaxy with such a low metallicity. While it could be an analog of the luminous XMD BCG HS 0837+4717 (Pustilnik et al. 2004a ), it is worth noting that its cited uncertainty of O/H (0.09 dex) is quite large. Hence, its XMD classification should be confirmed with higher quality spectral data. It is worthwhile noting the high ratio M(HI)/LB=2.57, which is the second highest in this sample.
4.4 AM 0624–261 = ESO 489-056
The first H i detection for this LSB galaxy was presented by Gallagher et al. (Gallagher95 (1995)) with the nominal S/N ratio of 4.3. We achieved an S/N ratio of 36. All but one of the profile parameters of the old and new data are consistent. Only the integrated H i-flux is higher on our data by a factor of 1.35. The most reasonable explanation of this difference is the rather low S/N ratio of the old data. The measured = 27 km s-1 (after smoothing to 5.2 km s-1) translates (according to Staveley-Smith et al. Staveley92 (1992), with the adopted isotropic velocity dispersion 10 km s-1) to the disk maximal rotation velocity of 8 km s-1. An inclination correction is applied for (Ronnback & Bergvall Ronnback94 (1994)). The total H i mass of this galaxy of 1.6107 M⊙ is the lowest in this subsample. However, this is compatible with what one expects for its very low blue luminosity, which is also the lowest in the subsample. The ratio (H i)/ = 0.85 is typical of LSB galaxies (Schombert et al. SME01 (2001)). We detect an additional H i source, seen at Vr sufficiently close to that of the Milky Way. It is discussed in Sect. 5.3 as a possible high-velocity cloud (HVC).
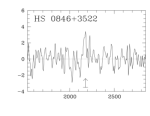

4.5 HS 0846+3522
This galaxy is detected near the correct optical velocity of 2177 km s-1 with a S/N ratio of only 3.4. Its velocity in the discovery paper (Pustilnik et al. HSS-2 (1999)) is mistaken due to a misprint (given as 2481 km s-1 instead of the correct value of 2184 km s-1). Parameters presented in Table 2 have uncertainties of 50%. HS 0846+3522 has a disturbed morphology on the DSS-2 images, probably due to interaction with an irregular galaxy at 50″ NEE (7 kpc in projection, -mag 19.6 from SDSS). Its redshift is unknown.
4.6 KISSB 23 = KUG 0937+298
This galaxy is situated at 6 Mpc, in the inner rim region of the nearby Lynx-Cancer void described in Pustilnik et al. (2003b ). Two more XMD galaxies are found within the same void (Pustilnik et al. 2003b ; 2005a ). While the blue luminosity of KISSB 23 is only a factor of 2.8 higher than that of AM 0624–261, this galaxy, with a similar H i mass has a significantly broader H i profile: 70 km s-1. Even for an edge-on case this translates to an amplitude of (according to Staveley-Smith et al. Staveley92 (1992)) of about 35 km s-1 in comparison to 8 km s-1 for AM 0624–261. Despite having similar parameters of Lopt and M(H i), KISSB 23 is significantly more DM dominated than AM 0624–261. This is related to the enhanced stability of its ISM to local intrinsic perturbations. However, this galaxy shows enhanced SFR. The EW(H) of its bright non-central knot of 30 Å (Lee et al. Lee04 (2004)), for the adopted metallicity of =0.001 corresponds to an age of an instantaneous starburst of 10 Myr (Leitherer et al. Starburst99 (1999)). The origin of such a non-central SF “burst” is unclear. The possibility of a trigger by an external perturber can be investigated through H i mapping of this galaxy. Its ratio (H i)/ = 0.98 is rather high for dIrr galaxies.
4.7 HS 0940+4025
This galaxy is marginally detected (S/N ratio of 2.5), so its parameters have large uncertainties. The object is very compact and elongated, with the total extent on the DSS-2 9″ (3 kpc). The SDSS image shows two very blue knots almost in contact (3″ separation), very similar in appearance to HS 2236+1344, for which there are clear indications of a merger. The same can be attributed to HS 0940+4025. Thus, more detailed study of this BCG is necessary. For its rather small profile width (50 km s-1), this galaxy has one of the largest (H i), only a factor of 2.5 lower than that of the outstanding XMD BCG Tol 65.
4.8 HS 1013+3809 and UGC 5540
This BCG presumably comprises a physical pair with a 23 brighter () Sc galaxy UGC 5540 at 8′ to the South and 05 to the West (in total 50 kpc in projection). The latter was observed in the H i line with the 91 m Green Bank (hereafter GB) telescope and the NRT (Haynes & Giovanelli HG91 (1991); Theureau et al. KLUN7 (1998)). Taking into account the confusion of the two galaxies in the NRT beam, some useful estimates of the integrated H i flux of HS 1013+3809 can be obtained. If we account for flux attenuation due to an offset of UGC 5540 from the NRT pointing, we can estimate from the observed flux the residual that should be attributed to the H i emission related to HS 1013+3809. In particular, the value of its H i mass can be derived.
The two cited measurements of UGC 5540 ((H i,GB)= 5.370.56 and (H i,NRT) = 6.201.20 Jy km s-1) are not significantly different. However, the 0.83 Jy km s-1 higher value of the NRT flux, in comparison to that measured at GB, may indicate some contribution from HS 1013+3809 to the pointing toward UGC 5540. Due to the narrower beam for GB, this is not the case for (H i,GB). Therefore, for further analysis we accept that the correct (H i) of UGC 5540 is given by GB data. Taking into account the attenuation factor (of 0.655) due to the pointing offset between the two galaxies, the expected contribution from UGC 5540 at this position is (H i) = 3.520.37 Jy km s-1. (H i) = 3.230.34 Jy km s-1 when the horizontal NRT beam resolution effect on the extended H i emission of UGC 5540 is applied. Subtracting this expected flux from the measured value of 4.740.19 Jy km s-1, we estimate the flux for HS 1013+3809 of (H i)=1.510.39 Jy km s-1. The derived value is consistent with the NRT measured flux of UGC 5540. Indeed, the contribution of HS 1013+3809 at the NRT pointing to UGC 5540 will be 0.990.25, and after addition with (H i)=5.370.56 for UGC5540 from GB data results in 6.360.61, very close to the NRT measured value of 6.20 Jy km s-1. The estimated flux of HS 1013+3809 comprises only 32% of the measured H i flux. To resolve this galaxy pair in H i requires mapping with a beam-width of 1′.
4.9 HS 1033+4757
This very compact and low luminosity galaxy has a bright knot that is somewhat displaced from the center of the main body. The outer morphology is irregular with many filaments. Its H i profile is rather broad and asymmetric, suggesting possible confusion. We have checked all sufficiently bright galaxies falling within the main NRT beam. All those for which there are SDSS spectra appeared as background objects.
| IAU name | V(HI) | Dist.1 | W50 | W20 | FH | Fc | Log(M(HI) | M(HI)/LB |
| km s-1 | Mpc | km s-1 | km s-1 | Jy km s-1 | Jy km s-1 | M⊙ | M⊙/L⊙ | |
| (1) | (2) | (3) | (4) | (5) | (6) | (7) | (8) | (9) |
| 00171055 | 563030 | 81.3 | 50 | … | 0.20 | 8.29 | 0.39 | |
| 01220743 | 2899 5 | 42.3 | 50 6 | 12316 | 6.700.26 | 7.600.30 | 9.47 | 1.48 |
| J01331342 | 2580 4 | 38.1 | 33 7 | 3911 | 0.100.05 | 7.54 | 0.23 | |
| J02050949 | 1885 1 | 26.8 | 112 1 | 133 2 | 11.070.19 | 12.190.22 | 9.35 | 2.57 |
| 0624261 | 491 1 | 5.0 | 27 1 | 42 2 | 2.690.08 | 2.790.08 | 7.22 | 0.85 |
| 08463522 | 2169 3 | 29.6 | 33 6 | 4010 | 0.100.03 | 7.32 | 0.24 | |
| 09372949 | 505 2 | 6.0 | 7710 | 9815 | 1.950.24 | 2.050.25 | 7.24 | 0.98 |
| 09404025 | 5353 8 | 74.2 | 4016 | 5324 | 0.200.08 | 8.42 | 0.70 | |
| 10133809 | 1169 4 | 15.8 | 86 7 | 13012 | 4.740.19 | 1.510.39 | 7.90 | 0.57 |
| 10334757 | 1541 9 | 21.8 | 86 7 | 14429 | 1.320.15 | 8.02 | 2.32 | |
| 10593934 | 3019 3 | 41.9 | 59 6 | 91 9 | 1.390.06 | 8.60 | 1.54 | |
| J11056022 | 1333 3 | 19.9 | 48 6 | 7410 | 2.400.17 | 2.480.18 | 8.36 | 1.62 |
| J11210324 | 1171 3 | 17.0 | 89 6 | 11210 | 2.490.15 | 2.670.16 | 8.29 | 1.94 |
| J12010211 | 974 3 | 17.0 | 29 7 | 5310 | 0.960.09 | 7.82 | 1.92 | |
| 1159545 | 356015 | 50.3 | … | … | 0.10 | 7.72 | 0.43 | |
| J12155223 | 158 1 | 4.2 | 27 1 | 43 2 | 5.140.14 | 5.240.16 | 7.34 | 1.01 |
| 1214277 | 779550 | 105.8 | … | … | 0.10 | 8.42 | 0.28 | |
| 1223359 | 2790 3 | 36.3 | 40 6 | 56 9 | 2.130.24 | 8.82 | 2.70 | |
| 14424250 | 647 1 | 10.6 | 85 2 | 99 2 | 6.370.14 | 7.050.16 | 8.24 | 1.77 |
| 17044332 | 2082 8 | 31.9 | 3315 | 5924 | 0.240.05 | 7.76 | 0.75 | |
| 21340400 | 5090 4 | 73.9 | 25 9 | 3314 | 0.120.05 | 8.19 | 0.76 | |
| 22361344 | 616020 | 89.1 | 50 | … | 0.15 | 8.35 | 0.25 | |
| HI06242614 | 188 2 | 0.02 | 37 5 | 58 7 | 0.770.06 | 1.86 | ||
| 1059395 | 3023 5 | 41.9 | 6210 | 10116 | 1.380.09 | 8.59 | 0.86 | |
| 11026038 | 1265 8 | 19.0 | 43 9 | 7015 | 2.300.17 | 2.580.19 | 8.34 | 1.52 |
| J11066015 | 1252 8 | 19.0 | 57 9 | 8015 | 2.100.18 | 8.25 | 1.02 | |
| J12020215 | 2107 8 | 27.1 | 3316 | 7624 | 0.830.10 | 0.970.12 | 8.23 | 4.5: |
| HIJ12182801 | 7392 3 | 100.2 | 117 6 | 12710 | 0.460.06 | 9.04 | ||
| 13424210 | 385021 | 54.6 | 7042 | 12067 | 0.400.10 | 8.32 | 1.21 | |
| 2236136 | 512210 | 75.8 | 10516 | 12025 | 0.300.08 | 0.630.17 | 8.91 | 0.15 |
| 1 – Distances adopted similar to Karachentsev et al. (2004) with H0 = 72 km s-1 Mpc-1. | ||||||||
| – Adopted from the total ionized gas velocity amplitude | ||||||||
| – Adopted to be the distance of Virgo cluster | ||||||||
| 00171055 – = 1.8 mJy. For the F(HI) upper limit the value V=50 km s-1 is used from H data. | ||||||||
| J02050949 – Correction factor of 1.10, calculated as for Sc galaxy NGC 5540, see Sect. 4.3. | ||||||||
| 0624–2614 – Distance from Karachentsev et al. (2004) | ||||||||
| 0937+2949 – Distance is estimated as in Karachentsev et al. catalog (2004), where this galaxy is absent. | ||||||||
| 1013+3809 – Resolved confusion with Sc galaxy of 2 mag. brighter, at 8′ to the S, see text. | ||||||||
| 1059+3934 – Resolved confusion with KUG 1059+395 at 1.9′, see text. | ||||||||
| J1105+6022 – In a group of three dwarfs, see text. | ||||||||
| 1159545 – = 1.0 mJy. | ||||||||
| J1215+5223 – Correction factor of 1.02, accounting for H i structure from GMRT (Begum et al. Begum06 (2006)) | ||||||||
| 1214–277 – =1.0 mJy. FLASH J121809.29275219.5 is probably a member of the same group. | ||||||||
| 1223–359 – A galaxy at 21 to the East and 4′to the South. | ||||||||
| 22361344 – =1.2 mJy. For the F(HI) upper limit the value V=50 km s-1 is used from H data. | ||||||||
| HI06242614 – HVC? Assumed 20 kpc. Unknown correction for angular size/offset. | ||||||||
| 1059395 – Observed to resolve confusion for HS 1059+3934. See text. | ||||||||
| 11026038 – MCG+10-16-056, observed to resolve confusion for SDSS J1105+6022. | ||||||||
| J12020215 – LSB/dI galaxy near J1201+0211 OFF-source position. Flux is corrected for offset attenuation. | ||||||||
| HIJ12182801 – A source near OFF-source position J121830.74280125. No NED candidates. | ||||||||
| 2236136 – In case this is KUG 2236+136 seen in the OFF-source position, the offset attenuation is | ||||||||
| of 2.1. However, this can be a blend since its velocities in UZC (5188 km s-1) and SDSS (5224 km s-1) | ||||||||
| catalogs differ significantly from the value found here. | ||||||||
4.10 HS 10593934 and KUG 1059395
The measured H i flux for the NRT pointing at the position of HS 1059+3934 is 1.39 Jy km s-1. Its H i profile is quite narrow (=59 km s-1), indicating a small rotation velocity. The inclination correction (=62°, =0.88) is not large, at least as it can be estimated from the DSS-2 image, where the axial ratio 0.5. The nearest galaxy, which could potentially affect the H i signal of HS 1059+3934, is KUG 1059+395, an irregular galaxy with a bright central knot, 12 brighter than the target galaxy, at 19 to the West (25 kpc in projection). We obtained the optical spectrum of KUG 1059395 with the SAO 6m telescope and found this to be a starburst galaxy with radial velocity close to that of HS 1059+3934 (Pustilnik et al. 2006b ).
To resolve the potential confusion, we carried out NRT observations of KUG 1059+395. The observed H i profile is centered at a velocity very close to that for HS 1059+3934. A small extra feature is seen at the high velocity end. The derived integrated flux (without the extra feature) is 1.38 Jy km s-1. Having two independent measurements and a known attenuation factor due to offset positions (0.475) for both pointings, we solved this system in several iterations. The total flux is 0.95 Jy km s-1 for HS 1059+3934 and 0.93 Jy km s-1 for KUG 1059+395. The extra feature detected for KUG 1059+395, with the total flux of 0.3 Jy km s-1, is probably an artifact. The recent GMRT mapping of these galaxies (in preparation) shows disturbed H i morphology in both galaxies, implying strong interaction in the system.
4.11 SDSS J1105+6022 and its neighbors
There is some H i signal in the off-source position, which looks as a negative amplitude profile centered at 1260 km s-1. We have checked possible candidate galaxies, and found that the most probable is MCG+10-16-062, a galaxy of =16.3, which is at (52″) and =67 from the off-source pointing. Its radial velocity in SDSS is given as 12733 km s-1. Its offset results in the attenuation factor of 0.75. This galaxy is situated at 94 SE from our target object.
Another potential source of confusion is a disturbed DIG/LSB galaxy of a comparable size and total magnitude, MCG+10-16-056 (m16.5), which is only at 24 west from the target XMD galaxy. Its redshift is unknown. Since this can also contribute to the measured H i flux, we conducted an NRT observation with pointing to MCG+10-16-056. It was detected at a velocity of 1265 km s-1, which is very close to that of MCG+10-16-062. The contribution of the latter in the off-source position for this observation was also significant. Having these 3 results, we solve this system by iterating the fluxes for all three galaxies. This method converges within the observational errors. The derived parameters of these galaxies are given in Table 2. The XMD galaxy and these two new H i detected dwarfs (at the projection distances of 14 and 55 kpc) presumably form an isolated ‘dwarf’ group. The preliminary results of the GMRT mapping (in preparation) reveal H i-line emission from all three described above galaxies, with H i morphology of SDSS J1105+6022 and MCG+10-16-056 typical of a merging pair.
4.12 SDSS J11210324 = NGC 3640A
This galaxy is well detected with a S/N ratio of 10. Its profile, resembling a double-horn one, is consistent with its optical appearance as an inclined disk. This disk has two bright regions displaced from the center and rather disturbed outer isophotes. Hibbard & Sansom (Hibbard03 (2003)) show this galaxy (called NGC 3640A) to be a probable companion of elliptical galaxy NGC 3640 (at a projected distance of 70 kpc), which belongs to galaxy group LGG 233. The H i-line VLA map of this region shows no confusing galaxies. Accordingly, its integrated parameters, derived in that work, are consistent with those obtained on the NRT data.
The -magnitude of 1791 from Kniazev et al. (SDSS (2003)) relates only to emission from the bright H ii region. Our independent estimate of its magnitude (from SDSS) of =1788 is consistent with theirs. The -magnitude for the rest of the galaxy (also from SDSS photometry) is 1718. Summing up the light of both objects results in =1692.
4.13 SDSS J1201+0211
This galaxy with rather disturbed morphology is a probable merger with the fainter (20.4) companion at 17″ NW (1.4 kpc in projection). It lies at the southern edge of the Virgo Cluster. No known galaxies in NED with the radial velocities within our velocity range are expected to be in the NRT beam.
A significant signal, corresponding to an object near the off-source position, is detected at Vhel of 2110 km s-1. The latter falls within the range of the Virgo cluster members in the direction close to its center. However, for the distant southern periphery this velocity is too high and this H i object is far behind the Virgo cluster. Its W50 is 30 km s-1, suggesting very slow rotation or large inclination. There are two candidate faint optical galaxies within the NRT beam near this position. The first one is an edge-on disk, at 100″ N, 25″ W, and the second is a face-on LSBG, at 288″ N, 25″ W. Considering the very narrow H i profile, the ‘face-on’ LSBG galaxy is a more probable counterpart. However, its 18.8 (from SDSS) implies a very high ratio M(HI)/L4.5. This requires further study.
4.14 SDSS J12155233 = CGCG 269049
This galaxy belongs to the Canis Venatici (CnV) I galaxy cloud at a distance of 4 Mpc (e.g., Karachentsev et al. Kara03 (2003)). Its narrow H i profile, with W25 km s-1, is consistent with its very low optical luminosity. The inclination correction for its 0.3 (Karachentsev et al. Kara04 (2004)) is small, 1.03. Its nearest neighbor galaxy UGC 7298 (at the projected distance of 14.3 kpc) has a similar radial velocity of 146 km s-1. The distance of UGC 7298 of 4.21 Mpc is determined through the tip of the RGB (Karachentsev et al. Kara04 (2004)). We therefore consider the distance to SDSS J12155233 to be equal to 4.2 Mpc as well. These galaxies seem to be a close pair and tracers of the recent/current interaction might be visible in their H i morphology. Indeed, the H i maps presented by Begum et al. (Begum06 (2006)), give some hint of disturbance in both galaxies of the neutral gas morphology and its kinematics.
4.15 Tol 1214277 = Tol 21
This BCG is the most distant in our sample. Despite the long integration and the low noise (1 mJy for the effective velocity resolution of 10.5 km s-1), no signal was detected in the spectrum at or near the optical velocity. However, we have detected an object near the off-source position (a negative signal with a ‘double-horn’ profile) with W117 km s-1, at of 7392 km s-1. We have checked known galaxies close to the off-source beam position (72.5 s in RA, or 16′ to the East) and found no appropriate candidates in NED. Several galaxies around Tol 21 have of 7600–7740 km s-1, implying that Tol 21 probably belongs to a loose group. If this H i object is a galaxy with M(HI)/LB 1, its measured integrated flux F(HI) of 0.46 Jy km s-1 corresponds to 18. Accounting for a probable offset and a lower value M(HI)/LB, it can be even brighter.
The upper limit for the H i mass of Tol 21 is derived assuming that its W 100 km s-1 and the peak value of the H i profile is lower than 2 mJy. The upper limit for the ratio M(H i)/ is low (0.28). For most of other XMD galaxies this parameter is (significantly) larger. This implies that this object belongs to the lower end of the XMD galaxy H i mass function. Probably the neutral gas “deficiency” is related to the detectability of Ly- emission in this BCG. This galaxy is the only one among four XMD BCGs in which Ly- emission was detected in the HST observations (Kunth et al. Kunth94 (1994); Thuan & Izotov TI97 (1997)). The very faint galaxy G2 with close (Izotov et al. 2004a ) at a projected distance of 14.5 kpc is probably a companion of Tol 21.
4.16 Tol 1223359 = Tol 65
This galaxy is quite unusual since its H i profile is rather narrow for its large H i mass of 0.66⊙. The inclination correction is difficult to infer since its optical morphology is strongly disturbed at outer isophotes (Papaderos et al. Papa99 (1999)). It resembles SBS 0335052 E, whose H i mass is only a factor of 1.2 higher. Their total H i linewidths are also similar.
Tol 65 is situated at the outskirts of a galaxy group. There are several galaxies with close radial velocities at angular distances of 38′ to 53′. One irregular galaxy, FLASH J122530.92360714.5 (Kaldare et al. FLASH (2003)), with = 278156 km s-1 and 15.7, at 75 to the NW, could contribute some H i emission to the observed flux. However, due to offset attenuation, its measured flux will be 9% of the actual value. Even for M(H i)/L1, this galaxy would contribute no more than 20% to the total H i flux of Tol 65. The close LSBD G1 (Papaderos et al. Papa99 (1999)) is about 5 magnitudes fainter and would give only a minor contribution to the observed H i flux.
4.17 HS 1442+4250 = UGC 9497
This galaxy appears to be an edge-on disk with two prominent off-center H ii-regions and several fainter ones (Kniazev et al. Kniazev98 (1998); Guseva et al. 2003b ). It is one of the nearest XMD BCG known. Its deep photometry and long-slit spectroscopy show no evidence of a stellar population older than 2 Gyr (Guseva et al. 2003b ). Its high S/N ratio H i double-horn profile is rather wide, indicating significant rotation. Some asymmetry in its H i profile at the high-velocity edge of 10% of the peak value may indicate a low mass companion, or a galaxy within the NRT beam. However, a better S/N ratio profile is necessary to confirm this. There is a fainter red galaxy almost in contact, but its radial velocity is unknown, so this might be a background object.
4.18 HS 1704+4332
This galaxy has quite a narrow profile, consistent with its low luminosity. The galaxy is situated in the region of low density luminous galaxies () with the nearest one being situated at 4.7 h-1 Mpc. The nearest known subluminous Updated Zwicky Catalog (UZC) galaxy is at 3 h-1 Mpc.
4.19 HS 2134+0400
This is the most metal-poor BCG and the faintest galaxy in -band in this subsample. The expected H i flux is hence also low. There is a narrow peak (W50=25 km s-1) at a velocity close to the optical one, but its amplitude is not very significant, of the order of 3 . Its morphology on the deep -band image looks rather disturbed, with a plume at the W edge that suggests its probable merger nature (Pustilnik et al. 2006a ), since no disturbing galaxies are present in its environment. The nearby small irregular galaxy South of the BCG is a distant background object.
4.20 Non-detected XMD galaxies
Of four undetected XMD galaxies three are the most distant in the sample, with Vhel in the range of 5600 to 7800 km s-1. For these four galaxies (HS 0017+1055, SBS 1159+545, Tol 21, and HS 2236+1344), the Notes for Table 2 give estimates of for the resolution of 10.5 km s-1 in the spectral regions near their optical velocities. To derive upper limits of their (H i), we assumed that their peak flux densities are lower than the visible peak flux density near the optical velocity plus 2 (in mJy), and that their profiles are boxcar function with less than 100 km s-1. Then their integrated H i flux (H i), is less than . For SBS 1159+545 the situation is complicated since close to the optical velocity we have a faint negative signal, indicating possible confusion with an object in the ‘OFF’-source beam. However, we failed to find a reliable optical counterpart for this negative signal. If the negative peak near the optical velocity is treated as noise, a 3 upper limit of the peak flux density for SBS 1159+545 is 1 mJy. We present its parameters based on this value in Table 2. For in the spectra of HS 0017+1055 and HS 2236+1344 we used the full amplitude of the ionized gas velocity as measured in the H-line (50 km s-1) from the SAO 6 m telescope long-slit observations (in preparation).
The ratio (H i)/LB 0.25 for HS 2236+1344 is one of the lowest among the XMD BCGs observed in this work. There are two additional factors that could affect its value. They both are related to its probable ‘atypical’ nature. As the analysis of its morphology shows (two bright, almost contacting star-forming knots with disturbed periphery and plumes) and the unusual ionized gas kinematics (Pramskij et al. Pramskij03 (2003); Pustilnik et al. in preparation), this object is very likely an advanced merger. The strengths of starbursts in mergers are the largest in comparison to other cases since the main fraction of available gas can be involved in SF. This implies that in mergers, the (H i)/LB ratio is shifted down from its ‘typical’ value. The second reason is that conditions in the ISM of merging gas-rich galaxies are favorable for transforming the whole H i cloud population to H2 (e.g., Elmegreen Elmegreen93 (1993)).
4.21 Non-XMD galaxies
The parameters of the observed and detected non-XMD galaxies are presented at the bottom of Table 2. We divide them into three categories.
First: the targets previously considered as XMD galaxies, but later eliminated from this group due to better precision O/H determination. The only galaxy in this category is HS 1342+4210, with the value of 12+(O/H)=7.89. This is probably interacting with a fainter companion at 13″ SEE, as seen on the DSS-2 image.
Second: the targets observed to resolve the potential or certain confusion, either in the ‘ON’-source, or in the ‘OFF’-source beam. They include KUG 1059+395, MCG+10-15-056 and MCG+10-15-062.
Third: new H i sources which appeared occasionally in the ‘OFF’ beam in the range of 1300 km s-1 near the velocity of the target XMD galaxy. One of them, near the position of HS 2236+1344, could be tentatively identified (based on the information from NED) with the cataloged galaxy KUG 2236+136. Another faint galaxy, J1202+0215, detected near the position of SDSS J1201+0211 (see Sect. 4.13) is not cataloged. For the faint source HI J12182801 near Tol 21 we did not find any optical counterpart.
5 Discussion and conclusions
As mentioned in the introduction, four evolution scenarios can possibly explain the existence of XMD galaxies. For old galaxies with very low SFR (kind of LSBGs) and truly young galaxies for which one expects the closed-box to be valid, the small range of O/H in our sample corresponds, according to estimates, e.g., of Pilyugin & Ferrini (PF00 (2000)) to a gas mass fraction 0.9. However, if the low metallicity of a galaxy ISM is acquired due to exchange with the intergalactic medium, the gas mass-fraction can be significantly lower, e.g., MHI Mstars. The estimate of H i mass from the integrated H i flux is quite straightforward. However, the estimate of the total stellar mass in star-bursting galaxies requires the separation of the flux from the young population and surrounding H ii regions that often dominate hiding an old, underlying component. Thus, to address the issue of the gas-mass fraction, we need good surface photometry of the studied objects. We just mention that in addition to well-known very gas-rich XMD galaxies I Zw 18 and SBS 0335–052, the H i data for Tol 65 from this paper, along with the surface photometry from Papaderos et al. (Papa99 (1999)), indicate that this galaxy belongs to the same class. We postpone the related analysis based on photometric data to a forthcoming paper. Below we discuss the large variance of H i parameters of the XMD galaxies and new evidence for the importance of interactions to trigger starbursts in the XMD BCG sample.
5.1 Variance of H i and optical properties
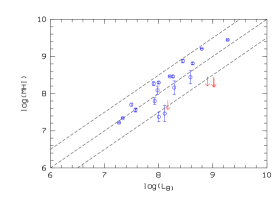
We briefly summarize the data in Tables 1 and 2. The total range of oxygen abundances in the sample is small, 0.23 dex, or a factor of 1.7. However, the total range of -band luminosities in the studied XMD galaxies is more than two orders of magnitude (M from –12.5 to –17.7, or (LB/L⊙) = 7.19 to 9.27). The range of H i mass in the sample XMD galaxies is comparable to the optical luminosity range: (M(H i)/M⊙)=7.22 to 9.47. The latter implies that for galaxies in the very-low metallicity regime this is not tightly connected with their other global parameters. For the blue luminosity, this can be partly understood since the studied galaxy sample includes objects of various types - LSBDs, DIGs, BCGs, and even merging pairs. The strong starbursts in BCGs can brighten the blue luminosity of a progenitor galaxy by a factor of 10 or more (e.g., Krüger Kruger92 (1992)), depending on the starburst strength, its age, and the preburst evolutionary state. This brightening, however, could account only for a part of this large range of LB. Figure 2 shows that the LB and M(H i) of our XMD galaxy sample are correlated, and have a mean M(H i)/LB of 1.15. The scatter of the data is smaller than a factor of 2.4. However, five of the sample galaxies show values of M(H i)/LB that are below the mean by a factor of 3–5. The latter can indicate evolution with significant metal loss, as for the nearby old XMD DIGs Sextans A and B, with M(H i)/L.
5.2 Interactions as a SF trigger in XMD BCGs
The majority of known XMD galaxies are BCGs, low-mass galaxies with sufficiently strong SF activity. One of the important questions on XMD BCGs is the nature of the triggering mechanisms for their SF bursts. Both external and intrinsic mechanisms are proposed to be responsible for the starbursts observed in BCGs in general, e.g., Salzer & Norton (2000) argue that BCG starbursts are due to an intrinsic trigger in some specific BCG progenitors – gas-rich galaxies with enhanced gas concentration index. However, if some XMD galaxies are really young, the external trigger due to gravitational interactions with other galaxies appears more natural, otherwise it is not clear why they did not start SF much earlier. The interaction trigger seems to be sufficiently important for starbursts in BCGs in general (e.g., Taylor et al. Taylor93 (1993), Taylor95 (1995); Pustilnik et al. 2001b ). Therefore, it is natural to check whether sufficiently close companions/neighbors of various masses exist in the vicinity of our target galaxies.
The majority of galaxies in the studied sample appear to have various indications of stronger or weaker interaction. First of all there are direct indications of close companions (both in terms of projected distance and radial velocity). This relates to HS 1059+3934 and KUG 1059+395 at 25 kpc, HS 1013+3809 and UGC 5540 at 50 kpc, and SDSS J1105+6022 and MCG 10-16-056 at 15 kpc. SDSS J1121+0324 is a probable companion of E3 galaxy NGC 3640 at 74 kpc and a member of the galaxy group LGG 233. SDSS J1215+5223 is paired with UGC 7298 at 14 kpc. Tol 21 has a tiny companion at 14 kpc (Izotov et al. 2004a ). One more XMD BCG HS 0822+3542 has a companion LSBG at 11 kpc (Pustilnik et al. 2003b ; Chengalur et al. GMRT (2006)). Several other XMD galaxies HS 0122+0743, HS 2236+1344, and HS 0837+4717 (Pramskij et al. Pramskij03 (2003); Pustilnik et al. 2004a ) show clear evidence for various stages of a merger from both their optical morphology and ionized gas kinematics.
Other XMD BCGs show only indications for interaction-induced SF activity based on their morphology. In particular, HS 0846+3522 and SDSS J1201+0211 have a disturbed external morphology and fainter galaxies in their vicinity, suggesting ongoing merging. HS 2134+0400 has a disturbed morphology of the outer parts and a plume on the western edge. Another indication of interaction is an asymmetric H i profile, which is visible in HS 1033+4757.
In summary, we note that the majority of XMD BCGs are either certainly or probably interacting. Our H i studies gave several new indications for the importance of tidal trigger to SF activity. However, more detailed studies of H i morphology and kinematics, as well as those of the ionized gas in these galaxies, are necessary to unambiguously support this conclusion.
5.3 Probable new high-velocity cloud
A well-detected H i source in the ‘ON’ beam in the direction of AM 0624–261, at Vhel = 188 km s-1 can be seen in Fig. 1. Its parameters are given in Table 2 under the name HI 0624–2614. No candidate galaxies within the NRT beam that could be counterparts for this H i source are found.
Therefore, the most probable interpretation of this feature is the emission of a high-velocity H i cloud (HVC) near the Milky Way. In the HVC name system, it would be HVC 234.3-16.8+208 (which means galactic longitude and latitude in degrees and the local standard of rest velocity in km s-1). The nearest known HVCs to this position are HVC 234.6-17.2+175, HVC 233.6-17.2+175, and HVC 233.8-18.7+212 from the HIPASS HVC catalog of Putman et al. (Putman02 (2002)), at angular distances of 0.5∘, 0.8∘, and 2.0∘, respectively. The FWHMs of their H i profiles are 33–34 km s-1 in comparison to the value of 375 km s-1 measured for HI 0624–2614. These nearby HVCs have axial ratios of 1.5, with the major axis FWHM of 0.8 to 2.4 and peak brightness temperatures Tb of 0.06 to 0.23 K. Their total H i fluxes vary in the range of 9 to 97 Jy km s-1. The NRT beam with FWHM = 0.370.06 is rather small for such HVCs and due to resolution will pick up only a fraction of the total H i flux. The flux loss can vary from a factor of 10 to several hundred. Therefore, if this source is a part of a HVC, the measured flux of this object 0.77 Jy km s-1 matches the known range well. Note, that for an extended source with a characteristic size of 10′, a large reduction of the measured signal will occur due to subtraction of the source signal in the ‘OFF’ beam (here at 135). Thus, all parameters of HI 0624–2614 are consistent with the hypothesis that it is a portion of a HVC similar to several such nearby objects.
5.4 Conclusions
-
1.
We have measured the integrated H i parameters for 18 extremely metal-deficient (12+(O/H) 7.65) dwarf galaxies, including 15 measured for the first time. For four more XMD galaxies we obtained useful upper limits on their H i mass and ratio (H i)/.
-
2.
For the total range of O/H of the studied XMD galaxies of only 1.7 (0.23 dex), the distribution of their global parameters vary widely. The range of (H i), as well as of blue luminosity, is two orders of magnitude (from 2 to 3 M⊙, and MB from -12.5 to -17.7).
-
3.
More than 2/3 of the twenty non-LSB XMD galaxies from this study show evidence of interaction/merger with other galaxies.
-
4.
In the direction of AM 0624–261 ( 234.3, 16.8), an H i-object is detected at a radial velocity +188 km s-1 (= +208 km s-1), with an integrated H i flux within the NRT beam of 0.77 Jy km s-1 and =37 km s-1. A comparison with data on nearby high-velocity H i clouds (HVC) shows that this object is probably a part of a new HVC (tentative name HVC 234.3-16.8+208).
Acknowledgements.
We are grateful to the NRT Comité de Programmes for time allocation for this project. SAP is grateful to OdP and CNRS for support of his visits to Observatoire de Paris where the main part of this work was performed. SAP acknowledges the partial support from the RFBR grant No. 06-02-16617. The Nançay Radio Observatory is the Unité scientifique de Nançay of the Observatoire de Paris, associated as Unité de Service et de Recherche No. B704 with the French Centre National de la Recherche Scientifique. The Nançay Observatory also gratefully acknowledges the financial support of the Conseil Regional de la Région Centre in France. We thank the anonymous referee for useful comments and suggestions that allowed us to improve our presentation. We acknowledge the use of the NED and LEDA databases to check the information on the properties of the studied dwarf galaxies and their environment, and the SDSS database for the use of photometry for many of the studied galaxies and of spectral information on some objects in their environment.References
- (1) Adelman-McCarthy J.K., et al. 2006, ApJS, 162, 38
- (2) Asplund, M., Grevesse, N., Sauval, A.J., Allende Prieto, C., & Kiselman, D., 2004, A&A, 417, 751
- (3) Begum, A., Chengalur, J., Karachentsev, I., Kajsin, S. & Sharina, M. 2006, MNRAS, 365, 1220
- (4) Bergvall, N., Rönnback, J., Masegosa, J., & Östlin, G. 1999, A&A, 341, 697
- (5) Bouwens, R., & Illingworth, G. 2006, New Astronomy Reviews, 50, 152
- (6) Cairos, L.M., Caon, N. Papaderos, P., et al. 2003, ApJ, 593, 312
- (7) Chengalur, J.N., Giovanelli, R., & Haynes, M.P. 1995, AJ, 109, 2415
- (8) Chengalur, J.N., Pustilnik, S.A., Martin, J.-M. & Kniazev, A.Y. 2006, MNRAS, 371, 1849 (Paper III)
- (9) Combes, F. 2005, in Starbursts: From 30 Doradus to Lyman Break Galaxies, Ed. by R. de Grijs & R.M. Gonzalez Delgado, ASS Library, vol. 329. Dordrecht: Springer, p.167
- (10) Doublier, V., Caulet, A., & Comte, G. 1999, A&AS, 138, 213
- (11) Elmegreen, B.G. 1993, ApJ, 411, 170
- (12) Ekta, Chengalur, J.N., & Pustilnik, S.A. 2006, MNRAS, 372, 853 (Paper II)
- (13) Fricke, K., Izotov, Y.I., Papaderos, P., Guseva, N.G., Thuan, T.X. 2001, AJ, 121, 169
- (14) Gallagher III, J.S., Littleton, J.E., & Matthews, L.D. 1995, AJ, 109, 2003
- (15) Haynes, M.P. & Giovanelli, R. 1991, ApJS, 77, 331
- (16) Hibbard, J.E. & Sansom, A.E. 2003, AJ, 125, 667
- (17) Garcia, A.M., Bottinelli, L., Garnier, R., Gouguenheim, L., & Paturel, G. 1994, A&AS, 107, 265
- (18) Gil de Paz, A., Madore, B.F. & Pevunova, O. 2003, ApJS, 147, 29
- (19) Granet, C., James, G.L., Pizzani, J. 1997, IEEE Trans. on Antennas and Prop. 45, 1366
- (20) Guseva, N.G., Papaderos, P., Izotov, Y.I., et al. 2003a, A&A, 407, 105
- (21) Guseva, N.G., Papaderos, P., Izotov, Y.I., et al. 2003b, A&A, 407, 91
- (22) Impey, C., & Bothun, G. 1997, ARAA, 35, 267
- (23) Izotov, Y.I., Lipovetsky, V.A., Guseva, N.G., Kniazev, A.Y., & Stepanian, J.A. 1990, Nature, 343, 238
- (24) Izotov, Y.I., Lipovetsky, V.A., Guseva, N.G., Kniazev, A.Y., & Stepanian, J.A. 1992, A&A, 247, 303
- (25) Izotov, Y.I., & Thuan, T.X. 1999, ApJ, 511, 639
- (26) Izotov, Y.I., Papaderos, P., Guseva N.G., Fricke, K.J., & Thuan, T.X. 2004a, A&A, 421, 539
- (27) Izotov, Y.I., & Thuan, T.X. 2004b, ApJ, 616, 768
- (28) Izotov, Y.I., & Thuan, T.X. 2005, ApJ, 632, 210
- (29) Izotov, Y.I., Stasinska, G., Meynet, G., Guseva, N.G., & Thuan, T.X. 2006, 448, 955
- (30) Kaldare, R., Colless, M., Raychaudhury, S., & Peterson, B. A. 2003, MNRAS, 339, 625
- (31) Karachentseva, V.E. & Karachentsev, I.D. 1998, A&AS, 127, 409.
- (32) Karachentsev, I.D., Sharina, M.E., Dolphin, A.E., et al. 2003, A&A, 398, 467
- (33) Karachentsev, I.D., Karachentseva, V.E., Huchtmeier, W., & Makarov, D.I. 2004, AJ, 127, 2031
- (34) Kniazev, A.Y., Pustilnik, S.A., & Ugryumov, A.V. 1998, Bulletin SAO, 46, 23
- (35) Kniazev, A.Y., Pustilnik, S.A., Pramsky, A.G., Ugryumov, A.V., & Kniazeva, T.F. 2001, A&A, 371, 404
- (36) Kniazev, A.Y., Grebel, E., Hao, L., et al. 2003, ApJ, 593, L73
- (37) Kniazev, A.Y., Pustilnik, S.A., Grebel, E., Pramskij, A.G., & Lee, H. 2004a, ApJS, 153, 429
- (38) Kniazev, A.Y., Grebel, E., Pustilnik, S.A., Pramskij, A.G., & Zucker, D. 2005, AJ, 130, 1558
- (39) Kruger, H. 1992, Ph.D. Thesis, Univ. Goettingen
- (40) Kunth, D. Lequeux, J., Sargent, W.L.W., Viallefond, F. 1994, A&A, 282, 709
- (41) Kunth, D., & Östlin, G. 2000, A&ARv, 10, 1
- (42) Lee, J.C., Salzer, J.J., Impey, C., Thuan, T.X., & Gronwall, C. 2002, AJ, 124, 3088
- (43) Lee, J.C., Salzer, J.J., & Melbourne, J. 2004, ApJ, 616, 752
- (44) Legrand, F., Kunth, D., Roy, J.-R., Mas-Hesse, J.M., Walsh, J.R. 2000, A&A, 355, 891
- (45) Leitherer, C., Schaerer, D., Goldader, J.D., et al. 1999, ApJS, 123, 3
- (46) Lipovetsky, V.A., Chaffee, F.H., Izotov, Y.I., et al. 1999, ApJ, 519, 177
- (47) Loose, H.-H., & Thuan, T.X. 1986, ApJ, 309, 59
- (48) Lu, N.-Y., Hoffman, G.L., Groff, T., Roos, T., & Lamphier, C. 1993, ApJS, 88, 383
- (49) Mac Low, M.-M., & Ferrara, A. 1999, ApJ, 513, 142
- (50) Martin, J.-M., Gerard, E., Colom, P., Theureau, G., & Cognard, I., in: SF2A, F. Combes and D. Barret (eds)., p.237, EDP Sciences, 2002
- (51) Matteucci F., & Chiosi C., 1983, A&A, 123, 121
- (52) Masegosa, J., Moles, M., & Campos-Aguilar, A. 1994, ApJ, 420, 576
- (53) Melbourne, J., Phillips, A., Salzer, J.J., Gronwall, C., & Sarajedini, V.L. 2004, AJ, 127, 686
- (54) Momany, Y., Held, E.V., Saviane, I., et al. 2005, A&A, 439, 111
- (55) Östlin, G., & Mouhcine, M. 2005, A&A, 433, 797
- (56) Papaderos, P., Loose, H.-H., Thuan, T.X., & Fricke, K. 1996, A&AS, 120, 207
- (57) Papaderos, P., Izotov, Y.I., Fricke, K.J., Thuan, T.X., & Guseva, N.G. 1998, A&A, 338, 43
- (58) Papaderos, P., Fricke, K.J., Thuan, T.X., Izotov, Y.I., & Nicklas, H. 1999, A&A, 352, L57
- (59) Papaderos, P., Izotov, Y.I., Thuan, T.X. et al. 2002, A&A, 393, 461
- (60) Parodi, B.R., Barazza, F.D., & Binggeli, B. 2002, A&A, 388, 29
- (61) Pello, R., Richard, J., Schaerer, D., et al. 2005, Conference proc. “The Fabulous Destiny of Galaxies: Bridging Past and Present”, astro-ph/0510180
- (62) Pilyugin, L.S. & Ferrini, F. 2000, A&A, 354, 874
- (63) Pramskij, A.G., Pustilnik, S.A., Kniazev, A.Y., & Ugryumov, A.V. 2003, SAO preprint No. 189
- (64) Pustilnik, S.A., Lipovetsky, V.A., Izotov Y.I., et al. 1997, Astronomy Letters, 23, 308
- (65) Pustilnik, S.A., Engels, D., Ugryumov, A.V., et al. 1999, A&AS, 137, 299
- (66) Pustilnik, S.A., Brinks, E., Thuan, T.X., Lipovetsky, V.A., & Izotov, Y.I. 2001a, AJ, 121, 1413
- (67) Pustilnik, S.A., Kniazev, A.Y., Lipovetsky, V.A., & Ugryumov, A.V. 2001b, A&A, 373, 24
- (68) Pustilnik, S.A., Kniazev, A.Y., Masegosa, J., et al. 2002a, A&A, 389, 779
- (69) Pustilnik, S.A., Martin, J.-M., Huchtmeier, W., et al. 2002b, A&A, 389, 405
- (70) Pustilnik, S.A., Kniazev, A.Y., Ugryumov, A.V., & Pramskij, A.G. 2003a, ApSS, 284, 795
- (71) Pustilnik, S.A., Kniazev, A.Y., Pramskij, A.G., Ugryumov, A.V., & Masegosa, J. 2003b, A&A, 409, 917
- (72) Pustilnik, S., Zasov, A., Kniazev, A., et al. 2003c, A&A, 400, 841
- (73) Pustilnik, S.A., Kniazev, A.Y., Pramskij, A.G., et al. 2004a, A&A, 419, 469
- (74) Pustilnik, S.A., Pramskij, A.G., & Kniazev, A.Y. 2004b, A&A, 425, 51
- (75) Pustilnik, S.A., Kniazev, A.Y., Pramskij, A.G. 2005a, A&A, 443, 91
- (76) Pustilnik, S.A., Engels, D., Kniazev, A.Y. et al. 2006a, Astronomy Letters, 32, 228
- (77) Pustilnik, S.A., Kniazev, A.Y., Pramskij, A.G., et al. 2006b, A&A, in preparation
- (78) Pustilnik, S.A., Engels, D., Kniazev, A.Y. et al. 2006c, A&A, in preparation
- (79) Putman, M.E., de Heij, V., Staveley-Smith, L., et al. 2002, AJ, 123, 873
- (80) Roberts, M.S., & Haynes, M.P., 1994, ARAA, 32, 115
- (81) Ronnback, J., & Bergvall, N. 1994, A&AS, 108, 193
- (82) Ronnback, J., & Bergvall, N. 1995, A&A, 302, 353
- (83) Salzer, J.J., Di Serego Alighieri, S., Matteucci, F., Giovanelli, R., Haynes, M. 1991, AJ, 101, 1258
- (84) Salzer, J.J., Gronwall, C., Sarajedini, V.L. et al. 2002, AJ, 123, 1292
- (85) Salzer, J.J., Rosenberg, J.L., Weisstein, E.W., Mazzarella, J.M., & Bothun, G.D. 2002, AJ, 124, 191
- (86) Salzer, J.J., Lee, J.C., Melbourne, J., et al. 2005, ApJ, 624, 661
- (87) Sargent, W.L.W., & Searle, L. 1970, ApJ, 162, L155
- (88) Schlegel, D.J., Finkbeiner D.P., & Douglas M. 1998, ApJ, 500, 525
- (89) Schneider, S.E., Helou, G., Salpeter, E.E., & Terzian, Y. 1986, AJ, 92, 742
- (90) Schombert, J., McGaugh, S.S., & Eder, J., 2001, AJ, 121, 2420
- (91) Skillman, E.D., Kennicutt, R. & Hodge, P. 1989, ApJ, 347, 875
- (92) Smith, J.A., Tucker, D.L., Kent, S. et al. 2002, AJ, 123, 2121
- (93) Staveley-Smith, L., Davies, R.D., & Kinman, T.D. 1992, MNRAS, 258, 334
- (94) Taylor, C.L., Brinks, E., & Skillman, E.D. 1993, AJ, 105, 128
- (95) Taylor, C.L., Brinks, E., Grashuis, R.M., & Skillman, E.D. 1995, ApJS, 99, 427
- (96) Terlevich, R., Melnick, J., Masegosa, J., Moles, M, & Copetti, M. 1991, A&AS, 91, 285
- (97) Theureau, G., Bottinelli, L., Coudreau-Durand, N., et al. 1998, A&AS, 130, 333
- (98) Thuan, T.X., & Martin, G.E. 1981, ApJ, 247, 823
- (99) Thuan, T.X., & Izotov, Y.I. 1997, ApJ, 489, 623.
- (100) Thuan, T.X., Lipovetsky, V.A., Martin, J.-M., & Pustilnik, S.A. 1999, A&AS, 139, 1
- (101) Ugryumov, A.V., Engels, D., Pustilnik, S.A., et al. 2003, A&A, 397, 463
- (102) van Zee, L. 2000, ApJ, 543, L31
- (103) van Zee, L., Haynes, M.P., Salzer, J.J., & Broeils, A.H. 1996, AJ, 112, 129
- (104) van Zee, L., Haynes, M.P., Salzer, J.J., & Broeils, A.H. 1997, AJ, 113, 1218
- (105) van Zee, L., Haynes, M.P., & Salzer, J.J. 1997, AJ, 114, 2479
- (106) van Zee, L., Westpfahl, D., Haynes, M.P., & Salzer, J.J. 1998, AJ, 115, 1000
- (107) van Zee, L., Skillman, E.D., & Haynes, M.P. 2006, ApJ, 637, 269
- (108) Yan, H., Dickinson, M., Stern, D., et al. 2005, ApJ, 634, 109