Star formation in a clustered environment
around the UCH ii region in IRAS 20293+3952
Abstract
Aims. We aim at studying the cluster environment surrounding the UCH ii region in IRAS 20293+3952, a region in the first stages of formation of a cluster around a high-mass star.
Methods. BIMA and VLA were used to observe the 3 mm continuum, N2H+ (1–0), NH3 (1,1), NH3 (2,2), and CH3OH (2–1) emission of the surroundings of the UCH ii region. We studied the kinematics of the region and computed the rotational temperature and column density maps by fitting the hyperfine structure of N2H+ and NH3.
Results. The dense gas traced by N2H+ and NH3 shows two different clouds, a main cloud to the east of the UCH ii region, of 0.5 pc and 250 , and a western cloud, of 0.15 pc and 30 . The dust emission reveals two strong components in the northern side of the main cloud, BIMA 1 and BIMA 2, associated with YSOs driving molecular outflows, and two fainter components in the southern side, BIMA 3 and BIMA 4, with no signs of star forming activity. Regarding the CH3OH, we found strong emission in a fork-like structure associated with outflow B, as well as emission associated with outflow A. The YSOs associated with the dense gas seem to have a diversity of age and properties. The rotational temperature is higher in the northern side of the main cloud, around 22 K, where there are most of the YSOs, than in the southern side, around 16 K. There is strong chemical differentiation in the region, since we determined low values of the NH3/N2H+ ratio, 50, associated with YSOs in the north of the main cloud, and high values, up to 300, associated with cores with no detected YSOs, in the south of the main cloud. Such a chemical differentiation is likely due to abundance/depletion effects. Finally, interaction between the different sources in the region is important. First, the UCH ii region is interacting with the main cloud, heating it and enhancing the CN (1–0) emission. Second, outflow A seems to be excavating a cavity and heating its walls. Third, outflow B is interacting with the BIMA 4 core, likely producing the deflection of the outflow and illuminating a clump located 0.2 pc to the northeast of the shock.
Conclusions. The star formation process in IRAS 20293+3952 is not obviously associated with interactions, but seems to take place where density is highest.
Key Words.:
Stars: formation — ISM: individual: IRAS 20293+3952 — ISM: dust — ISM: clouds1 Introduction
It is generally accepted that the formation of massive stars takes place not isolated but simultaneously with the formation of a cluster. Clusters of infrared sources have been studied at optical and near-infrared wavelengths around intermediate/high-mass stars (e.g., McCaughrean & Stauffer 1994; Hillenbrand 1995; Hillenbrand & Hartmann 1998; Testi et al. 1998, 1999, 2000). One could surmise on the structure and the evolutionary state of the molecular cloud when such clusters were being born around an intermediate/high-mass protostar. In the standard theory of star formation, the central massive object, deeply embedded in large amounts of gas and dust, starts to radiate at UV wavelengths at very early stages, before finishing the accretion of all its final mass (e. g., Bernasconi & Maeder 1996). The UV photons ionize the surrounding medium, and the high-mass star developes an UCH ii region around it (see, eg. Garay & Lizano 1999), which expands and pushes forward the gas and dust surrounding it until the parental cloud is completely disrupted and a cluster of infrared/optical sources emerges (e. g., Hester & Desch 2005). The study of the clumpy medium around massive protostars helps not only in the understanding of the formation of the massive star itself, but also provides a direct way to study the clustered mode of star formation, in which most stars are thought to form.
In order to properly characterize the medium around a massive protostar, it is necessary to be sensitive to small (2000 AU) and low-mass ( ) clumps of gas and dust. For this, interferometric observations toward relatively nearby ( kpc) massive star-forming regions are required, and are now possible with sufficient sensitivity. Here we report on observations of one intermediate/high-mass star-forming region, IRAS 20293+3952, located at 2.0 kpc of distance (Beuther et al. 2004b) in the southwestern edge of the Cygnus OB2 association, and with a luminosity of 6300 . This region has been included in the sample of high-mass protostar candidates of Sridharan et al. (2002). The IRAS source is associated with the only centimeter source detected in the region, which is likely tracing an UCH ii region (Beuther et al. 2002b). A study of the H2 emission in the region shows two near-infrared stars (IRS 1 and IRS 2) associated with the IRAS source, and a circular ring of H2 emission surrounding IRS 1 (Kumar et al. 2002). Beuther et al. (2002a) observed the region with the IRAM 30 m telescope and find some substructure at 1.2 mm around the UCH ii region. The strongest millimeter peak, very close to the position of a H2O maser, is located 15′′ north-east of the IRAS source, and observations with high angular resolution by Beuther et al. (2004a) reveal a compact and strong millimeter source, mm1, associated with the H2O maser. Two other fainter compact millimeter sources, mm2 and mm3, are located to the east of the UCH ii region. Beuther et al. (2004a), from CO (2–1) and SiO (2–1) observations, suggest the presence of four molecular outflows in the region, with two of them, outflows A and B, associated with two chains of H2 knots (Kumar et al. 2002). Subsequent observations with the PdBI were carried out at 2.6 and 1.3 mm by Beuther et al. (2004b), who find CN emission close to mm1, mm2 and mm3. The different millimeter sources detected and the presence of multiple outflows around the UCH ii region makes this region a good choice to study star formation and interaction in a clustered environment.
In this paper we report on BIMA and VLA observations of the continuum at 3 mm and the dense gas traced by N2H+ (1–0), NH3 (1,1), and NH3 (2,2) toward IRAS 20293+3952, together with observations of several CH3OH (2–1) transitions. In § 2 we summarize the observations and the reduction process, in § 3 we show the main results for the continuum and molecular line emission, in § 4 we analyze the line emission and show the method used to derive the rotational temperature and column density maps. Finally, in § 5 we discuss the results obtained, mainly the properties of the dense gas surrounding the UCH ii region, the different sources identified in the region, and the interaction between them.
| Beam | P.A. | Spec. resol. | Rmsa | |||
|---|---|---|---|---|---|---|
| Observation | Telescope | Config. | (arcsec) | (°) | (km s-1) | (m) |
| Continuum | BIMA | B+C | 0.7 | |||
| CH3OH (2–1) | BIMA | B+C | 0.31 | 80 | ||
| N2H+ (1–0) | BIMA | B+C | 0.31 | 70 | ||
| NH3 (1,1) | VLA | D | 71.5 | 0.62 | 3 | |
| NH3 (2,2) | VLA | D | 71.4 | 0.62 | 3 |
-
a
Rms noise per channel in the case of line emission.
2 Observations
2.1 BIMA
The N2H+ (1–0) and CH3OH (2–1) lines and continuum at 95 GHz were observed towards the IRAS 20293+3952 region with the BIMA array111The BIMA array was operated by the Berkeley-Illinois-Maryland Association with support from the National Science Foundation. at Hat Creek. The observations were carried out on 2003 September 28 in the C configuration, and on 2004 March 24, in the B configuration, with 10 antennas in use. The phase center of the observations was set at ; (position of the millimeter peak detected with the IRAM 30 m telescope by Beuther et al. 2002a). The full range of projected baselines, including both configurations, was 9.4–240 m. The FWHM of the primary beam at the frequency of the observations was 120′′. Typical system temperatures were 500 K for Sep 28 and 500–1500 K for Mar 24.
The digital correlator was configured to observe simultaneously the continuum emission, the N2H+ (1–0) group of hyperfine transitions (93.17631 GHz, in the lower sideband), and the CH3OH 21–11 E, 20–10 E, 20–10 A+, and 2-1–1-1 E transitions (96.74142 GHz, in the upper sideband). For the continuum, we used a bandwidth of 600 MHz in each sideband, and for the lines we used a bandwidth of 25 MHz with 256 channels of 100 kHz width, providing a spectral resolution of 0.31 km s-1.
Phase calibration was performed with QSO 2013+370, with typical rms in the phases of 12° and 43° for C and B configurations, respectively. The absolute position accuracy was estimated to be around . We also used QSO 2013+370 for flux calibration, and the error in the flux density scale was assumed to be 30%. Data were calibrated and imaged using standard procedures in MIRIAD (Sault et al. 1995). We combined the data from B and C configurations. In order to improve the angular resolution of the continuum emission, we weighted the visibility data with a robust parameter of . For the line emission, which is more extended than the continuum, we used natural weighting. The resulting synthesized beams and the final rms noises are listed in Table 1.
2.2 VLA
Observations of the and inversion transitions of the ammonia molecule were carried out with the Very Large Array (VLA) of the NRAO222The National Radio Astronomy Observatory is a facility of the National Science Foundation operated under cooperative agreement by Associated Universities, Inc. in the D configuration on 2000 September 3. The phase center was set to ; (catalogue position of the IRAS source). The FWHM of the primary beam at the frequency of observation was 110′′, and the range of projected baselines was 37.9–708 m. The absolute flux calibration was performed by using 3C 48, adopting a flux density at 1.3 cm of 1.05 Jy. The phase calibrator was QSO 2013+370, with a 1.3 cm bootstrapped flux density of 3.84 Jy, and 3C 84 was used as the bandpass calibrator.
The NH3 (1,1) and NH3 (2,2) lines were observed simultaneously in the 4 IF correlator mode of the VLA (with 2 polarizations for each line), providing 63 channels with a spectral resolution of 0.62 km s-1 across a bandwidth of 3.13 MHz, plus an additional continuum channel containing the central 75% of the total bandwidth. The bandwidth was centered at the systemic velocity km s-1 (Sridharan et al. 2002) for the NH3 (1,1) line, and at km s-1 for the NH3 (2,2) line (to cover the main and one of the satellite components). Data were calibrated and imaged using standard procedures of AIPS. The cleaned channel maps were made using natural weighting of the visibility data. Table 1 summarizes the parameters of the observations.

3 Results
3.1 Continuum emission
Figure 1 shows the continuum map at 3.15 mm overlaid on the continuum infrared emission at 2.12 m from Kumar et al. (2002). The millimeter continuum emission has two strong components, BIMA 1 and BIMA 2, both spatially resolved. While BIMA 1 is elongated in a northeast-southwest direction (roughly P.A.45°), BIMA 2 is somewhat flattened in the east-west direction, and is surrounded by an elongated structure of 30′′ (0.3 pc), which is tracing a dust ridge. There is an extended clump to the southeast of the dust ridge, which we label BIMA 3. Note that in this southeastern region there are very few infrared sources. At to the east of the ridge, there is another faint feature, BIMA 4, extending for in the northwest-southeast direction. Continuum emission at a level of 5 is detected toward the position of the UCH ii region, and toward IRS 2. Beuther et al. (2004b) observed the same region at 2.6 mm with the PdBI at higher angular resolution (), but with a smaller primary beam (). The authors find a very strong compact source, mm1, toward the position of BIMA 1 and elongated in the same northeast-southwest direction as BIMA 1. Besides this strong component, a weak subcomponent was resolved in the direction of the elongation (to the southwest of mm1), and was labeled mm1a. Beuther et al. (2004b) also find two compact millimeter sources associated with BIMA 2, mm2 and mm3 (see Fig. 1 for the positions of these compact millimeter sources).
| Peak Position | Fluxa | Assumed b | Massc | |||
|---|---|---|---|---|---|---|
| (m) | (mJy) | (K) | () | |||
| BIMA 1 | 20:31:12.767 | 40:03:22.65 | 17.4 | 28 | 34 | 6.3 |
| BIMA 2 | 20:31:12.062 | 40:03:12.22 | 12.1 | 23 | 34 | 5.2 |
| BIMA 2+ridge | - | - | - | 42 | 25 | 14 |
| BIMA 3 | 20:31:13.769 | 40:03:03.12 | 5.4 | 7.9 | 17 | 3.9 |
| BIMA 4 | 20:31:14.558 | 40:03:06.95 | 4.2 | 7.9 | 17 | 3.9 |
| IRS 2 | 20:31:10.303 | 40:03:17.10 | 3.5 | 3.9 | 50 | 0.60 |
-
a
Flux density inside the 5 contour level for BIMA 1, BIMA 2, and BIMA 2+ridge, and the 3 level for BIMA 3, BIMA 4, and IRS 2.
-
b
is estimated by correcting the rotational temperature derived from NH3 (see § 4.2) to kinetic temperature, following the expression of Tafalla et al. (2004). For IRS 2 we assumed K.
-
c
Masses of gas and dust derived assuming a dust emissivity index (Beuther et al. 2004b). The uncertainty in the masses due to the opacity law and the dust emissivity index is estimated to be a factor of four.
In Table 2 we show the position, peak intensity, flux density and masses associated with BIMA 1, BIMA 2, the entire dust ridge (including BIMA 2), BIMA 3, BIMA 4, and IRS 2. We discuss these results in section 4.1.

3.2 CH3OH
Figure 2a shows the zero-order moment map of the CH3OH emission, integrated from to 21 km s-1, including the two strongest transitions 20–10 A+, and 2-1–1-1 E. Figure 3 shows the CH3OH spectrum at selected positions. The channel maps corresponding to the lines 20–10 A+ and 2-1–1-1 E are shown in Fig. 4.

The strongest emission of CH3OH is found to the southeast of BIMA 1, elongated in the southeast-northwest direction, and covering a spatial extension of 55′′ (0.6 pc). The emission has a fork-like structure (this is well observed in the 7.7 km s-1 velocity channel of Fig. 4), and extends through several channels. This structure is associated with high-velocity SiO (2–1) and CO (2–1) emission of outflow B (Beuther et al. 2004a). The position-velocity (p-v) plot along outflow B is shown in Fig. 5a. The most prominent feature in the plot is a blue wing, 6 km s-1 wide, spanning from to offset positions. At negative offsets the CH3OH emission is dominated by a weak red wing (this is better seen for the 2-1–1-1 E line). Farther away than 25′′ (which corresponds to the southeasternmost clump of outflow B), the emission has contributions from both redshifted and blueshifted emission. This change of behaviour spatially coincides with BIMA 4, located in the p-v plot at an offset position of 20′′.


A clump to the east of outflow B that can be seen in the integrated intensity map shows narrow lines and appears only at systemic velocities (see Figs. 3 and 4). We label this clump, which has not been previously detected, ’methanol eastern clump’.
In addition, there are two redshifted clumps, one associated with BIMA 1, and the other close to the UCH ii region (see, e. g., velocity channels from 13 to 16 km s-1), which probably are part of the redshifted CO (2–1) lobe of outflow A (Beuther et al. 2004a). We label the clump close to the UCH ii region ’methanol western clump’. In Fig. 6, showing the p-v plot along outflow A, we find that there is a velocity gradient, from 4 km s-1 at , to 8 km s-1 at , clearly seen in the two lines. This velocity gradient is centered around the zero offset position (corresponding to mm1). The methanol western clump, seen at , is highly redshifted (line 20–10 A+ is at 9 km s-1) and shows broad red wings, spreading 5 km s-1.
3.3 N2H+
The zero-order moment map integrated for all the hyperfine transitions is presented in Fig. 2b. Figure 3 shows the N2H+ (1–0) spectra at selected positions.
The integrated N2H+ emission consists of a main cloud and a smaller and weaker cloud to the west of the main cloud (western cloud). The size of the main cloud and the western cloud are 50′′ (0.5 pc), and 15′′ (0.15 pc), respectively. The four BIMA sources are located in the main cloud with BIMA 1 close to the N2H+ emission peak. N2H+ emission is marginally detected towards the UCH ii region.
The hyperfine –1 was used for the analysis of the kinematics of the N2H+ emission because it is not blended with the other hyperfines. In Figs. 7 and 8 we show the channel maps and the first and second-order moments for this hyperfine. The channel with maximum intensity was found at the systemic velocity (6.3 km s-1).


The first-order moment map shows a small velocity gradient in the main cloud with increasing velocities roughly from the southwest to the northeast. In addition, there is a filament spatially coincident with outflow B (clearly visible in the 7.1 to 7.7 km s-1 channel maps of Fig. 7), which has very broad lines associated, as seen in the second-order moment map (Fig. 8b). The p-v plot made across outflow B and within the main cloud (Fig. 5b) shows the aforementioned velocity gradient in the main cloud and the line broadening toward outflow B (at offset position zero). The p-v plot along outflow B (Fig. 5c) shows clear line broadening all along the outflow, but without the wing emission component found in the CH3OH emission.
The western cloud appears redshifted, at km s-1, and has narrow lines (Fig. 7). At these velocities, there is weak emission connecting the western cloud with outflow B. Figure 9 shows the p-v plot along a cut at P.A.110°, picking up partially the outflow and the western cloud. From this plot, it seems that the western cloud extends 1′ (0.6 pc) toward the east, intersecting the main cloud.
3.4 NH3
The zero-order moment map of the NH3 (1,1) emission (integrated including the main line and the inner satellites) is shown in Fig. 2c. The overall structure of NH3 (1,1) resembles roughly the emission of the dust and the emission of N2H+. NH3 (1,1) emission is also associated with the main cloud and the western cloud. There is another NH3 (1,1) clump to the northwest (not shown in Fig. 2), which is very weak in N2H+ (in part due to the primary beam attenuation). A difference between N2H+ and NH3 (1,1) emission is that whereas N2H+ peaks close to the millimeter continuum sources, the strongest NH3 (1,1) emission in the main cloud lies in the southeastern part. In addition, the strongest NH3 (1,1) emission over the entire region comes from the western cloud, not from the main cloud. NH3 (1,1) emission toward the UCH ii region is weak.
Figure 2d shows the zero-order moment map of the NH3 (2,2) emission. NH3 (2,2) emission resembles closely that of the NH3 (1,1). However, the main difference with NH3 (1,1) is that the strongest emission of the NH3 (2,2) in the entire region is found very close to BIMA 1. The NH3 (2,2) emission in the western edge of the main cloud shows an extension that encompasses the position of the UCH ii region.
Note that the dense gas traced by NH3 and N2H+ is morphologically very different from the gas traced by CH3OH.
4 Analysis
4.1 Dust
We compared the position of BIMA 1 with the millimeter source found by Beuther et al. (2004b) at 3.5 mm at similar angular resolution. The peak of BIMA 1 is shifted 1′′ to the west of mm1. The values of the peak intensities (Table 2) are in very good agreement with Beuther et al. (2004a), and the flux densities from Table 2 are about 50% larger than those reported in Beuther et al. (2004a). The offset in positions and the larger flux densities detected in this work could be produced by the different spatial filtering of the BIMA and PdBI arrays, with the BIMA array more sensitive to large-scale structures.
The continuum emission at 3.15 mm is probably due to thermal dust emission for most positions of the region, since free-free emission from ionized gas, traced by the continuum emission at 3.6 cm (Fig. 1), is detected only at the western edge of the main cloud, at the position of the UCH ii region. However, Beuther et al. (2004b) find a spectral index between 1.3 and 2.6 mm toward mm1a (the subcomponent to the west of mm1) of 0.8, and suggest that the collimated ionized wind from outflow A could account for such a spectral index. The contribution of the possible free-free emission from mm1a to BIMA 1 is small, given that the intensity of mm1 is five times larger than the intensity of mm1a, and thus essentially all continuum emission at 3 mm is due to thermal dust emission.
To derive masses from the flux densities at 3.15 mm, we corrected the rotational temperature, between 15 and 25 K (calculated from NH3 (1,1) and NH3 (2,2), see § 4.2), to kinetic temperature (Walmsley & Ungerechts 1983), by following Tafalla et al. (2004), yielding kinetic temperatures in the range 17–34 K. The masses (Table 2) are 2 times larger than those obtained by Beuther et al. (2004b) from observations at 3.5 mm. The difference arises from the fact that BIMA is detecting more flux than PdBI observations, and from the different dust temperatures assumed. While Beuther et al. (2004a) assume a dust temperature (derived from a graybody fit to the spectral energy distribution in the entire region) of 56 K, we adopted the kinetic temperatures obtained from the NH3 observations, which allowed us to separate the contribution from each source, thanks to the high angular resolution. The lower temperatures adopted imply larger masses in order to produce the same flux density.
4.2 Rotational temperature and column density maps
We obtained N2H+ and NH3 spectra for positions in a grid of in the main cloud and the western cloud, and fitted the hyperfine structure of each spectrum, or a single Gaussian for NH3 (2,2). We performed the fits only for those spectra with an intensity greater than 5 for NH3 (1,1), and greater than 4 for NH3 (2,2). We set a higher cutoff for NH3 (1,1) to ensure that not only the main line is detected but also the satellites. The results from the fits indicate that the entire main cloud is essentially optically thin for N2H+ (), but optically thick for NH3 (1,1) (). In both cases, the highest opacities are reached in the southeastern side of the cloud, around BIMA 3.
| Position | a | Possible | ||
|---|---|---|---|---|
| (K) | (K) | Counterparts | ||
| 20:31:13.26 | 40:02:58.9 | 2.12 m faint emission (SWSb) | ||
| 20:31:13.23 | 40:03:19.5 | 2.12 m faint emission (NWSb) | ||
| 20:31:13.44 | 40:03:13.4 | IRS 5 | ||
| 20:31:14.96 | 40:03:03.4 | H2 knot c c | ||
-
a
We assumed that each local maximum can be described by a ’gaussian + background level’ model, with the gaussian width and position angle fixed and equal to the synthesized beam. The temperature enhancement, , is defined as the difference between the local maximum and the background level. We considered as significant the temperature enhancements with , with being the uncertainty.
-
b
NWS: Northern Warm Spot; SWS: Southern Warm Spot
-
c
from Kumar et al. (2002).
From the results of the fits to the NH3 (1,1) and the NH3 (2,2) spectra we computed the rotational temperature and NH3 column density maps. We derived the rotational temperature following the standard procedures (Ho & Townes 1983; Sepúlveda 1993), and assuming that the excitation temperature and the intrinsic line width were the same for both NH3 (1,1) and NH3 (2,2). For the NH3 column density derivation, we followed the expression given in Table 1 of Anglada et al. (1995), and assumed that the filling factor was 1.
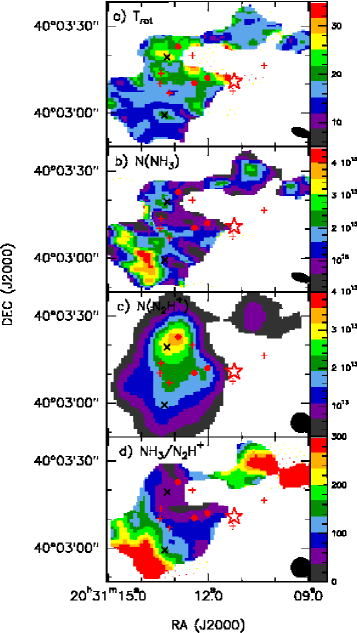
The map of the rotational temperature is presented in Fig. 10a. The maximum value, K, is reached at the position of the UCH ii region. Interestingly, around the apparent dense gas cavity west to BIMA 1, NH3 shows high temperatures, with a maximum of K (the fits to the NH3 (1,1) and NH3 (2,2) at these positions are reasonably good, so this heating must be real). Toward the western cloud we find that temperature is essentially constant, around 16 K, slightly decreasing toward the center of the cloud.
There are some local maxima of rotational temperature in the map. In order to test the significance of these local maxima, we fitted them with a ’gaussian + background level’ model in a region a few times the synthesized beam size, with the gaussian width and position angle fixed and equal to the synthesized beam. We defined the temperature enhancement as the difference between the local maxima and the background level. The rms of the residual image in the fitted region is K, and the positions of the gaussian peaks are within of the local maxima positions. In Table 3 we list the positions of the significant local maxima, their temperature, and temperature enhancement. We considered that a local maxima is significant when the temperature enhancement is at least two times the uncertainty. There is a local maximum that is nearly coincident (within ) with IRS 5, with a value of K. The warmest local maximum is located 5′′ to the southeast of mm1 (labeled as ’Northern Warm Spot’), reaching K, and is apparently associated with faint continuum emission at 2.12 m (see Fig. 1). There is another local maximum associated also with faint emission at 2.12 m, which is found to the southwest of BIMA 3, with K (labeled as ’Southern Warm Spot’). Another local maximum is associated with the H2 knot c (Kumar et al. 2002), lying on the axis of outflow B. Finally, note that there is also some heating about to the southeast of the Northern Warm Spot, but we did not consider this heating in the table because it falls in the edge of the region where we fitted the spectra. Note that all the temperature enhancements in Table 3 have infrared emission associated, giving support to their significance.
Figure 10b shows the resulting column density map for NH3, corrected for the primary beam response. An obvious feature from the NH3 column density map is that the highest values are found to the southeast of the main cloud, where we found the lowest values in the rotational temperature map (Fig. 10a). In the northern part of the cloud the column density is higher around the Northern Warm Spot. It is worth noting that the NH3 column density decreases toward IRS 5. Note also that in the western cloud the column density increases toward the center.
We calculated the N2H+ column density by following Benson et al. (1998), taking into account the opacity effects, and correcting for the primary beam attenuation. In the expression for the column density, the value for was derived from the hyperfine fit made with CLASS, and assuming a filling factor of 1. The resulting map is shown in Fig. 10c. Contrary to NH3, the map of the N2H+ column density has the maximum value very close to the position of the Northern Warm Spot and BIMA 1, and not in the southern side of the main cloud.
4.3 The NH3/N2H+ column density ratio map
In order to compare the NH3 emission with the N2H+ emission, we convolved the NH3 and N2H+ channel maps to obtain a final beam of (the major axis of the NH3 and N2H+ beams). We fitted the spectra in each position of a grid of in the convolved maps, and derived the column density for NH3 and N2H+ following the same procedures outlined above, and correcting for the primary beam of each interferometer. We computed the NH3/N2H+ column density ratio map, and the result is shown in Fig. 10d. From the NH3/N2H+ ratio map, one can see a clear gradient from the northwest of the main cloud, with a ratio around 50, to the southeast, where the ratio reaches values up to 300. Such high values are also reached in the western cloud.
5 Discussion
5.1 General properties of the dense gas
5.1.1 Rotational temperature
The temperature distribution in the main cloud can be clearly separated into two parts: the northern side, with an average temperature of 22 K, and the southern side, with an average temperature of 16 K. It is interesting to note that almost all the YSOs in the region (§ 5.3) are associated with the northern side of the cloud, while in the cold southern side we found very few hints of active star formation. Thus, the higher temperature in the northern side is probably due to internal heating from the embedded YSOs. As for the southern side, the average temperature of 16 K is higher than typical temperatures for low-mass externally heated starless cores (10 K, e. g., Tafalla et al. 2002, 2004). Such higher temperatures could indicate that there are low-mass non-detected YSOs heating the southern side of the main cloud, or that there is external heating. A similar result was found by Li et al. (2003), who derived temperatures of 15 K toward massive (with masses similar to the mass derived for the main cloud, see next paragraph) quiescent cores, with no signs of star formation, in Orion. Li et al. (2003) find that the temperatures of the massive quiescent cores can be well explained by the dust being heated by the external UV field from the Trapezium, at a distance of 1 pc from the massive cores. In our case, the B1 star associated with the UCH ii region (see § 5.3) could be the source of heating of the southern side of the main cloud, at 0.5 pc from the UCH ii region. However, we find no temperaure gradient across the south of the main cloud. Alternatively, the heating could be produced by the nearby O and B stars of the Cygnus OB2 association (Le Duigou & Knödlseder 2002).
5.1.2 Column density and mass
The total mass of gas and dust derived from the dust continuum emission at 3.15 mm, integrated in a region including all the BIMA sources, is 100 (assuming K, and ), about half of the total mass from dust at 1.2 mm observed with the IRAM 30 m by Beuther et al. (2002a, 2005a), 230 . We compared this mass with the mass derived from the high-density tracers. The average NH3 column density for the main cloud, 1.45 cm-2, is similar to the values obtained by Jijina et al. (1999) for starless regions, and the derived average N2H+ column density of 1.21 cm-2 agrees with the N2H+ column densities obtained by Pirogov et al. (2003) for molecular cloud cores with massive stars and star clusters. The mass estimated for the main cloud from NH3 is 340 , assuming an abundance for NH3 of 10-8, and the mass derived from the N2H+ column density map is 75–190 for N2H+ abundances in the range (2–5) (Pirogov et al. 2003; Tafalla et al. 2004). Thus, although the uncertainty in the abundances is certainly affecting the estimation of the mass from NH3 and N2H+ (indeed, there is strong chemical differentiation across the main cloud, see § 4.3), we obtained similar masses from the dense gas tracers and the dust emission. Regarding the western cloud, the derived mass from NH3 and N2H+ lies in the range 11–47 .
5.1.3 Starless core candidates
We identify three starless core candidates in the region: BIMA 3, BIMA 4, and the western cloud. For these three cores, the NH3 column density is high, cm-2, the rotational temperature is low, 14 K, there is no near-infrared emission in the , , and bands of 2MASS, no mid-infrared emission in the 24 m MIPS (Multiband Imaging Photometer for Spitzer333see http://ssc.spitzer.caltech.edu/mips/) band, and no signs of molecular outflows emanating from the cores (see § 5.2 for a discussion on the outflow emission in BIMA 4). Obviously, these cores could harbor low-mass YSOs (with masses , as estimated from the available data) non-detected at millimeter and infrared wavelengths. However, the rotational temperature map of Fig. 10a shows local minima associated with these cores, specially with BIMA 4 and the western cloud, supporting that the heating is external and thus that there is no embedded YSO yet.
It is worth noting that, for the three cores, line widths derived from NH3 (and also N2H+) hyperfine fits are around 1 km s-1 (Table 4), which are considerably larger than typical line widths measured toward starless cores in low-mass star-forming regions, 0.2 km s-1 (see, e. g., Crapsi et al. 2005). For the massive quiescent cores studied by Li et al. (2003) the NH3 line widths were between 0.6 and 0.9 km s-1, similar to what we find. Since the thermal component is around 0.2 km s-1 at 15 K, the line widths that we found suggest that these cores are dominated by turbulence, as Li et al. (2003) state, or that there are important unresolved ( pc) systematic motions.
5.1.4 Effects of chemical abundance and density
The NH3/N2H+ ratio map of Fig. 10d shows a clear gradient in the ratio across the cloud, from northwest, with low values, to southeast, with the highest values. In particular, there seems to be an anticorrelation between the NH3/N2H+ ratio and the evolutionary stage of the sources embedded in the cloud. On one hand, in the north of the main cloud we found most of the YSOs in the field, where the value of the ratio is . On the other hand, the ratio rises up to 300 in the southeastern side of the main cloud and in the western cloud, where we found starless core candidates. The values of the ratio in the entire region are consistent with those derived for low-mass star-forming regions by other authors (Caselli et al. 2002; Hotzel et al. 2004), who also find the same trend of low values (about 60–90) associated with YSOs, and high values (140–190) associated with starless cores.
One could consider whether the high values for the NH3/N2H+ ratio in the southeastern side of the main cloud and in the western cloud are just reflecting the different excitation conditions of NH3 and N2H+, since the critical density of NH3, 104 cm-3 (e. g., Ho 1977), is lower than the critical density of N2H+, 105 cm-3 (e. g., Joergensen 2004), and thus in regions where the density is 104 cm-3, NH3 could be thermalized while N2H+ is faintly detected because not thermalized. We did a rough estimation of the density in the southeastern side of the main cloud from the continuum emission observed at 3.15 mm toward BIMA 3, adopting the mass derived in this work (see Table 2) and a size of 10′′, and obtained a volume density of 105 cm-3. For this density, the transitions of both NH3 and N2H+ are thermalized enough to be detectable. Furthermore, as the effects of opacity and different in the cloud were already taken into account in the calculation of the column densities, the different excitation conditions of NH3 and N2H+ cannot play an important role in the large gradient of one order of magnitude in the NH3/N2H+ ratio across the main cloud.

A possible explanation for the higher NH3/N2H+ ratio toward starless cores may be given in terms of abundance and density. For long-lived (106 yr) cores with moderate densities (– cm-3), there is a ’golden period’ of high abundance for NH3 (Aikawa et al. 2005; S. Viti, private communication), while N2H+ keeps a constant abundance, as has been seen toward starless cores (e. g., Tafalla et al. 2004). This is consistent with the NH3/N2H+ ratio being high in the southern side of the main cloud, where we find starless cores with faint dust emission, indicating that the volume density is moderate. For higher densities (106 cm-3) one may consider two mechanisms to explain the low NH3/N2H+ ratio. On one hand, the high-density cores, which have short free-fall timescales, may not have enough time to produce an amount of NH3 comparable to the southern (moderate-density) cores. On the other hand, the NH3 may start to freeze out onto dust grains, while N2H+ seems to remain unaffected up to densities of 107 cm-3 (Aikawa et al. 2003, 2005). Note that the temperature in the main cloud is on average low enough so that freezing out of NH3 is possible (hot spots are very localized). In the main cloud the highest densities are reached in the northern side, where there is the strongest dust emission. We did a rough estimation of the average volume density toward BIMA 1, from the derived mass and the size (at the 5 contour level) of BIMA 1 (Table 2), and obtained an average volume density toward BIMA 1 of cm-3. Consequently, we find low values of the ratio associated with high volume densities, and thus, with most of the YSOs in the main cloud.
5.2 Interaction of the YSOs with the surrounding gas
5.2.1 The UCH ii region:
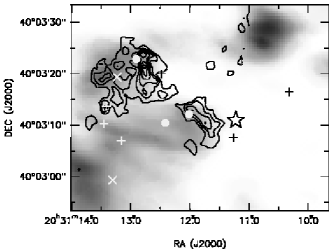
In Fig. 11 we overlay the CN (1–0) emission from Beuther et al. (2004b) on the NH3 (1,1) emission. The morphology of the CN emission next to the UCH ii region is following the edge of the dense cloud traced by NH3 (1,1), and is facing the UCH ii region. CN emission is often found in photon-dominated regions, tracing the part of the molecular cloud which is exposed to an intense flux of FUV photons from a nearby young OB star (see, e. g., Fuente et al. 1993; Simon et al. 1997; Boger & Sternberg 2005). In addition, we found heating toward this edge of the cloud (Fig. 10a), with rotational temperature progressively increasing when approaching the UCH ii region. All this indicates that the UCH ii region is radiatively interacting with the main cloud. The mechanical interaction of the compression front of the UCH ii region with the main cloud is likely traced by the H2 emission at 2.12 m (Kumar et al. 2002; Beuther et al. 2004a), which reveals a ring-like structure around the UCH ii region, of radius 8′′, reaching the edge of the main cloud.
5.2.2 Outflow A:
Beuther et al. (2004a) discovered a highly collimated outflow in CO (2–1) (outflow A), elongated in the northeast-southwest direction, with mm1 being its driving source. The axis of the outflow is shown in Fig. 2.
The velocity gradient seen in CH3OH toward mm1 (see § 3.2 and Fig. 6) is consistent with tracing material entrained by ouflow A. In addition, the p-v plot shows a clump at offset position , the methanol western clump, with wide redshifted wings (see Figs. 3 and 6), and matching well the red lobe of CO (2–1) and the redshifted clump of SiO (2–1) from Beuther et al. (2004b). The methanol western clump appears in the axis of outflow A, just downstream of a weak dust filament that connects IRS 1 and IRS 2 (see Figs. 1 and 2a). This suggests that the interaction of outflow A with the filament sweeps-up and chemically alters the material of the filament, originating the methanol western clump.
The red lobe of outflow A, which starts at mm1, propagates through the cavity apparent in the N2H+ and NH3 zero-order moment maps (see Fig. 2). The rotational temperature and column density maps of Fig. 10 show that the walls of this cavity are characterized by remarkably high temperatures and low column densities. In addition, the NH3 gas of the walls of the cavity is redshifted (as the lobe of outflow A), and shows line broadening. Thus, this cavity could have been excavated by outflow A, and the high temperatures could arise from the shock interaction of outflow A with the walls of the cavity. This has been observed toward other outflows driven by high-mass stars (e. g., AFGL 5142: Zhang et al. 2002).
5.2.3 Outflow B:
Outflow B was first identified by Beuther et al. (2004a) in SiO (2–1), which shows a very strong blue lobe elongated in the northwest-southeast direction, and in CO (2–1), with faint high-velocity blueshifted emission. CH3OH emission from outflow B is morphologically very similar to the SiO (2–1) blue lobe and also splits up into two lobes in a fork-like structure at the position of BIMA 4. A scenario in which outflow B is interacting with a starless core, BIMA 4, naturally explains the partial deflection of the outflow seen in the SiO and CH3OH emission. There are several pieces of evidence that support this scenario. First, the CH3OH emission splits up and has a change in kinematics when it reaches BIMA 4 (§ 3.2). Second, at this position we found some heating and the NH3/N2H+ abundance ratio shows lower values than those in the southern part of BIMA 4 (Fig. 10a,d; temperature enhancement and chemical variations are signatures of shocked molecular gas, e. g., L1157: Bachiller & Pérez Gutiérrez 1997). Third, the N2H+ line broadening along outflow B (which is also observed in NH3) indicates that the outflow is already interacting with the molecular cloud (Fig. 8b). Finally, downstream of BIMA 4, there is heating (see Fig. 10a) associated with the H2 knot c of Kumar et al. (2002). The partial deflection of an outflow due to the interaction with a dense quiescent clump has been found toward other star-forming regions (e. g., IRAS 21391+5802, Beltrán et al. 2002). Interaction of an outflow with a dense flattened NH3 core has been reported too toward NGC 2024 by Ho et al. (1993), where the outflow sweeps the material off the surface of the NH3 core. Similarly, outflow B interacting with the BIMA 4 core could be also sweeping the material off the surface of the core, producing all the observational features described above.
In addition, the properties of the methanol eastern clump (located to the northeast of BIMA 4), which is found at ambient velocities, and with narrow lines (around 1 km s-1, Fig. 3), could be a consequence of the illumination by the UV radiation coming from the interaction of outflow B with BIMA 4. The illumination of the UV radiation from shocks has been proposed as the mechanism of enhancement of the emission of some species in clumps ahead of shocks, in particular of CH3OH and NH3 (see e. g., Torrelles et al. 1992b; Girart et al. 1994, 2002). With the present observations, we were not very sensitive to the NH3 emission toward the methanol eastern clump because the clump is located beyond the VLA primary beam FWHM (see Fig. 2c,d). Typically, such illuminated clumps in low-mass star-forming regions have sizes of 0.05–0.1 pc, and are located at distances to the shock of the order of 0.1 pc (Girart et al. 1998). This is consistent with the methanol eastern clump, which has a size of 0.15 pc, and is located about 0.2 pc from BIMA 4.
It is interesting to note that the morphological features of the dense gas around outflow B are different from outflow A. While outflow A has already cleared up the dense molecular gas, creating a well defined cavity, outflow B is probably in the embrionary phase of creating the cavity. This suggests that possibly outflow B is younger or less energetic than outflow A, in agreement with the measurements of Beuhter et al. (2004a). It is worth noting that the line width of the dense gas associated with outflow B is significantly higher than the thermal line width for both NH3 and N2H+ ( km s-1 compared to km s-1). A similar result is found by Wang et al. (2006) toward massive protostellar cores mapped in NH3 with high angular resolution. Given that we do not observe systematic motions in the dense gas associated with outflow B, we suggest that the large line width in the dense gas is due to turbulence injected by the passage of the outflow (see Fig. 8b).
Regarding the driving source of outflow B, a possible candidate is mm1, as Beuther et al. (2004b) proposed. If this was the case, mm1 would be a binary system of jet sources, since outflow A is clearly associated with mm1. Another possibility would be that BIMA 4 is the driving source of outflow B. However, the kinematics of the gas as traced by CH3OH show that there is no clear symmetry with respect to BIMA 4 (see Fig. 5a: BIMA 4 is at an offset position 20′′). Another candidate of being the driving source of outflow B is the Northern Warm Spot, which is aligned with outflow B, and is located at the begining of the blue lobe of CH3OH. Furthermore, we found a clear symmetry with respect to the Northern Warm Spot in the p-v plot of Fig. 5a (see § 3.2), strongly suggesting that the Northern Warm Spot could be the driving source of outflow B. In § 5.3 we estimate an associated mass of 0.7 for the Northern Warm Spot.
Finally, the interaction of outflow B with the BIMA 4 core leads us to speculate that outflow B could be triggering the collapse in this core, as has been proposed in other regions (e. g., Yokogawa et al. 2003). This would draw a scenario in which a YSO in the north of the main cloud is ’responsible’ for star formation in the south, but should be further investigated by studying in more detail the morphology and kinematics in the core.
5.3 YSOs in the region
5.3.1 Selection of 2MASS sources associated with the region
In order to study the different sources associated with the dense gas found around the UCH ii region, we extracted a sample of stars within the BIMA primary beam from the 2MASS Point Source Catalogue (PSC) (Skrutskie et al. 2006), and plotted a , diagram (Fig. 12). The total amount of infrared sources inside the BIMA primary beam is 43. The color-color diagram shows that there is a bulk of infrared stars at low-to-moderate values of the color indices, which occupy the position of stars with no infrared excess, and a group of stars with high and low colors. We took the criteria of , and spatial coincidence with emission detected in this work to select those 2MASS sources that are possibly (but not necessarily) associated with the dense gas around the UCH ii region. The selected 2MASS sources are labeled as IRS 1, IRS 2 (following the nomenclature of Kumar et al. 2002), and IRS 3 to IRS 6 (increasing RA). These infrared sources (with the exception of those that seem to be background/foreground objects, see below) are listed in Table 4 together with the compact millimeter sources from Beuther et al. (2004b), and the sources found in this work. For each source we show the main properties derived in this work.

5.3.2 Individual YSOs
IRS 1 and the UCH ii region:
From the 2.12 m image provided by Kumar et al. (2002), we find that IRS 1 is probably a binary system separated 3′′, the fainter component being associated with the UCH ii region. The UCH ii region has a flux density of 7.6 m at 3.6 cm (Sridharan et al. 2002; Beuther et al. 2004a), and a deconvolved size of (0.04 pc). This corrresponds to an ionizing flux of 1.5 s-1, typical of stars of spectral type B1 (Panagia 1973). Toward the UCH ii region, we found the highest rotational temperature in the main cloud, and very low column densities, as expected for gas after the passage of an ionization front (see, e. g., Dyson & Williams 1997).
| Positiona | (NH3) c | (NH3) | e | f | ||||||
|---|---|---|---|---|---|---|---|---|---|---|
| Outf b | (km s-1) | ( cm-2) | Ratio d | (K) | (m) | () | ||||
| YSOs | ||||||||||
| IRS 1 | 20:31:11.26 | +40:03:07.6 | NN | - | - | - | - | 3.9 | 0.6 | |
| UCH ii | 20:31:11.22 | +40:03:11.0 | NN | 0.14 | 57 | 4.0 | 0.4 | |||
| IRS 2 | 20:31:10.32 | +40:03:16.5 | NN | - | - | - | 3.5 | 0.5 | ||
| IRS 3 | 20:31:12.48 | +40:03:20.0 | YN | - | - | - | - | 9.5 | 1.4 | |
| IRS 5 | 20:31:13.41 | +40:03:13.7 | ?N | 0.59 | 42 | 5.2 | 1.2 | |||
| mm1 | 20:31:12.9 | +40:03:22.9 | YY | 1.1 | 37 | 28.0g | 4.0 | |||
| mm2 | 20:31:12.01 | +40:03:12.2 | YN | 0.88 | 46 | 8.6g | 1.3 | |||
| mm3 | 20:31:12.41 | +40:03:10.5 | YN | 0.66 | 57 | 3.6g | 0.8 | |||
| NWSh | 20:31:13.23 | +40:03:19.5 | NY | 1.8 | 56 | 3.7 | 0.7 | |||
| SWSh | 20:31:13.26 | +40:02:58.9 | YN | 1.03 | 1.3 | 150 | ||||
| Starless Cores | ||||||||||
| BIMA 3 | 20:31:13.92 | +40:03:00.9 | NN | 5.4 | 290 | 4.0 | 2.2 | |||
| BIMA 4 | 20:31:14.40 | +40:03:07.4 | YY | 3.8 | 180 | 3.5 | 2.0 | |||
| WCloudh | 20:31:10.71 | +40:03:30.3 | NN | 1.03 | 2.8 | 280 | ||||
-
a
Positions correspond to those in the 2MASS PSC for IRS 1 to IRS 5; the centimeter source given by Beuther et al. (2002b) for the UCH ii region; the positions given by Beuther et al. (2004b) for mm1 to mm3; the peak in the rotational temperature map of Fig.10a for the NWS and the SWS, and the position of the peak in the NH3 column density map of Fig.10b for the starless cores.
-
b
High-velocity outflow associated (Y=Yes; N=No): the first character refers to CO from Beuther et al. (2004a), the second character refers to high-velocity CH3OH from this work.
-
c
Line width derived from the fits to the hyperfine structure of NH3(1,1) (see § 4.2).
-
d
Ratio of (NH3) over (N2H+).
-
e
Intensities at 3.15 mm from this work. The rms noise is 0.7 m, and the upper limits for non-detections have been set to 4.
-
f
Associated mass (essentially circumstellar) from the mm continuum emission listed in column (9), assuming a dust emissivity index , and estimating the kinetic temperature from the rotational temperature listed in column (8), following the expression of Tafalla et al. (2004, see § 5.3).
-
g
For mm1, mm2, and mm3 the intensity corresponds to the flux density (in mJy) given by Beuther et al. (2004b).
-
h
NWS: Northern Warm Spot; SWS: Southern Warm Spot; WCloud: western cloud (see Fig. 2b).
IRS 2:
About to the northwest of the UCH ii region, there is the second brightest infrared source in the field, IRS 2, which shows much more infrared excess than IRS 1, as already stated by Kumar et al. (2002). We could not determine a temperature and column density from NH3 toward IRS 2 due to the low S/N of the NH3 emission, but we detected continuum emission at 3.15 mm, and we estimated an associated mass of 0.6 . The high near-infrared flux of IRS 2 suggests that this is an intermediate-mass YSO.
IRS 3:
IRS 3 is the only infrared source with infrared excess falling inside the 2 contour level of BIMA 1. The high angular resolution observations of Beuther et al. (2004b) reveal a weak extension of mm1 toward the southwest reaching the position of IRS 3. From our data, the dense gas emission was too weak to derive a temperature and column density toward this source. Thus, IRS 3 shows strong infrared emission and weak millimeter emission, indicating that IRS 3 is likely a YSO which is clearing up the material in its surroundings.
IRS 5:
IRS 5 falls inside the 7 contour level of the dust ridge (see Fig. 1), in its eastern edge. We found heating associated with IRS 5 (§ 4.2 and Table 3), indicating that this source is physically associated with the main cloud. In addition, the NH3 column density is low (Fig. 10b), and thus IRS 5 could be a protostar in the process of clearing up the surrounding material. Alternatively, the low NH3 column density could be due to depletion of NH3 onto dust grains.
mm1:
mm1 is likely the main contribution to the emission of BIMA 1, since it is the strongest compact millimeter source in the region, and is the driving source of outflow A, which is highly collimated (Beuther et al. 2004a) and elongated in the same direction as BIMA 1 (Fig. 1). In addition, the infrared emission at 2.12 m associated with mm1 is faint and arises mainly from shocked gas (see Fig. 2 of Kumar et al. 2002). The rotational temperature toward mm1 is K (Table 4), and the NH3 column density is rather low, possibly due to depletion of NH3 onto dust grains. From the flux density of Beuther et al. (2004b) at 2.6 mm, we obtain a mass for mm1 of 4.0 , assuming (value estimated by Beuther et al. 2004b), and K (estimated from the rotational temperature derived in this work). All this indicates that mm1, in contrast with IRS 3, is deeply embedded in a massive and not very hot envelope, suggesting that it is an intermediate/high-mass protostar.
mm2 and mm3:
Beuther et al. (2004a) detect two compact millimeter sources inside the 5 contour level of BIMA 2, mm2 and mm3, and they suggest that each one is driving a molecular high-velocity CO (2–1) outflow (outflows C and D), which indicates that mm2 and mm3 are truly protostars, and not heated clumps of dust without any star yet. Taking the flux density from Beuther et al. (2004b) at 2.6 mm, a dust emissivity index , and K and K for mm2 and mm3 respectively ( derived from this work, as in the case of mm1), we estimate associated masses of 1.3 for mm2 and 0.8 for mm3.
The Northern Warm Spot:
The Northern Warm Spot is located about (10000 AU) to the southeast of mm1, and is near a local maximum in NH3 and N2H+ column densities (see Fig. 10b and c). From the millimeter continuum emission we estimated an associated mass of 0.7 (assuming and K). Very close to the warm spot, to the east, there is faint infrared continuum emission at 2.12 m, which is not detected in the and band images of 2MASS, indicating that the source has strong infrared excess. Since there is no H2 line emission at 2.12 m tracing shocked gas (see Fig. 2 of Kumar et al. 2002), the infrared emission is most likely tracing an embedded protostar, and not a condensation heated up by the impact of outflow B. These properties support that the Northern Warm Spot is the driving source of outflow B.
The Southern Warm Spot:
Similar to the NWS, the Southern Warm Spot is found 10′′ to the southwest of BIMA 3 (see §4.2). At this position, the temperature enhancement is very significant (see Table 3), and we also found faint infrared emission associated, present only in the filter of 2MASS, and with no H2 line emission associated. The emission from the continuum at 3.15 mm is below 4, implying an associated mass (assuming K, estimated as in the case of mm1). Furthermore, there is high-velocity blueshifted CO (2–1) emission spatially coincident with the Southern Warm Spot (Beuther et al. 2004a). All this indicates that possibly the heating in the Southern Warm Spot is due to an embedded low-mass YSO.
Background/foreground objects:
In addition to IRS 5, we find two 2MASS sources with infrared excess, IRS 4 and IRS 6, spatially coincident with the dust ridge. IRS 6 is the source with the highest infrared excess among the 2MASS sources in the main cloud, suggesting that it is embedded in gas and dust. The faint source IRS 4 is located only to the southwest of IRS 6, and also shows infrared excess. However, the association of IRS 4 and IRS 6 with the dense gas is not clear from the rotational temperature and NH3 column density maps (Fig. 10a,b), and thus these two infrared sources could be highly extincted background stars or foreground YSOs belonging to the cluster.
Summary:
As seen above, there is a variety of YSOs in the region. The most massive sources seem to be the UCH ii region, IRS 1, and IRS 2. To the east of the massive sources, there is the main cloud of dense gas, where we find seven sources (IRS 3, IRS 5, mm1, mm2, mm3, the Northern Warm Spot and the Southern Warm Spot), which seem to be (proto)stars coming from the same natal cloud. In addition, we found three cores with characteristics similar to starless cores. The sources seem to be in different evolutionary stages, with the infrared sources in the more advanced phases, the millimeter sources with no infrared emission likely being in an earlier stage, and the youngest sources having the properties of starless cores. We do not find different evolutionary stages only between the low-mass sources and the high-mass sources (which are expected because the high-mass sources evolve more rapidly to the main sequence than the low-mass sources), but among the low-mass sources as well, for which we expect similar rates of evolution to the main sequence. For example, IRS 3 and IRS 5 are YSOs strongly emitting in the infrared but with faint millimeter emission, and do not seem to be driving outflows, suggestive of being at the end of the accretion phase. Contrary to this, mm2 and mm3 are YSOs with the millimeter emission much stronger than the infrared emission, and they are the driving sources of collimated outflows, indicative of being in the main accretion phase. The masses of IRS 3 and IRS 5 are difficult to estimate, but comparing with the infrared emission of the known intermediate/high-mass sources one may classify them as low-mass YSOs. The masses of mm2 and mm3, estimated from the millimeter emission, are around 1 . Thus, these low-mass YSOs (IRS 3/IRS 5, and mm2/mm3) seem to be in different evolutionary stages, and we conclude that stars are not forming simultaneously in this cluster environment. Rather, there may be different generations, as found toward other star-forming regions (e. g., NGC 6334: Beuther et al. 2005b; S235A-B: Felli et al. 2006; L1551: Moriarty-Schieven et al. 2006).
5.4 Spatial distribution of the YSOs in the region
In this section we consider whether interaction between the different sources is important in the determination of the spatial distribution of the YSOs. We find that star formation is localized in the north of the main cloud, where there are around six YSOs, while in the south we find sources with properties of starless cores, and only one YSO.
We consider first whether the UCH ii is responsible for such a spatial distribution. In section 5.2 we discussed some evidence of interaction of the UCH ii region with the edges of the main cloud, mainly with BIMA 2. This suggests that mm2 and mm3 could have been triggered by the UCH ii region. If this was the case, one would expect to find some evidence of a compression front expanding away from the UCH ii region. In the p-v plot of Fig. 9, the N2H+ emission shows the shape of an incomplete ring, which could be interpreted as an incomplete expanding shell. However, the velocity field as seen from N2H+ in Fig. 8b does not show any radial symmetry with respect to the UCH ii region, and the presence of outflow B makes difficult to disentangle the advance of any compression front. In addition, the formation of the YSOs in the northeast of the main cloud is not likely due to triggering by the UCH ii region, since they are located farther away than mm2 and mm3 and are not in earlier evolutionary stages. Therefore, triggering by the UCH ii region does not seem to be the dominant agent causing star formation in this clustered environment.
Another possibility for the formation of the YSOs in the north of the main cloud could be a merging of the main cloud with the western cloud. In Fig. 9, we found that the western cloud has an extension intersecting the main cloud, seen at velocities km s-1 in the channel maps (Fig. 7). Merging of two clouds has been proposed as a mechanism to trigger star formation in other regions, (Wiseman & Ho 1996; Girart et al. 1997; Looney et al. 2006; Peretto et al. 2006). Note however that no further evidence of such a merging (heating, line broadening, two clear velocity components across the main cloud) is seen associated with the extension of the western cloud, and thus the merging scenario is not fully consistent with our data.
We therefore conclude that the spatial distribution of the YSOs in this cluster environment could simply reflect the initial conditions of the cloud: if the main cloud was originally much denser in the north than in the south, we would possibly observe a similar situation to what we have found.
6 Conclusions
We observed with the BIMA and VLA arrays the continuum emission at 3.15 mm, and the N2H+, NH3, and CH3OH emission toward IRAS 20293+3952, a region in which star formation is taking place in a closely-packed environment. Our main conclusions can be summarized as follows:
-
1.
The dense gas traced by N2H+ and NH3 shows two different clouds, one to the east of the UCH ii region (main cloud), of 0.5 pc of size and 250 , and another cloud to the northwest (western cloud), of 0.15 pc and 30 , and redshifted with respect to the main cloud. The dust emission reveals two strong components in the northern side of the main cloud, BIMA 1 and BIMA 2, and two fainter components in the southern side, BIMA 3 and BIMA 4, together with extended dust emission forming a common envelope. Regarding the CH3OH, we found strong emission in a fork-like structure associated with outflow B from Beuther et al. (2004a), as well as two CH3OH clumps associated with outflow A.
-
2.
We found that the rotational temperature is higher in the northern side of the main cloud, around 22 K, than in the southern side, around 16 K. In contrast, the NH3 column density has the highest values in the south of the main cloud. The N2H+ column density distribution resembles the dust emission, strong in the northern side of the main cloud. We found three local temperature enhancements which seem to be associated with embedded YSOs, one of them associated with a 2MASS source, and the other two, the Northern Warm Spot and the Southern Warm Spot, associated with faint continuum infrared emission at 2.12 m.
-
3.
There is strong chemical differentiation in the region. In particular, we found low values of the NH3/N2H+ ratio, 50, associated with YSOs, and high values, up to 300, associated with starless cores. This is consistent with NH3 being enhanced with respect to N2H+ at moderate densities ( cm-3), while at densities around 106 cm-3 the NH3 enhancement may be less important (due to shorther lifetimes of the cores), and additionally the effects of NH3 depletion may start to play a role.
-
4.
We identified three cores in the NH3 column density map, with low temperatures and with no infrared emission associated, similar to starless cores in low-mass star-forming regions, but with temperatures slightly higher, 15 K, possibly due to external heating from the nearby OB stars. These are associated with BIMA 3, BIMA 4, and the western cloud.
-
5.
Interaction between the different sources in the region is important. First, the UCH ii region is interacting with the main cloud heating and enhancing the CN (1–0) emission in the edge of the main cloud that is facing the UCH ii region. Second, one of the outflows in the region, outflow A, seems to be excavating a cavity and heating its walls. Third, another outflow in the region, outflow B, is interacting with the BIMA 4 starless core, likely producing the deflection of the outflow seen at this position. Such a shock could be illuminating a clump with narrow CH3OH lines located 0.2 pc to the northeast of the shock. We propose that the Northern Warm Spot may contain the driving source of outflow B. The properties of the molecular gas around the outflows suggest that outflow A is more energetic and/or older than outflow B.
-
6.
There are about eight YSOs in the dense gas near the UCH ii region. For the YSOs for which we could estimate the associated circumstellar mass, we found values ranging from to 4 . In addition, the YSOs seem to be in different evolutionary stages, even if we consider only the low-mass sources. Thus, stars do not seem to form simultaneously in this cluster environment.
-
7.
While we cannot discard that interaction between the different sources may have triggered star formation in particular cases, triggering cannot explain the overall spatial distribution of the YSOs, suggesting that this may be essentially determined by the initial conditions in the cloud.
Acknowledgements.
A. P. is grateful to M. S. Nanda Kumar for providing us the H2 images, to Maite Beltran and Rosario López for help in technical aspects of this paper, to Serena Viti for chemistry modeling, and to Oscar Morata and the anonymous referee, whose comments and discussions significantly improved the clarity of the paper. The authors A. P., R. E., and J. M. G. are supported by a MEC grant AYA2005-08523 and FEDER funds. H. B. acknowledges financial support by the Emmy-Noether-Program of the Dutsche Forschungsgemeinschaft (DFG, grant BE2578). This publication makes use of data products from the Two Micron All Sky Survey, which is a joint project of the University of Massachusetts and the Infrared Processing and Analysis Center/California Institute of Technology, funded by the National Aeronautics and Space Administration (NASA) and the National Science Foundation.References
- (1) Aikawa, Y., Herbst, E., Roberts, H., & Caselli, P. 2005, ApJ, 620, 330
- (2) Aikawa, Y., Ohashi, N., & Herbst, E. 2003, ApJ, 593, 906
- (3) Anglada, G., Estalella, R., Mauersberger, R., et al. 1995, ApJ, 443, 682
- (4) Bachiller, R., & Pérez Gutiérrez, M. 1997, IAUS, 182, 153
- (5) Beltrán, M. T., Girart, J. M., Estalella, R., Ho, P. T. P., & Palau, A. 2002, ApJ, 573, 246
- (6) Benson, P. J., Caselli, P., & Myers, P. C. 1998, ApJ, 506, 743
- (7) Bernasconi, P. A., & Maeder, A. 1996, A&A, 307, 829
- (8) Beuther, H., Schilke, P., Menten, K. M., et al. 2002a, ApJ, 566, 945
- (9) Beuther, H., Schilke, P., Menten, K. M., et al. 2005a, ApJ, 633, 535
- (10) Beuther, H., Walsh, A., Schilke, P., et al. 2002b, A&A, 390, 289
- (11) Beuther, H., Schilke, P., & Gueth, F. 2004a, ApJ, 608, 330
- (12) Beuther, H., Schilke, P., & Wyrowsky, F. 2004b, ApJ, 615, 832
- (13) Beuther, H., Thorwirth, S., Zhang, Q., et al. 2005b, ApJ, 627, 834
- (14) Boger, G. I., & Sternberg, A. 2005, ApJ, 632, 302
- (15) Caselli, P., Benson, P., Myers, P. C., & Tafalla, M. 2002, ApJ, 572, 238
- (16) Crapsi, A., Caselli, P., Walmsley, C. M., et al. 2005, ApJ, 619, 379
- (17) Dyson, J. E., & Williams, D. A. 1997, in The Physics of the Interstellar Medium, eds. R. J. Tayler, & M. Elvis, The Graduate Series in Astronomy
- (18) Felli, M., Massi, F., Robberto, M., & Cesaroni, R. 2006, A&A, astro-ph/0603818
- (19) Fuente, A., Martín-Pintado, J., Cernicharo, J., & Bachiller, R. 1993, A&A, 276, 473
- (20) Garay, G., & Lizano, S. 1999, PASP, 111, 1049
- (21) Girart, J. M., Estalella, R., Anglada, G., et al. 1997, ApJ, 489, 734
- (22) Girart, J. M., Estalella, R., & Ho, P. T. P. 1998, ApJ, 495, L59
- (23) Girart, J. M., Rodríguez, L. F., Anglada, G., et al. 1994, ApJ, 435, L145
- (24) Girart, J. M., Viti, S., Williams, D. A., Estalella, R., & Ho, P. T. P. 2002, A&A, 388, 1004
- (25) Hester, J. J., & Desch, S. J. 2005, in Chondrites and the Protoplanetary Disk, eds. A. N. Krot, E. R. D. Scott, & B. Reipurth, p. 107, San Francisco: Astronomical Society of the Pacific,
- (26) Hillenbrand, L. A. 1995, PhD Thesis, University of Massachusetts
- (27) Hillenbrand, L. A., & Hartmann, L. W. 1998, ApJ, 492, 540
- (28) Ho, P. T. P. 1977, PhD Thesis, Massachusetts Institute of Technology
- (29) Ho, P. T. P., Peng, Y.-L., Torrelles, J. M., et al. 1993, ApJ, 408, 565
- (30) Ho, P. T. P., & Townes 1983, ARA&A, 21, 239
- (31) Hotzel, S., Harju, J., & Walmsley, C. M. 2004, A&A, 415, 1065
- (32) Jijina, J., Myers, P. C., & Adams, F. C. 1999, ApJSS, 125, 161
- (33) Joergensen, J. K. 2004, A&A, 424, 589
- (34) Kumar, M.S.N., Bachiller, R., & Davis, C.J. 2002, ApJ, 576, 313
- (35) Le Duigou, J.-M. & Knödlseder, J. 2002, A&A, 392, 869
- (36) Li, D., Goldsmith, P. F., & Menten, K. 2003, ApJ, 587, 262
- (37) Looney, L. W., Wang, S., Hamidouche, M., Safier, P. N., & Klein, R. 2006, astro-ph/0601437
- (38) McCaughrean, M. J., & Stauffer, J. R. 1994, AJ, 108, 1382
- (39) Moriarty-Schieven, G. H., Johnstone, D., Bally, J., & Jenness, T. 2006, ApJ, 641, astro-ph/0512351
- (40) Panagia, N. 1973, AJ, 78, 929
- (41) Peretto, N., André, P., & Belloche, A. 2006, A&A, 445, 979
- (42) Pirogov, L., Zinchenko, I., Caselli, P., Johansson, L. E. B., & Myers, P. C. 2003, A&A, 405, 639
- (43) Sault, R. J., Teuben, P. J., & Wright, M. C. H. 1995, in ASP Conf. Ser. 77, Astronomical Data Analysis Software and Systems IV, ed. R. A. Shaw, H. E. Payne, & J. J. E. Hayes (San Francisco: ASP), 433
- (44) Sepúlveda, I. 1993, Master Thesis, University of Barcelona
- (45) Simon, R., Stutzki, J., Sternberg, A., & Winnewisser, G. 1997, A&A, 327, L9
- (46) Skrutskie, M. F., Cutri, R. M., Stiening, R., et al. 2006, AJ, 131, 1163
- (47) Sridharan, T. K., Beuther, H., Schilke, P., Menten, K. M., & Wyrowski, F. 2002, ApJ, 566, 931
- (48) Tafalla, M., Myers, P. C., Caselli, P., & Walmsley, C. M. 2004, A&A, 416, 191
- (49) Tafalla, M., Myers, P. C., Caselli, P., Walmsley, C. M., & Comito, C. 2002, ApJ, 569, 815
- (50) Testi, L., Palla, F., Natta, A. 1998, A&ASS, 133, 81
- (51) Testi, L., Palla, F., Natta, A. 1999, A&A, 342, 515
- (52) Testi, L., Palla, F., Natta, A. 2000, in From Darkness to Light, T. Montmerle & P. André eds., ASP Conference Series
- (53) Torrelles, J. M., Rodríguez, L. F., Cantó, J., et al. 1992, ApJ, 396, L95
- (54) Walmsley, C. M., & Ungerechts, H. 1983, A&A, 122, 164
- (55) Wang, Y., Wu, Y., Zhang, Q., Mao, R.-Q., & Miller, M. 2006, accepted by A&A
- (56) Wiseman, J. J., & Ho, P. T. P. 1996, Nature, 382, 139
- (57) Yokogawa, S., Kitamura, Y., Momose, M., & Kawabe, R. 2003, ApJ, 595, 266
- (58) Zhang, Q., Hunter, T. R., Sridharan, T. K., & Ho, P. T. P. 2002, ApJ, 566, 982