Quasar Metal Abundances & Host Galaxy Evolution
Abstract
Quasars signal a unique phase of galaxy evolution – when massive spheroids are rapidly being assembled, forming stars and growing their central super-massive black holes. Measurements of the metal abundances around quasars provide unique information about these complex evolutionary processes. Here we provide a brief review of the current status and implications of quasar abundance research.
University of Florida
The Ohio State University
University of Kentucky
1. Goals & Motivation
The central goal of quasar abundance studies is to understand the evolutionary relationship between quasars, super-massive black holes (SMBHs) and their host galaxies. We know that a close relationship exists because dormant SMBHs are not only common in galactic nuclei today, but their masses, , scale directly with the mass of the surrounding galactic spheroids, , (e.g., Tremaine et al. 2002). Whatever processes created the galactic spheroids must have also (somehow) created central SMBHs with commensurate mass. Luminous quasars represent the final major growth stage(s) of the most massive SMBHs inside the most massive galaxies. The quasar phase is very brief, of order yr, but it coincides with a critical stage of SMBH–galaxy evolution when galactic spheroids are still rapidly being assembled and making stars. The energy output from accreting black holes might, in fact, regulate that star formation and thus lead naturally to the observed – correlation (Kauffmann & Haehnelt 2000, Granato et al. 2004).
Quasar abundance studies can help us understand better the complex evolutionary relationship between SMBHs and their host galaxies. For example, how much star formation (how much conversion of the initial gas into stars) occurs in galactic spheroids before the visible quasar epoch? Did the major star-forming episodes occur before, during or after the final luminous stages of SMBH growth? Is the relative timing of these events consistent with quasars triggering star formation, shutting it down, or having no affect at all? How much do outflows during the quasar epoch contribute to the distribution of metals to the surrounding galactic environments? Are the enrichment processes near quasars consistent with normal galactic chemical evolution, or do they require more exotic processes? Perhaps there are not single answers to these questions. A range of measured abundance results might imply a range of evolutionary/enrichment circumstances. On a more basic level, the gas-phase metal abundances can affect important aspects of quasar physics. For example, do higher metallicities (and thus higher opacities) lead to higher mass loss rates or gas ejection speeds from the central AGN?
Reviews of quasar abundance work were given previously by Hamann et al. (2004) and Hamann & Ferland (1999, hereafter HF99). Here we provide a very brief overview and an update on recent developments.
2. Metallicity Diagnostics & Results
We can infer the elemental abundances near quasars from a variety of spectroscopic observations. Each provides unique information. Each has limitations and uncertainties. It is important to consider all of them.
2.1. Broad Emission Lines
One great advantage of the broad emission lines (BELs) for quasar abundance work is that they are relatively easy to measure in large numbers of objects. The first quantitative studies of BELs concluded that the metallicities are consistent with solar, with large ( dex) uncertainties (e.g., Shields 1976, Davidson & Netzer 1979, Uomoto 1984). These studies had to deal with a problem that is pervasive in emission line analysis. The lines cool the gas where they form and, therefore, the total flux in all lines depends on the energy balance between heating and cooling and not (directly) on the metallicity. In practice, this means we cannot simply use the strength of a prominent metal line such as CIV 1549 compared to a hydrogen line like Ly to infer the C/H abundance ratio. However, as the metallicity goes up and the gas temperature goes down (which keeps the total line flux constant), some of the relative line strengths do change. In addition, variations in the relative metal abundances can change specific line ratios as different lines carry a different share of the cooling (see Ferland et al. 1996, Hamann et al. 2002).
Shields (1976) noted that the relative abundance of nitrogen scales with metallicity in galactic stars and H II regions as N/O O/H (also Pilyugin et al. 2003). Therefore, quasar BEL ratios like N III] 1750/O III] 1663 or N III]/C III] 1909 can be used to infer the metallicities because of their sensitivity to the N/O and N/C abundances. Shields (1976) chose to work with these relatively weak intercombination lines to avoid saturation and thermalization problems that might affect strong permitted lines. However, reverberation studies beginning in the 1980s showed that BEL region (BELR) densities are higher than previously believed (Ferland et al. 1992), and therefore the intercombination lines probably all form near their critical densities. Saturation and thermalization issues are unavoidable, but by the 1990s spectral simulations were up to the task.
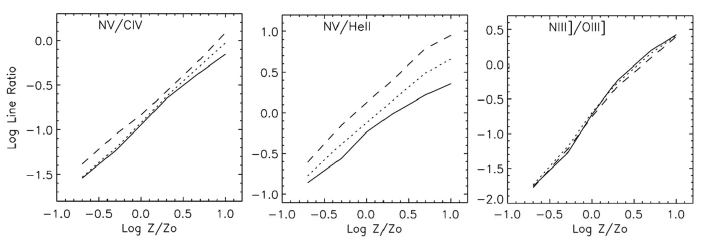
In a series of papers, Hamann & Ferland (1992, 1993), Ferland et al. (1996) and HF99 performed extensive calculations with Gary Ferland’s photoionization code CLOUDY to show that some of the stronger permitted line ratios, such as N V 1240/C IV and N V/He II 1640, are also sensitive to the metallicity if nitrogen behaves as a secondary element. Hamann et al. (2002) then extended that work to the Locally Optimally-emitting Cloud (LOC) model of the BELR (Baldwin et al. 1995). The LOC calculations are more realistic because they consider a stratified BELR, where clouds with a wide range of densities and incident fluxes all coexist. Each line forms preferentially wherever its emission is most favored, and the observed spectrum is the sum over many diverse BELR components. Hamann et al. (2002) used this model to calculate BEL strengths and ratios for a range of metallicities while scaling N/O O/H. Figure 1 shows some of their results. In one particular quasar at , having many well-measured BELs, Warner et al. (2002) used this analysis to derive Z⊙. Figure 2 shows similar results for a sample of 70 luminous high-redshift quasars (Dietrich et al. 2003). The average BEL metallicity inferred for that sample is Z⊙. In the highest redshift quasar yet studied, at , Pentericci et al. (2002) estimated based on a measurement of N V/C IV and a lower limit on N V/He II.
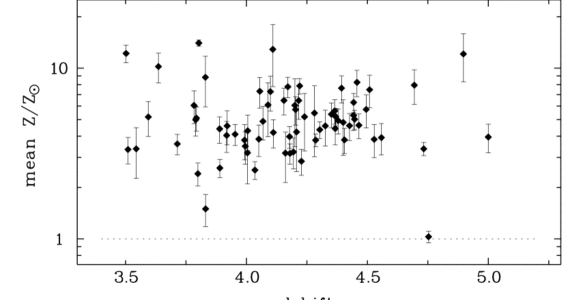
More recently, Nagao et al. (2006a) took the LOC abundance analysis one step farther. They included more UV line ratios and found the best overall fits to composite quasar spectra (sorted by redshift or luminosity) by varying both and the relative numbers of clouds with different physical parameters in the LOC calculations. The key advantages to this approach are i) less dependence on the assumed N/O O/H scaling, and ii) specific fits to each quasar/composite spectrum. It is reassuring that their analysis of 5000 SDSS quasar spectra yields results nearly identical to the previous studies (e.g., Figure 2).
2.2. Narrow Emission Lines
Narrow emission lines (NELs) can provide a valuable test of the BEL results, although it is important to keep in mind that quasar NELs form much farther from the central engines, 102 to 104 pc away compared to 1 pc for the BELs. The well-known NELs at rest-frame visible wavelengths have not yet been used to estimate abundances in high-redshift quasars because they are shifted into the near-IR and are thus more difficult to measure. However, there have been several studies of these lines in low-redshift AGN. For example, Groves et al. (2006) used photoionization models and standard line ratios such as [O III] 5007/H and [N II] 6583/H to infer NEL region metallicities for 23,000 Seyfert 2s in the SDSS database. They adopt a single set of physical parameters for the entire sample and, remarkably, find that all but 40 of the 23,000 sources (99.8%) have . The typical metallicity is roughly 2–4 . These results are consistent with eariler NEL studies that applied similar analysis to much smaller samples (Storchi Bergmann & Pastoriza 1989, Storchi Bergmann et al. 1998, Groves et al. 2004).
Nagao et al. (2006b) took a different approach to the NEL analysis. They examined high-redshift AGN that have only narrow lines (e.g., QSO 2s and narrow-line radio galaxies) so they could measure the same rest-frame UV lines used in the BEL analysis. They found a wider range of NEL metallicities than Groves et al. (2006), from 0.2 to 5 , and they note that the results depend on the assumed the gas density. Both Groves et al. (2006) and Nagao et al. (2006b) performed 1-zone spectral synthesis calculations and used the same N/O O/H scaling as Hamann et al. (2002).
2.3. Associated Absorption Lines
Quasar absorption lines provide another opportunity to measure the element abundances. Most of the work in this area has been on the narrow “associated” absorption lines (AALs, near the emission redshifts) because i) most of them are physically related to the quasar or its host galaxy (e.g., Nestor et al., this proceedings), and ii) the line profiles are narrow enough to resolve important doublets, such as C IV 1548,1551, and thereby diagnose potential saturation problems. In principle, the absorption line analysis is much simpler than the emission lines because one needs only to measure the ionic column densities and apply ionization corrections to derive abundance ratios. No assumptions about secondary N are needed. In practice, however, the ionization corrections can be uncertain and the absorber geometries can be complex (e.g., with partial coverage of the background emission source, see Hamann 1997 and Hamann et al. 2004, Gabel et al. 2006). One also has to take care in interpreting the AAL results because the lines can form in a wide range of locations, often poorly known but ranging from winds very near the quasars to extended halo gas 100 kpc distant (Simon et al. 2007, this proceedings).
Progress with the absorption lines has been slow because it requires high resolution spectra obtained with large telescopes. The first reliable studies in the 1990s found typically with N/C also enhanced, consistent with the emission line data (see HF99 and refs. therein). More recent studies find similar results. For example, D’Odorica et al. (2004) carefully selected quasars measured with the UVES echelle spectrograph at the VLT (7 km/s resolution) to estimate AAL abundances in six well-measured quasars at redshifts between 2.1 and 2.6. Five of these six have = 1 to 3 Z⊙. The current state of the art in this analysis is illustrated by Gabel et al. (2006), who estimated to be several times solar with nitrogen 2 to 3 times more enhanced in a quasar at redshift 2.2 (see also Arav et al. 2007). The absorption line data thus continue to support the emission line results. In one study that compares directly the AAL and BEL data, Kuraszkiewicz & Green (2002) showed the ratios of N V/C IV line strengths in emission and absorption correlate with each other in a sample of 17 low-redshift quasars.
3. How Much Metal-Rich Gas Is There?
There are two important questions not addressed directly by the quasar metallicity data: How much metal-rich gas is present near quasars, and what stellar populations enriched this gas? We could start by looking at the mass of gas in the BELRs, . LOC models indicate that luminous quasars have typically M⊙ (Baldwin et al. 2003). However, this is an extreme lower limit to the total mass of metal-rich gas, , because BELRs are dynamic regions that are probably continuously replenished by material discharged from the accretion disk. The total reservoir of gas sampled by the BELR during a quasar’s lifetime is therefore the total mass of matter accreted through the disk, roughly M⊙. This is still just a lower limit to , however, because not all of the metal-rich gas around quasars will funnel through the accretion disk. Therefore the mass in metal-rich gas is . The stellar populations needed to enrich this gas to super-solar levels should have even larger masses, nominally few (for standard stellar yields and initial mass functions). We conclude that stellar populations with mass few M⊙ are already present or perhaps still rapidly forming when luminous quasars become optically observable.
4. Other Enrichment/Star Formation Indicators
Molecular line and far-IR through mm continuum observations can also probe the gas-phase metal abundances and stellar populations near quasars. For example, Cox et al. (2006) estimate that 30% of high-redshift optically luminous quasars qualify as Ultra-Luminous Infrared Galaxies (ULIRGs) based on their rest-frame far-IR and sub-mm luminosities (also Beelen et al. 2006). These sources have enourmous star formation rates of order 1000 M⊙/yr, assuming the IR luminosity is not powered by the quasars. (There is evidence that this is so when the observed far-IR/radio flux ratios are similar to nearby starbursting galaxies without AGN.)
These are important constraints on the rates of star formation that can be coincident with the brief visible quasar phase. But another important constraint is often overlooked. The observed masses of CO or FIR-emitting dust directly constrain the amount of star formation that preceded the quasar epoch. For example, the dust masses inferred from the studies mentioned above are typically to M⊙, which corresponds to total masses in metal-rich gas of (/Z⊙) to (/Z⊙) M⊙, where /Z⊙ is the normalized metallicity. To create these huge amounts of metals, there must be correspondingly massive stellar populations already in place before the observed quasar epochs. With nominal stellar yields and initial mass functions, the mass in stars already formed around these high-redshift quasars should be roughly few to M⊙.
5. Trends with , , or Host Galaxy Properties
One important result from quasar metallicity work is that there is no significant trend with redshift. This can be seen, for example, in Figure 2 and in other BEL studies that span a wider range in (HF99, Dietrich et al. 2003, Nagao et al. 2006a). There are far fewer results available from quasar absorption lines, but they too show no apparent trend with redshift. BEL studies do, however, indicate that there is a strong trend (apparently at every redshift) for larger nitrogen line ratios (higher metallicities) in more luminous quasars (HF99, Warner et al. 2003, Nagao et al. 2006a).
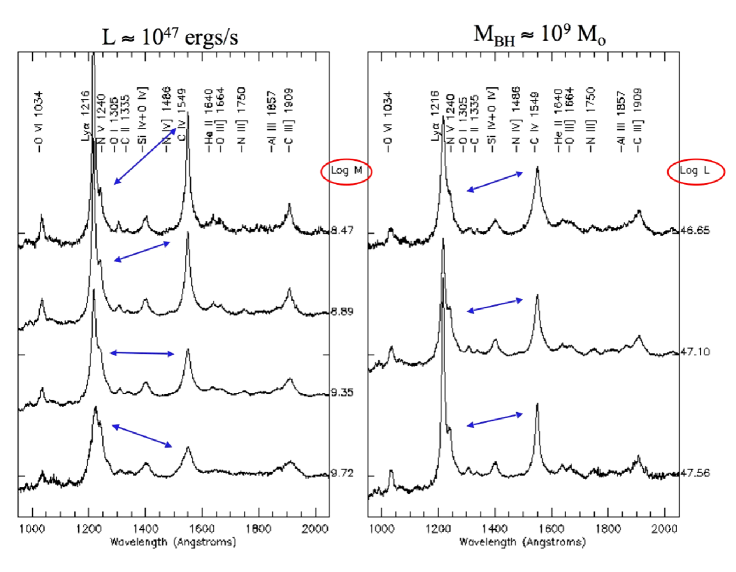
What is the physical basis for this – relationship? Shemmer et al. (2004) examined the N V/C IV BEL ratios in a sample of 92 AGN which had H available to measure SMBH masses. They found that the N V/C IV line ratio correlates more strongly with the normalized accretion rate, , than it does with or . The sense of the relationship is for higher metallicities at larger . Shemmer et al. speculate that this trend might be indicative of higher at earlier evolutionary stages, when perhaps , and the star formation rates are all larger.
In a similar study, Warner et al. (2003, 2004, 2007) examined the nitrogen BEL ratios and used C IV to derive MBH in a sample of 578 AGN. They do not find a significant relationship to , but instead find a strong trend for increasing metallicity with SMBH mass. (This departure from the Shemmer et al. 2004 is not understood, but it might derive from differences in their quasar samples.) To isolate the dependences on and , Warner et al. (2007) examined quasar sub-samples that span i) a range in at nearly constant , and ii) a range in at nearly constant . The main results are shown in Figure 3. There is a strong trend for increasing nitrogen BEL ratios (metallicity) with larger even when is held fixed. But there is no trend at all with if is constant. Warner et al. attribute this underlying – correlation to a mass–metallicity trend in quasar host galaxies. More massive SMBHs reside in more massive spheroids, which characteristically have higher metallicities (Trager et al. 2000a). In fact, Warner et al. (2003) showed that the slope of the – relationship in their quasar sample roughly mimics the slope in the galactic mass–metallicity relation. Further evidence for a mass–metallicity trend in AGN comes from the Groves et al. (2006) study of low-redshift Seyfert 2 galaxies (§2.2). They inferred host galaxy masses directly from the SDSS imaging data and found that the more massive galaxies contain systematically more metal-rich NEL regions.
6. Implications for SMBH–Host Galaxy Evolution
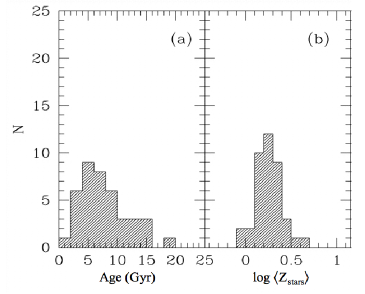
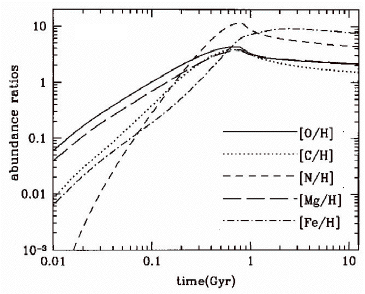
What do the results for Z⊙ near quasars tell us about the coupled evolution of galaxies and SMBHs? The first thing to realize is that the quasar metallicities are consistent with normal galactic chemical evolution. In particular, the stars in massive spheroids today are mostly old and metal rich. They formed typically 2–12 Gyr ago and attained mean metallicities near their cores of –3 Z⊙ (e.g., Figure 4). These are the environments that today contain high-mass SMBHs and were once active quasar hosts. Most of the star formation occurred abruptly, within 0.5 Gyr, based on sub-solar ratios of Fe/-element abundances in the present-day stars. Near the end of the main star-forming epoch, the gas that created these stars must have had metallicities and quite possibly 2 to 3 times higher. Figure 4 shows a simple chemical evolution model that illustrates the essential features (Friaca & Terlevich 1998). In this typical simulation, the star formation is nearly complete (with 70% of the initial converted into stars) after just 0.5 Gyr when Z⊙. Nitrogen is selectively enhanced by secondary enrichment.
Quasar abundance data provide important new information. In particular, the preponderance of metal-rich quasars, and the large masses of dust or CO found near some of them, mean that the star-formation in galactic spheroids was largely complete, or at least well underway, when the central quasars became visibly luminous objects. The quasar data also support the idea that more massive galaxies have more extensive star formation (converting more of their gas into stars), leading to higher metallicities, e.g., in their central regions.
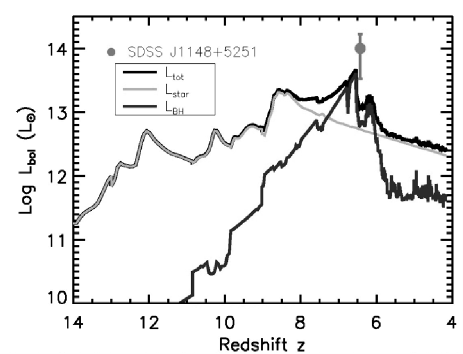
These quasar results agree well with recent physically-motivated models of galaxy–SMBH evolution that try, in particular, to explain the observed relationship (Kauffmann & Haehnelt 2000, Granato et al. 2004, DiMatteo et al. 2004, Hopkins et al. 2005, Springel et al. 2005). In those models, major mergers of gas-rich proto-galaxies trigger enormous bursts of star formation and funnel gas towards a central SMBH. Feedback from the growing SMBH, and to a lesser extent supernovae in the starburst, eventually halts the star formation and produces the correlation. The central SMBH is under-luminous and obscured by dust during the early stages. It appears to us as a visibly luminous quasar only after the major starburst phase. The models predict gas-phase metallicities near the quasars of typically 2–3 Z⊙. Figure 5 shows the results of one particular simulation compared to the highest redshift quasar known to date, at (Li et al. 2006). In this extreme case, multiple mergers lead to a total star formation rate that briefly exceeds M⊙/yr at and creates a total stellar mass of M⊙ before the quasar begins to dominate the luminosity and emerge as a visibly bright object at . The final black hole mass is M⊙.
7. Summary & Future Prospects
The main results are the following. 1) Quasar environments are metal-rich, with typically –5 Z⊙, at all observed redshifts. 2) They were enriched by stellar populations with at least Galactic bulge-like stellar masses. 3) The major star-forming episodes in galactic spheroids must have occurred before the observed quasar epochs, probably with most of the stellar mass involved in the – relation already in place when quasars first appear as a visibly luminous objects. 4) The ensemble results support an evolutionary sequence like this: major merger ULIRG/starburst possible transition object (declining star formation rate or partially obscured AGN) visible quasar. They are also consistent with the idea that SMBH activity halts the star formation and thus leads to the observed – relation. 5) Quasars in more massive hosts are more metal-rich, consistent with a normal galactic mass–metallicity relation with perhaps an additional dependence on related to the quasar’s age.
More work is clearly neeeded. For example, 1) we need more measurements of AAL and NEL abundances, e.g., at high redshifts, to test the current BEL results. 2) We should compare quasar abundance data directly to host galaxy properties, such as mass, age and metallicity of the stellar populations, to understand better the evolutionary sequence of merger-to-quasar outlined above. 3) Transition objects (with stronger FIR/sub-mm emission or perhaps redder quasar spectra) deserve more attention because they might represent a unique evolutionary phase with younger or more obscured AGN inside younger galaxies. 4) Larger data samples are needed to probe further the relationships of quasar abundances and associated star formation with mass and . Finally, 5) measurements of specific element ratios in quasars, most notably Fe/, will provide more information on the nature and timescales of the star formation and chemical enrichment.
Acknowledgments.
This work was supported by grants from the National Science Foundation (AST99-84040) and STScI (GO-09871.02).
References
Arav, N., et al. 2007, ApJ, in press
Baldwin, J.A., et al. 2003, ApJ, 582, 590
Baldwin J., Ferland G., Korista K.T., & Verner D. 1995, ApJ, 455, L119
Beelen, A., et al. 2006, ApJ, 642, 694
Cox, P., et al. 2006, in “The Dusty and Molecular Universe,” ESA SP-577, 115
Davidson, K., & Netzer H. 1979, Rev. Mod. Physics, 51, 715
Dietrich, M., Hamann, F., et al. 2003, 589, 722
DiMatteo, T., et al. 2004, ApJ, 610, 80
D’Odorico, V., et al. 2004, MNRAS, 351, 976
Ferland, G. J., et al. 1992, ApJ, 387, 95
Ferland, G. J., et al. 1996, ApJ, 461, 683
Friaça, A.C.S. & Terlevich, R.J. 1998, MNRAS, 298, 399
Gabel, J. R., Arav, N., & Kim, T.-S. 2006, ApJ, 646, 742
Granato, G. L., et al. 2004, ApJ, 600, 580
Groves, B., Heckman, T. M., & Kauffmann, G. 2006, MNRAS, 371, 1559
Hamann, F. 1997, ApJS, 109, 279
Hamann, F., & Ferland, G. J. 1992, ApJL, 391, L53
Hamann, F., & Ferland, G. J., 1993, ApJ, 418, 11
Hamann F. & Ferland G. 1999, ARAA, 37, 487
Hamann, F., et al. 2002, ApJ, 550, 142.
Hamann, F., et al. 2004, Carnegie Observatories Astrophysics Series, 4, 440
Hopkins, P. F., et al. 2005, ApJ, 630, 705
Kauffmann, G., & Haehnelt, M. 2000, MNRAS, 311, 576
Kuraszkiewicz, J. K., & Green, P. J. 2002, ApJ, 581, 77
Li, Y., et al. 2006, ApJ, in press (astro-ph/0608190)
Nagao, T., Marconi, A., Maiolino, R. 2006a, AA, 447, 157
Nagao, T., Marconi, A., Maiolino, R. 2006b, AA, 447, 863
Pentericci, L., et al. 2002, AJ, 123, 2151
Pilyugin, L.S., Thuan, T.X., Vilchez, J.M. 2003, AA, 397, 487
Schemmer, O., et al. 2004, ApJ, 614, 547
Shields, G. A., 1976, ApJ, 204, 330
Springel, V., DiMatteo, T., & Hernquist, L. 2005, MNRAS, 361, 776
Storchi-Bergmann, T., & Pastoriza, M. G. 1989, ApJ, 347, 195
Storchi-Bergmann, T., et al. 1998, AJ, 115, 909
Trager, S., et al. 2000b, AJ, 119, 1645
Trager, S., et al. 2000a, AJ, 120, 165
Tremaine, S., et al. 2002, ApJ, 574, 740
Uomoto, A. 1984, ApJ, 284, 497
Warner, C., et al. 2002, ApJ, 567, 68
Warner, C., Hamann, F., & Dietrich, M. 2003, ApJ, 596, 72
Warner, C., Hamann, F., & Dietrich, M. 2004, ApJ, 608, 136
Warner, C., Hamann, F., & Dietrich, M. 2007, ApJ, submitted