Science Results Enabled by SDSS Astrometric Observations
Abstract
We discuss several results made possible by accurate SDSS astrometric measurements in a large sky area, with emphasis on asteroids and stellar proper motions obtained by comparing POSS and SDSS. SDSS has observed over 200,000 moving objects in five photometric bands, corresponding to about two orders of magnitude increase over previous multi–color surveys. These data were used to extend the measurement of asteroid size distribution to a smaller size limit, to demonstrate that asteroid dynamical families, defined as clusters in orbital parameter space, also strongly segregate in color space, and to discover a correlation between asteroid age and colors. A preliminary analysis of SDSS-POSS proper motions for 1 million M dwarf stars demonstrates that, in the 0.1–1 kpc distance range, the rotational velocity and its dispersion for disk stars increase with the distance from the Galactic plane.
1University of Washington, 2Princeton University, 3USNO Flagstaff, 4USNO Washington D.C., 5University of California–Santa Cruz
1. Introduction
The astrometric obervations obtained by modern massive digital sky surveys, such as SDSS, 2MASS, and FIRST, are enabling studies that have not been possible before. In this contribution we describe several science results enabled by SDSS astrometric observations, with emphasis on observations of asteroids and proper motions obtained by comparing POSS and SDSS astrometric measurements.
The Sloan Digital Sky Survey (SDSS) is currently mapping one quarter of the sky in five optical bands (ugriz, Fukugita et al. 1996; Gunn et al. 1998) to a depth of , accurate to magnitudes (both absolute calibration, and root-mean-square scatter for sources not limited by photon statistics; Ivezić et al. 2004). Astrometric positions are accurate to better than per coordinate (rms) for sources with (Pier et al. 2003), and the morphological information from the images allows reliable star/galaxy separation to (Lupton et al. 2002). The survey’s coverage of deg2 in the North Galactic Cap and of deg2 in the Southern Galactic Hemisphere will result in photometric and astrometric measurements for over stars and a similar number of galaxies. Additionally, SDSS will obtain spectra for over objects, including galaxies and quasars. The recent third public Data Release (DR3) includes imaging data for deg2 of sky, and catalogs objects (Abazajian et al. 2005). A detailed technical description of SDSS is given by Stoughton et al. (2002).
The SDSS astrometric reductions, and the measurements of their success, are described in detail by Pier et al. (2003). Briefly, the SDSS absolute astrometric accuracy is better than 100 mas, with relative (band-to-band) accuracy of about 20-30 mas (rms, for sources not limited by photon statistics). In addition to providing positions for a large number of objects with a remarkable accuracy (and thus enabling recalibration of other less accurate surveys, as described below), an important characteristic of SDSS astrometric observations is that measurements in five photometric bands are obtained over a five minute long period (with 54 sec per exposure). The multi-color nature allows the discovery of the so-called Color Induced Displacement binary stars (for details see Pourbaix et al. 2004), and the time delay allows the recognition of moving objects, discussed next.
2. SDSS Observations of Solar System Objects
Although primarily designed for observations of extragalactic objects, the SDSS is significantly contributing to studies of solar system objects, because asteroids in the imaging survey must be explicitly recognized to avoid contamination of the quasar samples selected for spectroscopic observations (Lupton et al. 2002). The SDSS has already increased the number of asteroids with accurate five-color photometry by about two orders of magnitude (to over 200,000), and to a limit more than five magnitudes fainter than previous multi-color surveys (Ivezić et al. 2001).
About 43,000 of those 200,000 objects have been associated with previously known asteroids that have well determined orbital elements (Jurić et al. 2002). Both SDSS data and orbital elements are available from the public SDSS Moving Object Catalog111Available from http://www.sdss.org/dr2/products/value_added/index.html (Ivezić et al. 2002a). The SDSS observations of objects with known orbits vividly demonstrate that asteroid dynamical families, defined as clusters in orbital parameter space, also strongly segregate in color space (Ivezić et al. 2002b). This segregation indicates that the variations in chemical composition within a family are much smaller than the compositional differences between families, and strongly support earlier suggestions that asteroids belonging to a particular family have a common origin.
Asteroid colors measured by SDSS are well correlated with the family age (Jedicke et al. 2004), which provides a direct evidence for space weathering, and offers a method to date asteroids using their SDSS colors. The effects of space weathering can also explain the color variability of asteroids measured by SDSS (Szabo et al. 2004).
3. Proper Motions Determined from SDSS and POSS Observations
Munn et al. (2004, hereafter M04) have recently presented an improved proper-motion catalog for 8 million stars, based on combining the USNO-B and SDSS catalogs in the 2099 deg2 large area of sky covered by SDSS Data Release 1. USNO-B positions are recalibrated using SDSS galaxies, which results in smaller astrometric errors and the placement of proper motions on an absolute reference frame. Tests based on several tens of thousand quasars spectroscopically confirmed by SDSS show that the proper motion errors are 3 mas/yr for bright () sources (rms per coordinate), with substantially smaller systematic errors (0.5 mas/yr, and typically 0.1 mas/yr), and excellent stability across the sky. For fainter sources, the proper motion errors increase to 4 mas/yr at , 5.7 mas/yr at , and to 7.5 mas/yr at , the faint limit for the sample discussed here. For stars at 500 pc, these proper motion errors correspond to systematic velocity error of 1 km/s, and to random velocity errors of 7 km/s at the bright end (without including errors in distance), and 20 km/s at the faint end.
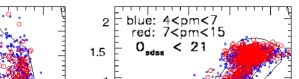
This accurate proper motion database offers numerous possibilities for studying the stellar kinematics, but the analysis of such a large and highly-dimensional data set is not trivial. At the very least, the proper motion components are functions of at least four observables: apparent magnitude, distance (or absolute magnitude, measured by e.g. color), and the position on the sky (Fig. 1). Additional stellar parameters, such as metallicity (measured from spectra, or estimated from the color), are also expected to play a role. Furthermore, the probed distance range is large (out to 15 kpc with main sequence stars, Jurić et al. 2005) and thus the dependence of the stellar velocity distribution on position in the Galaxy could also be important, as well as the deviations from a Gaussian distribution.
In this contribution we limit our analysis to M dwarfs from the M04 proper motion catalog because 1) they dominate the high proper motion sample, and 2) their distances can be reliably determined from a photometric parallax relation. A more comprehensive analysis of that catalog, that also includes three-dimensional velocities for 100,000 stars with SDSS spectra, will be presented by Bond et al. (2005, in prep., hereafter B05).
We select 881,913 M dwarfs from the M04 catalog by requiring , and (Ivezić et al. 2004), and estimate their distances using a photometric parallax relation:
| (1) |
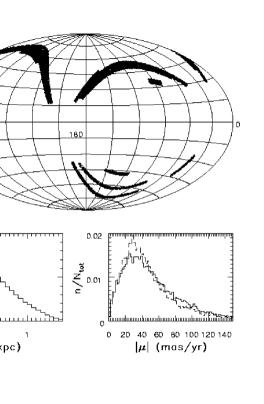
These distances have random errors of 10%, with comparable systematic errors (Jurić et al. 2005). The sky and distance distributions of selected stars are shown in Fig. 2. The size of this sample and its sky distribution make it well suited for a determination of solar peculiar motion, discussed next.

3.1. Determination of Solar Motion Relative to M dwarfs
The solar peculiar motion with a magnitude of v⊙, induces a dipole in the proper motion distribution for sources at a distance , with a magnitude of 3.2 (v⊙/15 km/s) (kpc/D) mas/yr, which is easily measurable with the sample discussed here. We follow a procedure outlined by Mihalas & Binney (1981), and determine the apex coordinates and the magnitude of implied solar motion for subsamples selected in narrow distance bins (Fig. 3).
The extrapolation of results shown in Fig. 3 to zero distance gives (lA=68∘, bA=32∘, and vA=9 km/s), somewhat different from standard values (lA=51∘, bA=23∘, and vA=15 km/s; Mihalas & Binney 1981). However, as evident from Fig. 3, all three quantities vary as a function of the subsample distance. We find that this effect is caused by the increase of the rotational velocity component with the distance from the plane, which breaks the dipole assumption of the Mihalas & Binney method. Consequently, the apex is biased toward (l90∘, bA=0∘) direction, with a corresponding increase of vA. An illustration of this dependence is discussed next. Additional supporting evidence for this claim, which utilizes three-dimensional velocity information, will be described in N05.
3.2. Kinematics as a Function of

Here we present results for the kinematics of M dwarfs observed towards the Galactic anticenter. In this direction, the rotational velocity is dominated by the longitudinal velocity component measured from proper motion, and thus robust results can be derived without radial velocity information. The top two panels in Fig. 4 show the dependence of longitudinal and latitudinal velocity components, determined from proper motions, for 50,000 M dwarfs toward l180 (without including correction for solar peculiar motion, which amounts to an overall shift of the longitudinal component by 10 km/s). While the median values of the latitudinal component are assuringly consistent with zero, the medians of the longitudinal component increase with the distance from the plane, , as vl = km/s (with the uncertainty of 10% for all three fitted parameters).
From the data presented here it cannot be ruled out that the observed variation of vl actually reflects a dependence on the radial distance from the Galactic center (because the range of galactic latitudes observed by SDSS towards l180 is limited). However, N05 demonstrate, using three-dimensional velocity information, that the dependence dominates. Furthermore, they also show that the same relation describes the behavior of vl for bluer stars that sample distances out to 3 kpc (though with less reliable distances).

3.3. The Shape of the Velocity Distribution
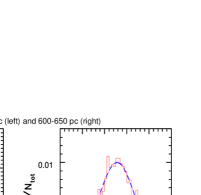
The analysis described in preceeding sections considers only the first two moments of the velocity distribution. Nevertheless, the large number of stars allows an unprecedentedly robust and accurate analysis of the full shape of the velocity distribution. As Figs. 5 and 6 show, the observed shapes significantly deviate from Gaussian, and show distortions similar to those expected from the asymmetric drift effect (Mihalas & Binney 1981). The shapes also vary with distance, a variation that is hard to explain as due to increasing proper motion errors toward the faint end (Fig. 6). The observations of the shape of the velocity distribution, and its dependence on the position and stellar tracer, encode an enormous amount of information (e.g. Binney & Tremaine 1987) that we are only beginning to harvest.
4. Discussion
The availability of modern massive sky surveys is rapidly changing astronomical methodology, and enables studies that were not possible until recently. This is particularly true for astrometric data provided by SDSS. A good example is the SDSS observations of asteroids: in only a few years, the SDSS has increased the sample of asteroids with accurate colors by about two orders of magnitude, and enabled detailed and robust studies of correlations between asteroid chemical and dynamical properties.
Another example where SDSS data were crucial is the construction of the Munn et al. SDSS-POSS proper motion catalog. This resource is bound to make significant contributions to our understanding of the Milky Way kinematics. The preliminary results discussed here suggest that these kinematics may be significantly more complex than assumed until now.
Acknowledgments.
Funding for the creation and distribution of the SDSS Archive has been provided by the Alfred P. Sloan Foundation, the Participating Institutions, the National Aeronautics and Space Administration, the National Science Foundation, the U.S. Department of Energy, the Japanese Monbukagakusho, and the Max Planck Society. The SDSS Web site is http://www.sdss.org/.
References
- (1) Abazajian, K., Adelman-McCarthy, J.K., Agüeros, M.A., et al. 2005, AJ, in press
- (2) Binney, J. & Tremaine S. 1987, Galactic Dynamics (Princeton: Princeton Univ. Press)
- (3) Fukugita, M., Ichikawa, T., Gunn, et al. 1996, AJ, 111, 1748
- (4) Gunn, J.E., Carr, M., Rockosi, C., et al. 1998, AJ, 116, 3040
- (5) Ivezić, Ž., Tabachnik, S., Rafikov, R., et al. 2001, AJ, 122, 2749
- (6) Ivezić, Ž., Jurić, M., Lupton, R.H., et al. 2002a, astro-ph/0208099
- (7) Ivezić, Ž., Lupton, R.H., Jurić, M., et al. 2002b, AJ, 124, 2943
- (8) Ivezić, Ž., Lupton, R.H., Schlegel, D., et al. 2004, AN, 325, No. 6-8, 583
- (9) Jedicke, R., Nesvorný, D., Whiteley, R., Ivezić, Ž., Jurić, M. 2004, Nature, 429, 275
- (10) Jurić, M., Ivezić, Ž., Lupton, R.H., et al. 2002, AJ, 124, 1776
- (11) Lupton, R.H., Ivezić, Ž., Gunn, J.E., et al. 2002, in “Survey and Other Telescope Technologies and Discoveries”, Tyson, J.A. & Wolff, S., eds. SPIE 4836, 350
- (12) Mihalas, D. & Binney, J. 1981, Galactic Astronomy (San Francisco: W.H. Freeman)
- (13) Munn, J.A., Monet, D.G., Levine, S.E., et al. 2004, AJ, 127, 3034
- (14) Pier, J.R., Munn, J.A., Hindsley, R.B., et al. 2003, AJ, 125, 1559
- (15) Pourbaix, D., Ivezić, Ž., Knapp, G.R., Gunn, J.E., Lupton, R.H. 2004, A&A, 423, 755
- (16) Stoughton, C., Lupton, R.H., Bernardi, M., et al. 2002, AJ, 123, 485
- (17) Szabo, Gy.M., Ivezić, Ž., Jurić, M., Lupton, R.H. & Kiss, L.L. 2004, MNRAS 348, 987
- (18) York, D.G., Adelman, J., Anderson, S., et al. 2000, AJ, 120, 1579