1–10
LSST: Comprehensive NEO Detection, Characterization, and Orbits
Abstract
The Large Synoptic Survey Telescope (LSST) is currently by far the most ambitious proposed ground-based optical survey. With initial funding from the National Science Foundation (NSF), Department of Energy (DOE) laboratories, and private sponsors, the design and development efforts are well underway at many institutions, including top universities and leading national laboratories. Solar System mapping is one of the four key scientific design drivers, with emphasis on efficient Near-Earth Object (NEO) and Potentially Hazardous Asteroid (PHA) detection, orbit determination, and characterization.
The LSST system will be sited at Cerro Pachon in northern Chile. In a continuous observing campaign of pairs of 15 second exposures of its 3,200 megapixel camera, LSST will cover the entire available sky every three nights in two photometric bands to a depth of V=25 per visit (two exposures), with exquisitely accurate astrometry and photometry. Over the proposed survey lifetime of 10 years, each sky location would be visited about 1000 times, with the total exposure time of 8 hours distributed over several broad photometric bandpasses. The baseline design satisfies strong constraints on the cadence of observations mandated by PHAs such as closely spaced pairs of observations to link different detections and short exposures to avoid trailing losses. Equally important, due to frequent repeat visits LSST will effectively provide its own follow-up to derive orbits for detected moving objects.
Detailed modeling of LSST operations, incorporating real historical weather and seeing data from Cerro Pachon, shows that LSST using its baseline design cadence could find 90% of the PHAs with diameters larger than 250 m, and 75% of those greater than 140 m within ten years. However, by optimizing sky coverage, the ongoing simulations suggest that the LSST system, with its first light in 2013, can reach the Congressional mandate of cataloging 90% of PHAs larger than 140m by 2020. In addition to detecting, tracking, and determining orbits for these PHAs, LSST will also provide valuable data on their physical and chemical characteristics (accurate color and variability measurements), constraining PHA properties relevant for risk mitigation strategies.
In order to fulfill the Congressional mandate, a survey with an etendue of at least several hundred m2deg2, and a sophisticated and robust data processing system is required. It is fortunate that the same hardware, software and cadence requirements are driven by science unrelated to NEOs: LSST reaches the threshold where different science drivers and different agencies (NSF, DOE and NASA) can work together to efficiently achieve seemingly disjoint, but deeply connected, goals.
1 Introduction
1.1 The Challenges
We are immersed in a swarm of Near Earth Asteroids (NEAs) whose orbits approach that of Earth. About 20% these, the potentially hazardous asteroids (PHAs), are in orbits that pass close enough to Earth’s orbit (0.05 AU) that perturbations with time scales of a century can lead to intersections and the possibility of collision. Beginning in 1998, NASA set as a goal the discovery within 10 years of 90% of the estimated 1000 NEAs with diameters greater than 1 km. It is expected that ongoing surveys will in fact discover about 80% of these large (1 km) NEAs by 2008 (Jedicke et al. 2003). However, this mission has been recently extended by the US Congress. The following text became law as part of the NASA Authorization Act of 2005 passed by the Congress on December 22, 2005, and subsequently signed by the President:
“The U.S. Congress has declared that the general welfare and security of the United States require that the unique competence of NASA be directed to detecting, tracking, cataloguing, and characterizing near-Earth asteroids and comets in order to provide warning and mitigation of the potential hazard of such near-Earth objects to the Earth. The NASA Administrator shall plan, develop, and implement a Near-Earth Object Survey program to detect, track, catalogue, and characterize the physical characteristics of near- Earth objects equal to or greater than 140 meters in diameter in order to assess the threat of such near-Earth objects to the Earth. It shall be the goal of the Survey program to achieve 90% completion of its near-Earth object catalogue (based on statistically predicted populations of near-Earth objects) within 15 years after the date of enactment of this Act.”
Ground-based optical surveys are the most efficient tool for comprehensive NEO detection, determination of their orbits and subsequent tracking. A survey capable of extending these tasks to NEOs with diameters as small as 140 m requires a large telescope, a large field of view (FOV) and a sophisticated data acquisition, processing and dissemination system.
A 140-meter object with a typical albedo (0.1), positioned in the main asteroid belt (at a heliocentric distance of 2.5 AU), and observed at opposition will have an apparent visual Johnson magnitude of V25. In order to detect such a faint object with at least 5 significance, in an exposure not longer than 30 seconds to prevent trailing losses (the maximum exposure time is even shorter for NEOs observed at low elongations around so-called “sweet spots”), a 10-meter class telescope is needed even at the best observing sites. A large FOV, of the order 10 square degrees, and short slew time are required to enable repeated observations of a significant sky fraction with a sufficient frequency. With such observing cadence and depth, observations will necessarily produce tens of terabytes of imaging data per night. In order to recognize NEOs, determine their orbits and disseminate the results to the interested communities in a timely manner, a powerful and fully automated data system is mandatory.
These considerations strongly suggest that in order to fulfill the Congressional mandate, a system with a high etendue (or throughput, defined as the product of the aperture area and field-of-view area), of at least several hundred m2deg2, is required. The LSST system has nearly two orders of magnitude larger etendue than that of any existing facility (Tyson 2002), and is the only facility that can detect 140-meter objects in the main asteroid belt in less than a minute.
1.2 The LSST Drivers
Three recent committees comissioned by the National Academy of Sciences111 Astronomy and Astrophysics in the New Millennium, NAS 2001; Connecting Quarks with the Cosmos: Eleven Science Questions for the New Century, NAS 2003; New Frontiers in the Solar System: An Integrated Exploration Strategy, NAS 2003. concluded that a dedicated wide-field imaging telescope with an effective aperture of 6–8 meters is a high priority for US planetary science, astronomy, and physics over the next decade. The LSST system described here will be a large, wide-field ground based telescope designed to obtain sequential images covering the entire visible sky every few nights. The current baseline design allows us to do so in two photometric bands every three nights.
The survey will yield contiguous overlapping imaging of 20,000 square degrees of sky in at least five optical bands covering the wavelength range 320–1050 nm. Detailed simulations that include measured weather statistics and a variety of other effects which affect observations predict that each sky location can be visited about 100 times per year, with two 15 sec exposures per visit.
The range of scientific investigations which would be enabled by such a dramatic improvement in survey capability is extremely broad. The main science themes that drive the LSST system design are
-
1.
Constraining Dark Energy and Matter
-
2.
Taking an Inventory of the Solar System
-
3.
Exploring the Transient Optical Sky
-
4.
Mapping the Milky Way
In particular, the detection, characterization and orbital determination of Solar System objects impact the requirements on relative and absolute astrometric accuracy (10 milliarcsec and 50 milliarcsec, respectively, for sources not limited by photon statistics), and drive the detailed cadence design, discussed further below.
1.3 The LSST Reference Design
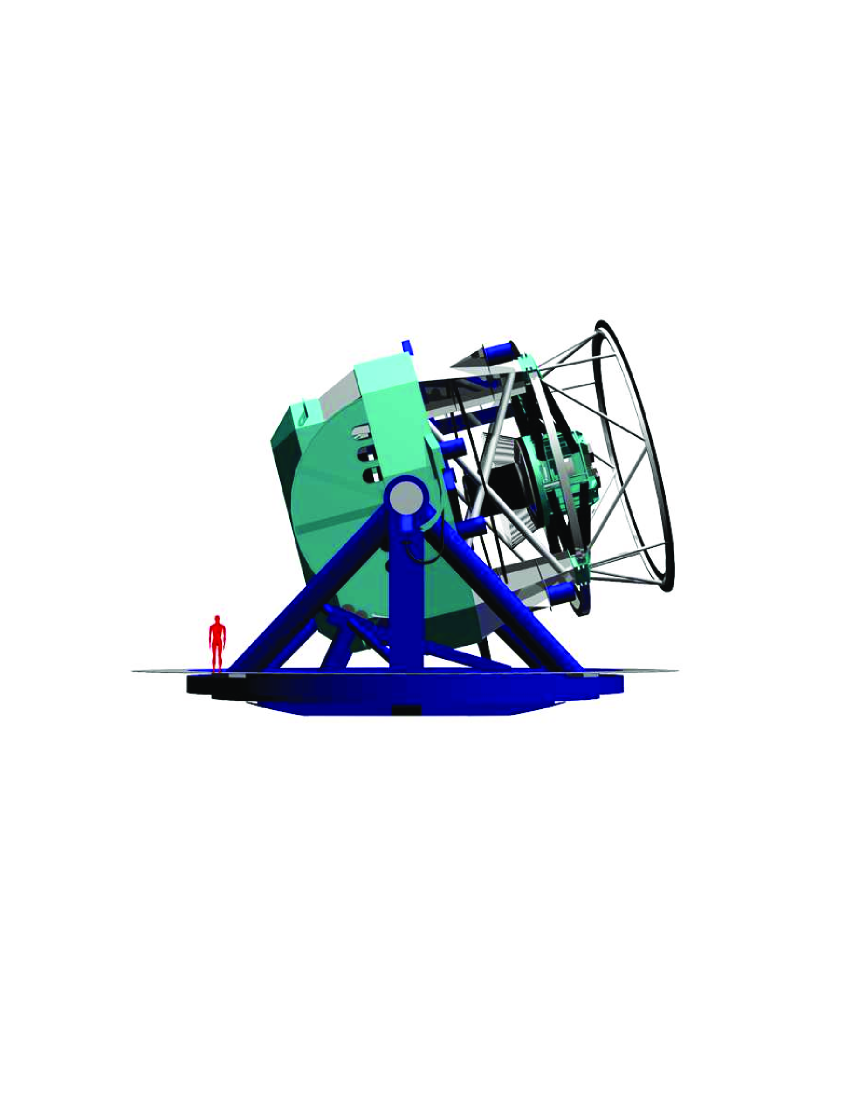
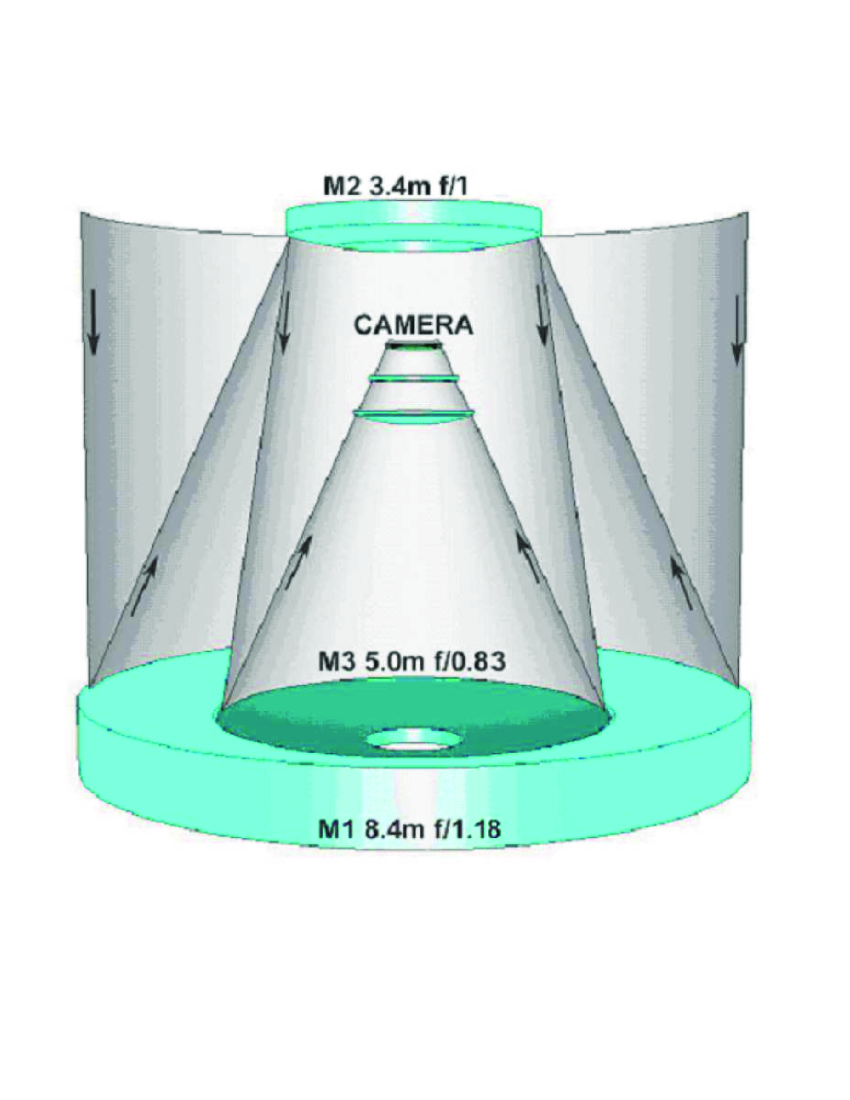
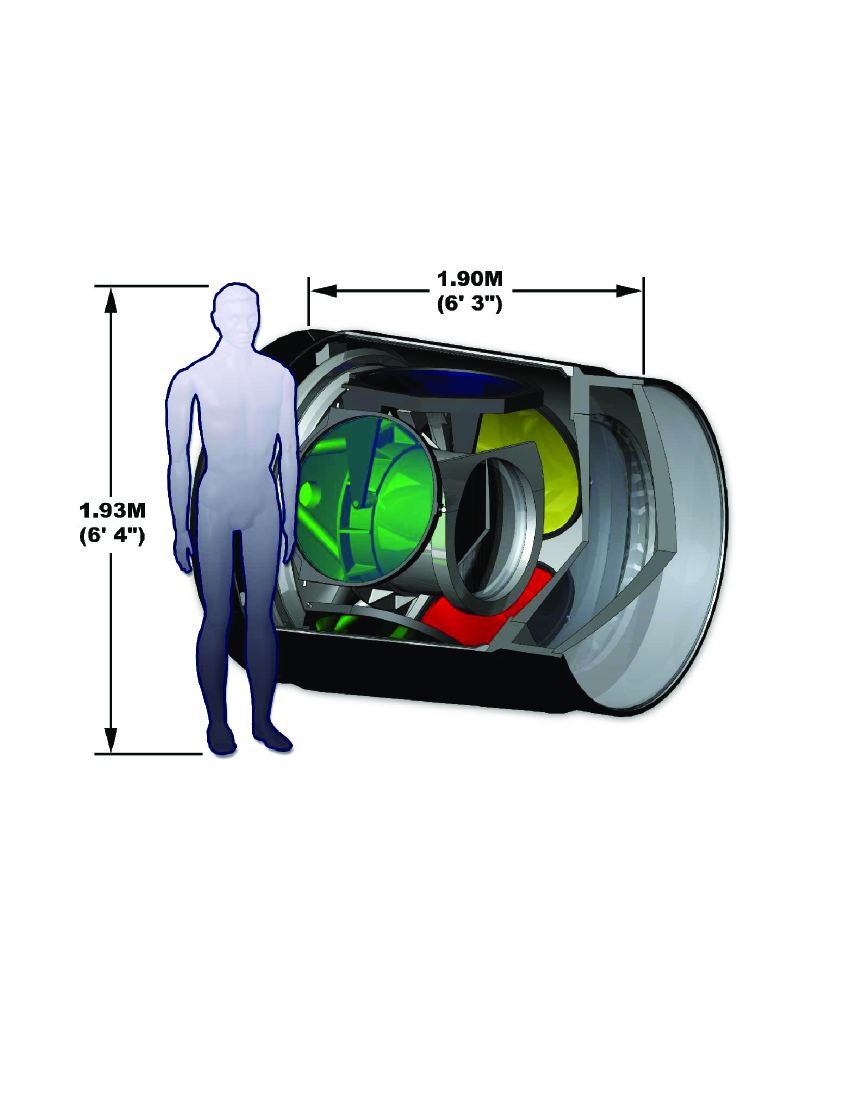
The LSST reference design222More details about LSST system are available at http://www.lsst.org., with an 8.4 m diameter primary mirror, standard filters (, 320 – 1050 nm), and current detector performance, reaches 24th V mag in 10 seconds333An LSST exposure time calculator has been developed and is publicly available at http://tau.physics.ucdavis.edu/etc/servlets/LsstEtc.html.. With an effective aperture of 6.5m and 9.6 square degree field of view, LSST has an etendue of 320 m2deg2. This large etendue is achieved in a novel three-mirror design (modified Paul-Baker) with a very fast f/1.25 beam, and a 3.2 gigapixel camera (with 0.2 arcsec large pixels). The baseline designs for telescope and camera are shown in Figs. 1 and 2. The LSST telescope will be sited at Cerro Pachon, Chile.
2 The LSST PHA Survey
2.1 The PHA Survey Requirements
The search for PHAs puts strong constraints on the cadence of observations, requiring closely spaced pairs of observations two or preferably three times per lunation in order to link observations unambiguously and derive orbits. Individual exposures should be shorter than about 20 sec each to minimize the effects of trailing for the majority of moving objects. Because of the faintness and the large number of PHAs and other asteroids that will be detected, LSST must provide the follow-up required to derive orbits rather than relying, as current surveys do, on separate telescopes. The observations should be preferentially obtained within degrees of the Ecliptic, with additional all-sky observations to increase the completeness at the small size limit (because the smaller asteroids must be closer to the Earth in order to be visible, and therefore are more nearly isotropically distributed).
The images should be well sampled to enable accurate astrometry, with absolute accuracy not worse than 0.1 arcsec. There are no special requirements on filters, although bands such as V and R that offer the greatest sensitivity are preferable. The images should reach a depth of at least 24 (5 for point sources) in order to probe the m size range at main-belt distances. Based on recent photometric measurements of asteroids by the Sloan Digital Sky Survey, the photometry should be better than 1-2% to allow for color-based taxonomic classification and light-curve measurements.
2.2 The PHA Survey Baseline Design
The baseline design cadence is based on two revisits closely separated in time (15-60 min) to enable a robust and simple method for linking main-belt asteroids (MBAs). Their sky surface density is about two orders of magnitude higher than the expected density of PHAs, and thus MBAs must be efficiently and robustly recognized in order to find PHAs. MBAs move about 3-18 arcmin in 24 hours, which is larger than their typical nearest neighbor angular separation at the depths probed by LSST (2.3 arcmin on the Ecliptic). Two visits closely separated in time (“re-visits”) enable linking based on a simple search for the nearest moving neighbors, with a false matching rate of only a few percent.
The present planned observing strategy is to “visit” each field (9.6 sq. deg.) with two back-to-back exposures of 15 sec, reaching to at least magnitude of 24.8. Two such visits will be spaced in time by about half an hour. Each position in the sky will be visited several times during a month, spaced by a few days. This cadence will result in orbital parameters for several million MBAs, with light curves and color measurements for a substantial fraction of each population. Compared to the current data available, this would represent a factor of 10 to 100 increase in the numbers of orbits, colors, and variability of the two classes of object. The large LSST MBA sample will enable detailed studies of the dynamical and chemical history of the Solar System.
2.3 The PHA Survey Simulations
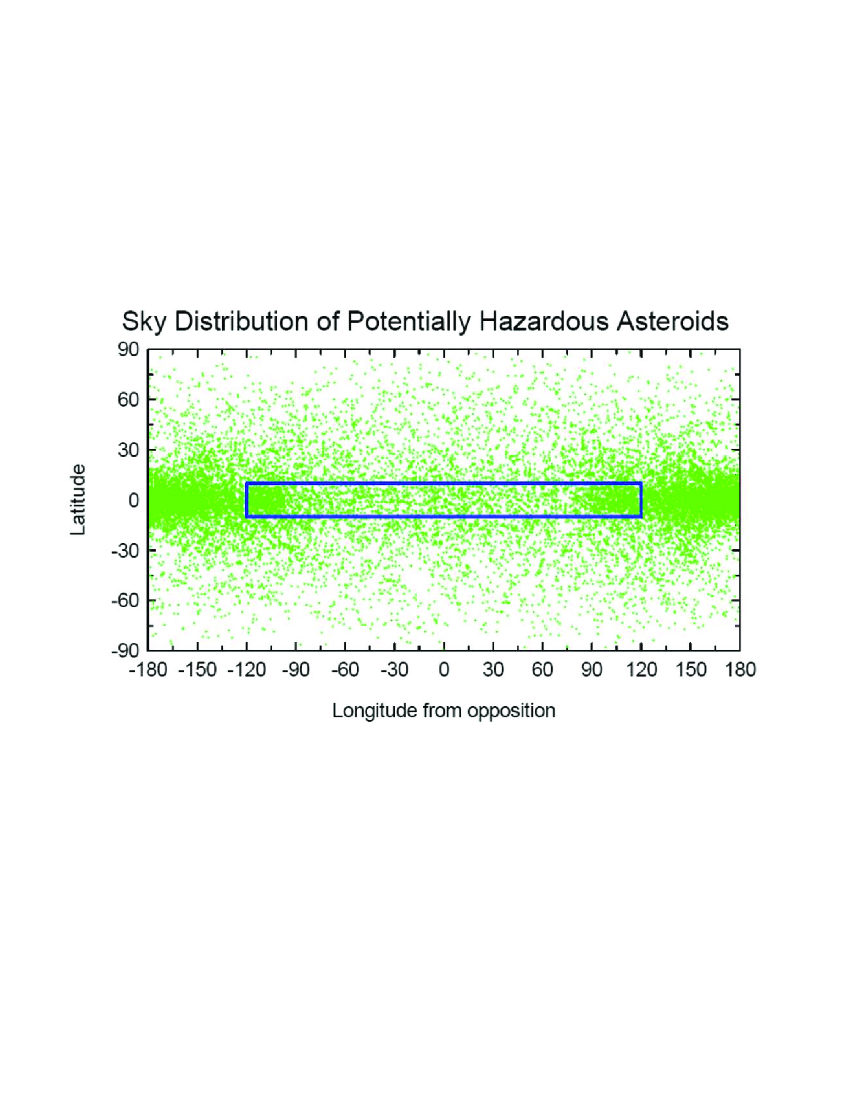
The performance of the baseline design cadence is studied and quantified using detailed simulations (developed by A. Harris and E. Bowell), including real historical weather and seeing data from Cerro Pachon (LSST site). The survey is simulated by generating a set of 1000 synthetic orbital elements that match the distribution of discovered objects in the large size range where present surveys are essentially complete. Positions and magnitudes in the sky are computed at five day intervals for ten years. An example of the instantaneous distribution of the simulated sample on the sky is shown in Figure 3.
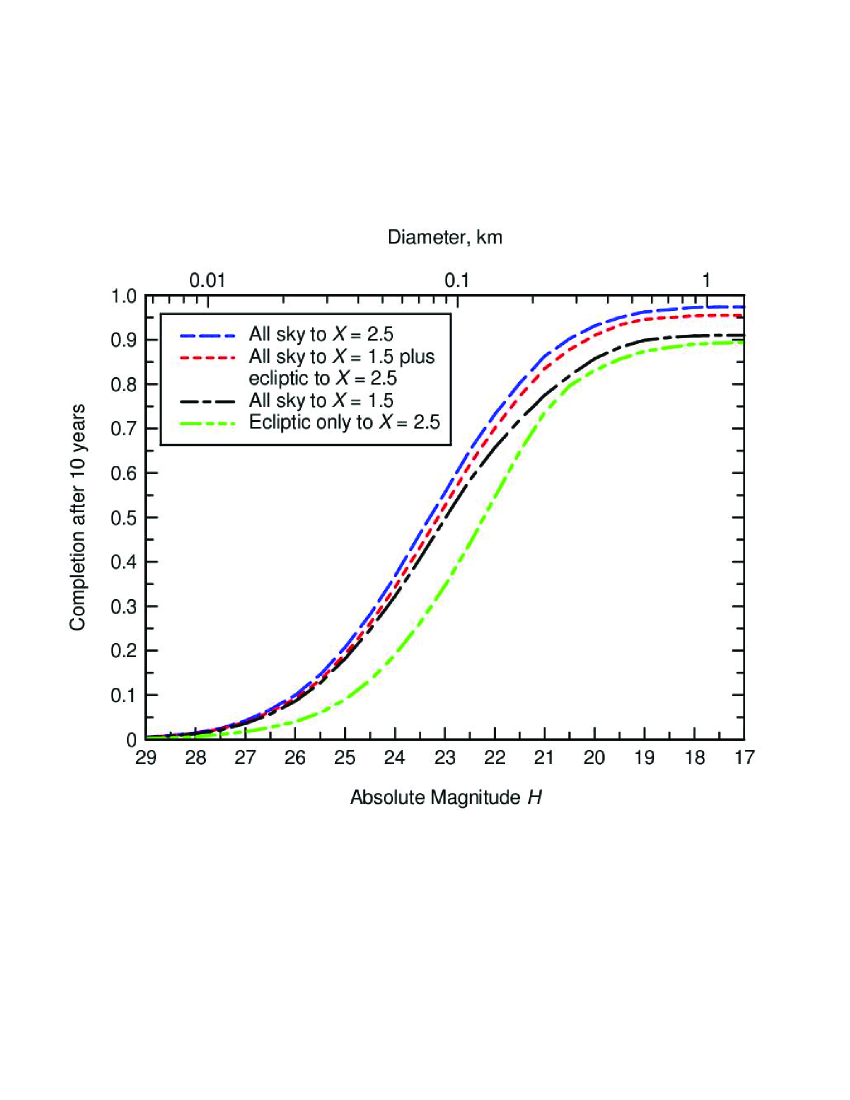
The resulting sample is then “filtered” according to assumed sky coverage and cadence pattern, limiting magnitude of survey instrument, visibility constraints, and magnitude loss according to observing conditions. It is assumed that detections on two days out of three days observed in a month suffice for orbit determination (justification for this assumption is discussed further below). This selection is repeated as a function of absolute magnitude, , each time tabulating how many of the 1000 objects are “discovered”. The completeness as a function of absolute magnitude (i.e. size) for the baseline design cadence is shown in Figure 4.
These simulations suggest that it is essential to cover the ecliptic band to as great an elongation as possible. We find that a band extending 10∘ in latitude and 120∘ in longitude from the opposition point (see the blue box in Figure 3) yields fairly good efficiency in surveying for PHAs. This is true because even objects in highly inclined orbits must pass through the ecliptic sometime. Nevertheless, adding coverage of the rest of the sky improves the survey efficiency at the small size limit markedly.
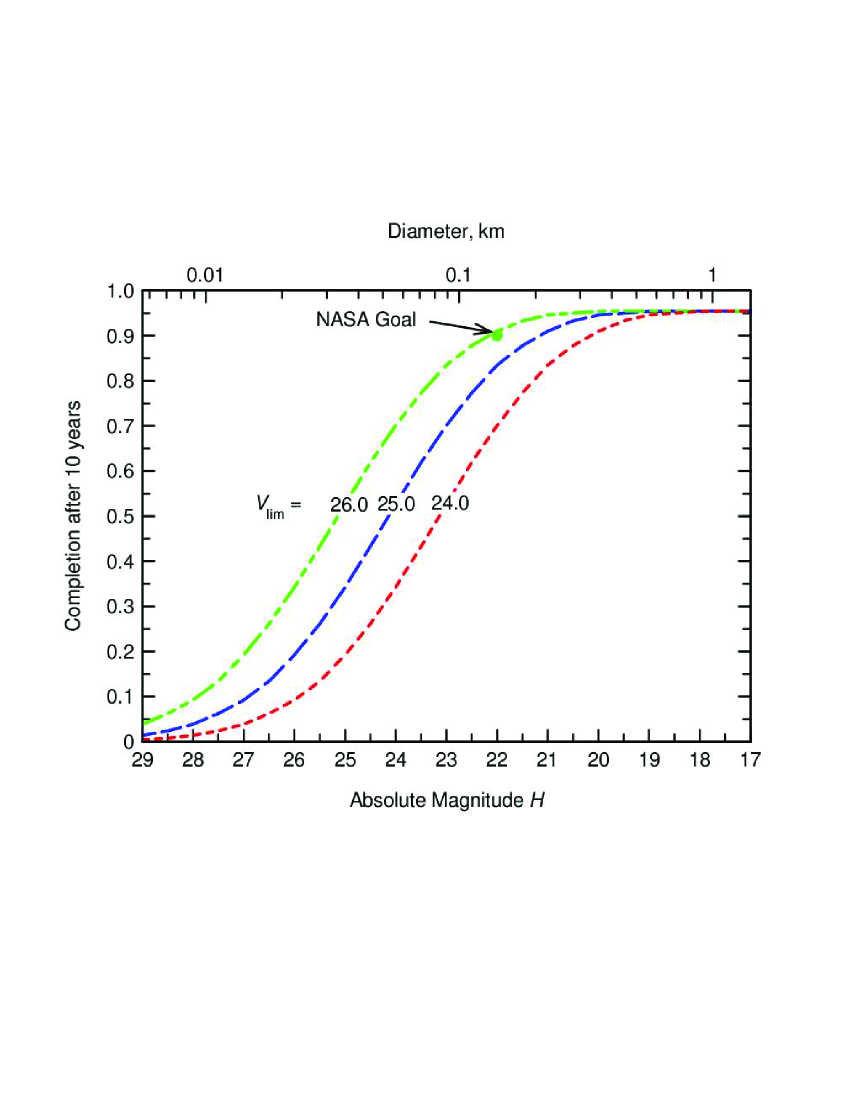
The LSST baseline design cadence can achieve, over 10 years, a completeness of 90% for objects larger than 250 m diameter, and 75% completeness for those greater than 140 m. However, ongoing simulations show that by using all available data, optimizing filter choice and operations, LSST would be capable of just reaching a completeness of 90% for PHAs larger than 140 m in ten years. For example, adjusting the depth of each visit affects completeness as shown in Figure 5. Simply including all the relevant data from other filter bands can also increase completeness. This could result in an increase of 10% for 140 m PHAs, moving up from the middle curve to the top curve. Moreover, note that none of the curves saturate at 100%. That remaining 5% represents PHAs with mainly low collision cross section – thus they pose no substantial hazard. In effect, the completeness for truly hazardous PHAs of 140m size is already close to 90% in the LSST baseline cadence. Due to its large etendue, LSST system enables sufficiently frequent sky coverage to assure multiple detections per lunation even at the 140 m limit.
Perhaps the most important insight from these simulations is the realization that a system with an etendue of at least several hundred m2deg2 is mandatory for fulfilling the Congressional mandate to catalog 90% of PHAs larger than 140m.
2.4 From Many Detections to Orbits
The LSST PHA survey simulations described above assume that detections on two days out of three days observed in a month suffices for orbit determination. The linkage of individual detections and orbit determination will be a formidable task for any large area survey. The increase in data volume associated with LSST will make the extraction of tracks and orbits of asteroids from the underlying clutter a significant computational challenge.
The combinatorics involved in linking multiple observations of 106 sources spread out over several nights will overwhelm naive linear and quadratic orbit prediction schemes. Tree-based algorithms for multihypothesis testing of asteroid tracks can help solve these challenges by providing the necessary 1000-fold speed-ups over current approaches while recovering 99% of the underlying objects.
In addition, observations of asteroids are often incomplete. Sources fall below the detection threshold in one or more of the series of observations. Weather results in incomplete sampling of the temporal data. Noise introduces photometric and astrometric uncertainties. Combined, these observational constraints can severely limit our ability to survey large areas by requiring that we revist a given pointing on the sky more often than necessary. The LSST’s approach is designed to be robust to these effects.
LSST will use a three stage process to find new moving objects (Kubica 2005, Kubica et al. 2005). In the first stage intra-night associations are proposed by searching for detections forming linear “tracklets.” By using loose bounds on the linear fit and the maximum rate of motion, many erroneous initial associations can be ruled out. In the second stage, inter-night associations are proposed by searching for sets of tracklets forming a quadratic trajectory. Again, the algorithm can efficiently filter out many incorrect associations while retaining most of the true associations. However, the use of a quadratic approximation means that a significant number of spurious associations still remains. In the third stage, initial orbit determination and differential corrections algorithms are used to further filter out erroneous associations by rejecting associations that do not correspond for a valid orbit. Each stage of this strategy thus significantly reduces the number false candidate associations that the later and more expensive algorithms need to test.
To implement this strategy, the LSST team has developed, in a collaboration with the Pan-STARRS project (Kaiser et al. 2002), a pipeline based on multiple kd-tree data structures (Barnard et al. 2006). These data structures provide an efficient way of indexing and searching large temporal data sets. Implementing a variable tree search we can link sources that move between a pair of observations, merge these tracklets into tracks spread out over tens of nights, accurately predict where a source will be in subsequent observations and provide a set of candidate asteroids ordered by the likelihood that they have valid asteroid tracks. Tested on simulated data, this pipeline recovers 99% of correct tracks for NEOs and MBAs, and requires less than a day of CPU time to analyze a night’s worth of data. This represents a several thousand fold increase in speed over a naive linear search. It is noteworthy that comparable amounts of CPU time are spent on kd-tree based linking step (which is very hard to parallelize) and on posterior orbital calculations to weed out false linkages (which can be trivially parallelized).
Given the predicted astrometric accuracy of the survey (per exposure: 10 milliarcsec relative and 50 milliarcsec absolute, root-mean-square scatter per coordinate for sources not limited by photon statistics) and the efficiency of the tracking algorithms described above, LSST can lose all but two observations in one 24 hour period and still recover sufficient information to determine the tracklet (linking pairs of re-visits) required to initiate a search for an asteroid. Pairs of these tracklets can be observed as infrequently as once every eight nights and still result in a candidate asteroid being identified with an accuracy of 90% or greater.
2.5 PHA Characterization
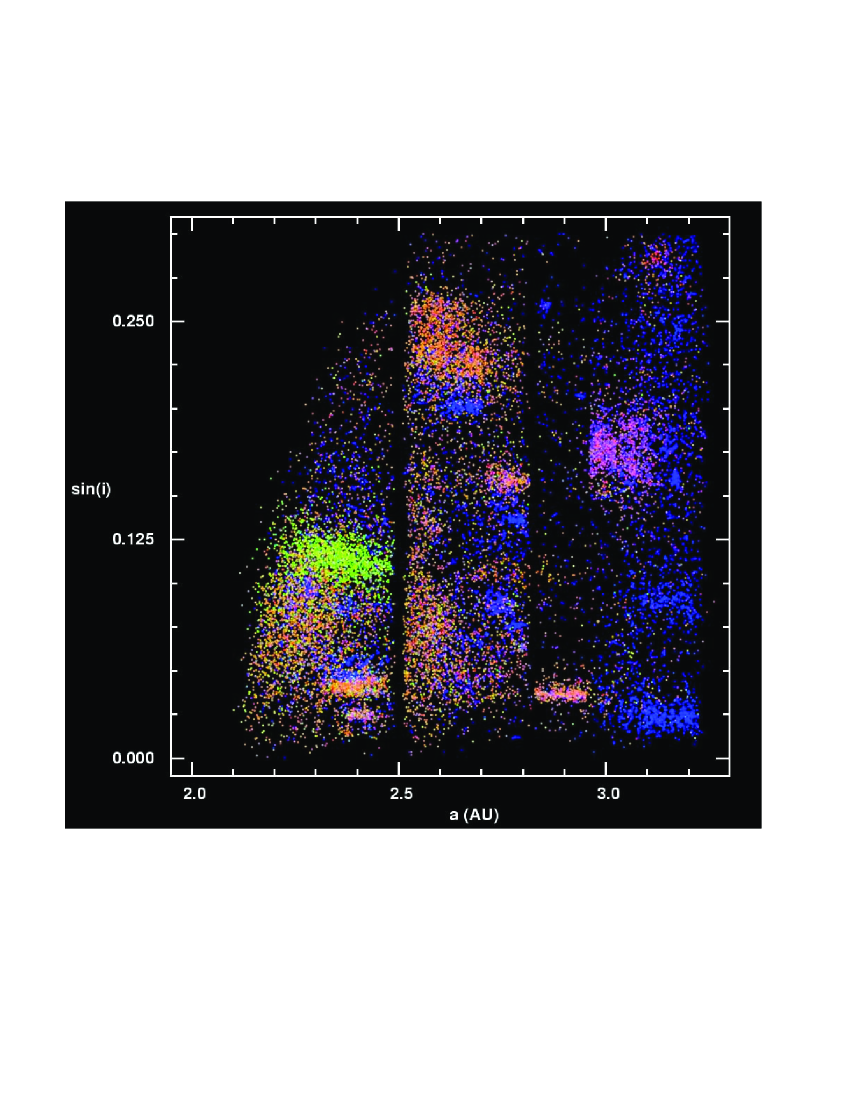
LSST will not only obtain orbits for PHAs, but will also provide valuable data on their physical and chemical characteristics, constraining the PHA properties relevant for risk mitigation strategies. LSST will measure accurate colors for a substantial fraction of detected moving objects, thereby allowing studies of their surface chemistry, its evolution with time, and of dynamical (collisional) evolution. As a recent example obtained by a modern large-area multi-color survey, Figure 6 shows a correlation between orbital elements and optical colors for MBAs measured by the Sloan Digital Sky Survey (Ivezić et al. 2001). The clusters of points visible in the figure are Hirayama’s dynamical families, proposed to represent remnants of larger bodies destroyed in collisions. SDSS data vividly demonstrate a strong correlation between dynamics and colors, in support of Hirayama’s hypothesis. LSST will extend this map to a three times smaller size limit, and will also provide structural information by measuring light curves for the majority of objects. The variability information carries important information about the physical state of an asteroid (e.g. solid body vs. a rubble pile; Pravec & Harris 2000), and these new data will constrain the size-strength relationship, which is a fundamental quantity that drives the collisional evolution of the asteroid belt.
Inevitably, some PHAs will be sufficiently interesting, based on provisional orbits from LSST data, that they should be continuously followed to ascertain their detailed light-curve (rubble pile or solid body). Through Las Cumbres Observatory, one of the LSSTC member institutions, we will have access to a worldwide array of 2m-class telescopes for this continuous tracking. These telescopes will be instrumented with identical detectors and filters to those on LSST in a dichroic camera capable of taking simultaneous images at multiple wavelengths. This color “movie” will aid characterization of these PHAs.
3 Conclusions
LSST is in a unique position to fulfill the Congressional mandate to reach 90% completion for 140 m large NEOs because such a survey requires a large telescope to achieve necessary depths (at least ) with exposure times not longer than 15-20 seconds (to avoid trailing losses), a large field of view to be able to scan the sky at a required pace, and a sophisticated data acquisition, processing and dissemination system to handle billions of detectable stars and galaxies.
Detailed simulations suggest that the LSST baseline design cadence will achieve, over 10 years, a completeness of 90% for objects larger than 250 m diameter, and 70% completeness for those greater than 140 m. Ongoing simulations suggest that with further minor optimization of the baseline cadence LSST would be capable of reaching the Congressional target completeness of 90% for PHAs larger than 140 m. In addition, LSST will not only obtain orbits for PHAs, but will also provide valuable data on their physical and chemical characteristics, constraining the PHA properties related to risk mitigation.
In summary, LSST will, with its unprecedented power for discovering moving objects, make a giant leap forward in the studies of the dynamical and chemical history of the whole Solar system.
References
- [] Barnard, K., Connolly, A., Denneau, L., et al. 2006, in Observatory Operations: Strategies, Processes, and Systems, D.R. Silva & R.E. Doxsey, eds. Procs. of the SPIE, 6270, 69
- [] Harris, A.W. & Bowell, E.L.G. 2004, BAAS 36, 1530
- [] Ivezić, Ž., Lupton, R.H., Jurić, M., et al. 2002, Astronomical Journal, 124, 2943
- [] Jedicke, R., Morbidelli, A., Spahr, T., Petit, J-M., & Bottke, W.F. 2003, Icarus, 161, 17
- [] Kaiser, N., Aussel, It., Burke, B.E., et al. 2002, in “Survey and Other Telescope Technologies and Discoveries”, Tyson, J.A. & Wolff, S., eds. Proceedings of the SPIE, 4836, 154
- [] Kubica, J., Masiero. J., Moore, A., Jedicke, R., & Connolly, A. 2005, in Advances in Neural Information Processing Systems 18, Y. Weiss, B. Schölkopf and J. Platt, eds. MIT Press, Cambridge, MA, p. 691
- [] Kubica, J. 2005, Efficient Discovery of Spatial Associations and Structure with Application to Asteroid Tracking, PhD Thesis, Robotics Institute, Dec 2005, Carnegie Mellon University, Pittsburgh, PA
- [] Milani, A. & Knežević, Z. 1992, Icarus, 98, 211
- [] Pravec, P. & Harris, A.W., 2000, Icarus, 148, 12
- [] Tyson, J.A. 2002, in Survey and Other Telescope Technologies and Discoveries, Tyson, J.A. & Wolff, S., eds. Proceedings of the SPIE, 4836, 10