The chemistry of multiply deuterated molecules in protoplanetary disks. I. The outer disk
Abstract
We present new models of the deuterium chemistry in protoplanetary disks, including, for the first time, multiply deuterated species. We use these models to explore whether observations in combination with models can give us clues as to which desorption processes occur in disks. We find, in common with other authors, that photodesorption can allow strongly bound molecules such as HDO to exist in the gas phase in a layer above the midplane. Models including this process give the best agreement with the observations. In the midplane, cosmic ray heating can desorb weakly bound molecules such as CO and N2. We find the observations suggest that N2 is gaseous in this region, but that CO must be retained on the grains to account for the observed DCO+/HCO+. This could be achieved by CO having a higher binding energy than N2 (as may be the case when these molecules are accreted onto water ice) or by a smaller cosmic ray desorption rate for CO than assumed here, as suggested by recent theoretical work.
For gaseous molecules the calculated deuteration can be greatly changed by chemical processing in the disk from the input molecular cloud values. On the grains singly deuterated species tend to retain the D/H ratio set in the molecular cloud, whereas multiply deuterated species are more affected by the disk chemistry. Consequently the D/H ratios observed in comets may be partly set in the parent cloud and partly in the disk, depending on the molecule.
1 Introduction
Observations of deuterated molecules have long been used to trace the physics and chemistry of interstellar clouds. The elemental abundance of deuterium relative to hydrogen is 10-5, but the relative abundances of deuterated to non–deuterated molecules can be much higher, especially in cold regions. Deuterium is transferred from ions such as H2D+ and CH2D+ via gas phase ion-molecule reactions. The reverse reactions, removing the deuterium, are inhibited at low temperatures, due to the difference in the zero point energy of the deuterated species to its non–deuterated equivalent. Another route to high levels of deuteration is via reactions between species accreted on to the surfaces of dust grains. These processes can lead to molecular D/H ratios of 0.01 in cold molecular clouds (e.g. Turner, 2001). High levels of deuteration are also seen in hot cores, protostellar disks and comets.
Recently, multiply deuterated molecules have been observed for the first time with high levels of deuteration, e.g. NHD2/NH3 ranges from 0.005 (in the cold core, L134N) to 0.03 (in the low mass protostar 16293E) (Roueff et al., 2000; Loinard et al., 2001), ND3/NH3 10-3 (in NGC133 IRAS4A and Barnard 1 – Lis et al., 2002; van der Tak et al., 2002), and D2CO/H2CO 0.01 - 0.4 (in cold cores and low mass protostars – Loinard et al., 2002; Bacmann et al., 2003). High abundances of deuterated methanol and formaldehyde have been seen in star forming regions (Parise et al., 2002; Loinard et al., 2002; Bacmann et al., 2003) and are attributed to the thermal desorption of grain mantles accumulated during an earlier low temperature phase, demonstrating the importance of grain surface reactions in determining deuteration. In order to achieve such high molecular deuteration ratios, very high atomic D abundances are required during the period when ice mantles can accumulate, with D/H 0.2 - 0.3 (Caselli et al., 2002; Parise et al., 2002). The recent models of Roberts et al. (2003) have shown that the inclusion of HD and D can drive up the atomic D/H ratio to a level where grain surface reactions can account for the observations of multiply deuterated H2CO and CH3OH.
A few deuterated molecules have now been observed in protostellar disks. van Dishoeck et al. (2003) observed DCO+ in TW Hya with DCO+/HCO+ = 0.035. This molecule was also observed in DM Tau, with DCO+/HCO+ = 4 10-3 (Guilloteau et al., 2006). Ceccarelli et al. (2004) observed H2D+ in TW Hya and DM Tau and found fractional abundances of 4 10-10 and 7 10-10 respectively. They argued that the emission arises in the midplane, where few other molecules exist because of efficient freezeout, and thus observations of H2D+ provide a means of determining the ionization fraction in this region. Ceccarelli et al. (2005) presented observations of HDO in DM Tau with a fractional abundance of 3 10-9. The emission arises in a region with temperatures below 25 K, where HDO is expected to be frozen onto dust grains. The presence of HDO emission shows that an efficient non–thermal desorption process must be acting, which Dominik et al. (2005) suggest to be photodesorption. The detection of HDO and H2D+ in DM Tau has been disputed by Guilloteau et al. (2006).
The similarity between the molecular D/H ratios observed in comets and those seen in molecular clouds is one reason why it has been suggested that comets may be composed of interstellar material, e.g. Meier et al. (1998a, b); Bockelee-Morvan et al. (1998); Eberhardt et al. (1995). This would mean that the molecules had experienced little or no chemical processing in the protosolar disk, yet models of deuterium chemistry in disks, e.g. Aikawa & Herbst (1999a, 2001); Aikawa et al. (2002) show that extensive chemical processing can occur, resulting in D/H ratios that are very different from the ones set in the parent molecular cloud. These disk models have considered the chemistry of singly deuterated species only and did not include grain chemistry, thereby ignoring a potentially important process for determining the D/H ratios. The model of Aikawa & Herbst (1999a) considered the evolution of the chemistry in a cold cloud core, through the infall stage and into the protostellar disk. They found, in the region of the disk where comets are expected to form, that the molecular deuteration is affected by chemical processing in the disk. Therefore the abundances of molecules in comets does not just reflect interstellar cloud abundances. Aikawa & Herbst (2001) considered only the disk chemistry, but used a disk model that was isothermal at any given radius. This was improved upon by Aikawa et al. (2002) who used temperature and density distributions derived from the hydrodynamical models of d’Alessio et al. (1999). Aikawa & Herbst (2001) also ignored grain reactions, but they found good agreement with the observed DCN/HCN and DCO+/HCO+ ratios ( 0.01).
Models have shown that in highly depleted regions, such as the disk midplane, the deuteration of H is efficient and D can become the dominant isotopomer (Ceccarelli & Dominik, 2005). This has consequences for the deuteration of other molecules since they form from reactions of H, H2D+, HD and D. Roberts et al. (2002, 2003) demonstrated that the molecular D/H ratios in dense molecular clouds can be significantly enhanced by the inclusion of HD and D in the models. This effect is greatest in regions where molecules are heavily depleted by freezeout onto grains. Since disks are very dense and therefore experience a high degree of depletion, especially in the midplane, it seems likely that HD and D could have a significant effect on the chemistry.
Given the importance of deuterium in tracing the origin of solar system bodies and for understanding the thermal history of star forming regions, together with the evidence that multiply deuterated forms of H are important for determining the molecular deuteration and the suggestion that grain surface reactions may be important in determining the D/H ratios, it seems timely to take another look at the chemistry of deuterium in protoplanetary disks. Here we present a model of the chemistry of a T Tauri disk that includes multiply deuterated species, combined with grain surface chemistry. We consider how different desorption processes can affect the column densities and compare our results with observations with the aim of better understanding the processes that are at work in disks. We also use our models to consider how processing in disks may affect the molecular D/H ratios observed in comets.
2 The models
In this section we discuss the processes that are included in our models. We wish to investigate how different assumptions about the chemistry, in particular about desorption, can affect the calculated abundances. To do this we have chosen one particular physical model to provide the density and temperature distributions. We consider three desorption processes, thermal desorption, desorption due to cosmic ray heating of grains (CRH) and photodesorption. All models include thermal desorption. Model A excludes non–thermal desorption, Model B includes CRH, Model C includes CRH and photodesorption, and Model D includes photodesorption but not CRH. Our models assume that the disk is static, and that no mixing processes are acting.
2.1 The chemical model
Our basic chemical model is taken from the UMIST database RATE95 (Millar et al., 1998). The deuterated network is derived from this database using the techniques described in Millar et al. (1989) and Rodgers & Millar (1996). In the gas phase formation of mono–deuterated species the deuterium is transferred by reaction of H2D+, CH2D+ and C2HD+. The rates for these reactions are taken from Roberts & Millar (2000). For multiply deuterated species the reactions of HD, D, CHD, CD and C2HD+ are important. Rates for these reactions are taken from Roberts et al. (2004). Other reactions involving deuterated species are assumed to have the same rates as their non–deuterated counterparts. For reactions involving complex species, the branching ratios must be determined. In the absence of any information on the reaction mechanism, this is done on a statistical basis, with the exception of reactions where the same functional group appears as both a reactant and a product. In this case it is assumed that this group is preserved through the reaction (Rodgers & Millar, 1996). For example, in the dissociative recombination of only is formed and not .
Our reaction network links 227 gas phase species (of which 115 are deuterated) and 91 grain species (44 deuterated) by 9489 reactions. In order to reduce the time taken for the model to run, not every possible multiply deuterated species is included e.g. multiply deuterated forms of methanol are not included.
2.2 The recombination of N2H+
In RATE95 it is assumed that recombines with electrons to form N2 and H only. However, recent laboratory work (Geppert et al., 2004) has shown that this is in fact a minor reaction pathway and instead
| (1) |
is the main route. This result has consequences for the chemistry. Roberts et al. (2003) found that the new branching ratios do not affect the calculated abundances in gas phase only models, but do have significant effects in models that include freezeout. At low temperatures when freezeout is included, the destruction of by reaction with CO becomes less significant as the CO is depleted, and so Reaction 1 gains in importance. The formation of NH from reaction 1 results in the removal of nitrogen from the gas in cold regions, since any NH that accretes onto the grains will be rapidly hydrogenated to form NH3, a molecule with a high binding energy that is therefore not easily desorbed, unlike N2 which is very volatile. Consequently, the new reaction pathways can reduce the abundance of nitrogen–bearing molecules in the gas. This reduction is less significant in regions where the grain temperature is higher than about 20 K, where NH can be thermally desorbed before reacting, and hence the formation of NH3 ice is less efficient.
In disks, Ceccarelli & Dominik (2005) showed that N2 is an important means of controlling the degree of deuteration. The presence of N2 will prevent the transfer of deuteration along the chain of isotopes from to and reduce the abundance of by destroying the less deuterated isotopomers before they have a chance to form . The new reaction pathway means that the abundance of N2 will be reduced in the midplane, and hence the degree of deuteration of will be higher.
2.3 Freezeout and desorption processes
Given the high densities and cold temperatures found in much of the outer disk, molecules that hit a grain are likely to stick to it efficiently. We assume that all species freezeout at the same rate with a temperature independent sticking coefficient of 0.3. For positive ions the freezeout rate is increased slightly, since grains are likely to have a negative charge (Umebayashi & Nakano, 1980) and therefore there could be a stronger attraction between the positive ions and the negatively charged grains. The freezeout rate of positive ions is assumed to increase by a factor = where is the grain radius and is the grain temperature (Umebayashi & Nakano, 1980). Ions are assumed to recombine on the grain surfaces in the same way that they do when reacting with electrons in the gas, e.g. in the gas phase
| (2) |
and on the grain
| (3) |
where H and CO represent H and CO on the grains. The exceptions are and where we follow Roberts et al. (2004) in assuming that these ions form N2 rather than NH and ND when they freezeout. All species are assumed to freezeout, except for He which has a very low binding energy and is therefore easily thermally desorbed even at very low temperatures. Any He+ that hits a grain is neutralized and returned immediately to the gas.
We include thermal desorption and desorption due to cosmic ray heating of grains. Cosmic ray heating is able to maintain a low level of some volatile molecules such as CO and N2 in the cold midplane of our models. These molecules can destroy ions such as H and its deuterated isotopes, and produce ions such as HCO+ and DCO+ in the midplane and thereby affect the ionization level in this region. We have therefore run models without cosmic ray heating to determine how the inclusion of this process will affect molecular abundances and the ionization level in cold regions of the disk. The rates for cosmic ray heating are taken from Hasegawa & Herbst (1993), using updated binding energies for some species, notably CO, for which we use the value determined by Öberg et al. (2005). Table The chemistry of multiply deuterated molecules in protoplanetary disks. I. The outer disk gives the binding energies () used in our models.
Thermal desorption rates are calculated from
| (4) |
where is the grain temperature, and is the frequency of oscillation between the absorbate and the surface given by
| (5) |
where is the surface density of sites ( 1.5 1015 cm-2) and is the mass of the accreting species.
2.4 Photodesorption
Ceccarelli et al. (2005) recently observed a high column density of HDO in the disk around DM Tau. They found N(HDO) 1.6 1013 cm-2 in the outer disk, where the density is 106 cm-3 and the temperature is 25 K. The emission comes from above the midplane and corresponds to a relatively high fractional abundance of 3 10-9. At these densities and temperatures, water is expected to be completely removed from the gas by accretion onto grains, where it will remain in the absence of a non–thermal desorption process. Cosmic ray heating is not efficient enough to remove such a strongly bound molecule as water. Dominik et al. (2005) suggested that photodesorption, arising from the action of the interstellar far–UV field could be efficient enough to retain water vapor in the gas phase in the cold outer disk, and so account for the observed column densities. They found that photodesorption can maintain a layer of water vapor above the midplane with a fractional abundance of 3 10-7. The average calculated value of N(H2O) in their model was 1.6 1015 cm-2, and using this combined with the observed N(HDO) they deduce HDO/H2O = 0.01 in DM Tau.
We have previously investigated the effects of photodesorption on the chemistry of disks (Willacy & Langer, 2000) and found that it can retain high abundances of many molecules in a layer above the midplane, even in cold disks. Here we revisit the idea of photodesorption and investigate not only how it affects the abundances but also how it impacts the deuteration of molecules (Models C and D)
The rate of photodesorption is given by
| (6) |
where is the radiation field in units of the Habing field (108 photons cm-2s-1), is the visual extinction and is the photodesorption yield. We use the temperature dependent value of as determined experimentally by Westley et al. (1995); From Figure 2 of Westley et al. Y = 0.003 molecules per photon at 50 K and rises to 0.075 at = 100 K.
We include the effects of desorption caused by photons from the interstellar radiation field, the stellar field and from the cosmic ray induced photon field (Prasad & Tarafdar, 1983).
2.5 Grain surface chemistry
Previous models of deuterium chemistry in disks have ignored grain surface reactions and thereby have excluded a potentially very important contribution to the molecular D/H ratios. The inclusion of grain chemistry is problematic, as the simplest way is to use the rate equation method, but this gives very different surface abundances than the more exact Monte Carlo model. Caselli et al. (2002) found that using the H–atom scan rates of Katz et al. (1999), which are much lower than usually assumed, produces grain mantle abundances in better agreement with Monte Carlo models than the results from standard rate equation models. The work of Katz ETA al. has been disputed, e.g. by Hornekaer et al. (2003) who find that H2 forms very efficiently on grains, possibly by H–atoms tunneling through barriers on the grain surface. However, because of the advantage in going some way to correcting the short-comings of the rate equation method we use the Katz wt al. scan rates here, and assume that the scan rate for D–atoms is also slow.
We assume that reactions on grain surfaces can occur only if one of the reactants is an atom. All other species are assumed to be immobile. The reaction set is taken from Hasegawa & Herbst (1993) with the addition of the equivalent deuteration reactions. Activation barriers for the deuterium reactions are taken from Caselli et al. (2002). The rates are temperature dependent and the reaction rate between two species, and , is given by
| (7) |
where = e ( is the activation barrier to the reaction), is the total number of sites on the surface of the grain and is the grain number density. The rate at which and scan the surface of the grain is given by and :
| (8) |
where is the binding energy (from Table The chemistry of multiply deuterated molecules in protoplanetary disks. I. The outer disk) and is given by Equation 5.
Important parameters are the binding energies of H and D atoms and their reaction rates on the grains. For the formation rate of H2 we have used the work of Cazaux & Tielens (2002, 2004) who developed a model of this process that fits the experimental data for the reaction of two hydrogen atoms on silicate and amorphous carbon grains. They find that H2 formation can be efficient at temperatures up to 500 K on these surfaces. This model takes into account the possibility of both chemi- and physi-sorption and assumes a high binding energy of 600 K for atomic hydrogen atoms adsorbed onto a silicate surface. This value of (H) is rather higher than the 350 K Tielens & Allamandola (1987) which we have assumed in our previous work, and which results in a greatly reduced H2 formation rate at 15 K. For deuterium atoms we follow Caselli et al. (2002) and take (D) = (H) + 21 K (21 K is the zero point energy difference between the hydrogen and deuterium atoms). Recent calculations of the binding energy of H–atoms adsorbed onto water ice have found values ranging from 400 K (Al-Halabi et al., 2002) to 575 K (Perets et al., 2005). Our choice of 600 K is therefore a little high, but consistent with the larger of these calculated values. Given the uncertainty in (H) we compare the results for (H) = 600 K with those for (H) = 350 K in Section 3.1.5 to determine the effects of our choice on the chemistry.
2.6 Ionization processes
Ionization in the disk can arise from several sources:
-
1.
UV photons
In the surface layers ionization by UV photons from both the stellar and interstellar radiation fields is important. We assume that the stellar photons travel out radially and that the interstellar photons hit the disk vertically. The two fields are combined to give an overall UV flux at each position in the disk. The strength of the stellar UV field for a T Tauri star has been estimated as 104 times the interstellar radiation field () at 100 AU by Herbig & Goodrich (1996). More recent observations by Bergin et al. (2003) have estimated a much lower value of a few hundred times . We have chosen a value of 500 at 100 AU. In common with Aikawa et al. (2002) we assume that the stellar field does not dissociate CO and H2, although these molecules are dissociated by the interstellar radiation field. We use the approach of Lee et al. (1996) to describe the self–shielding of both molecules. The Lee et al. model is based on a slab model of a molecular cloud and provides data for the shielding due to H2, CO and dust as a function of column density. The linewidths assumed are 3 kms-1 – much larger than observed in disks, where the velocity dispersion in the outer disk is almost thermal (Guilloteau & Dutrey, 1998). To take account of this we have followed Aikawa & Herbst (1999b) in scaling the column densities in Table 10 of Lee et al. by /3 kms-1 where is the sound velocity. This scaling factor is only required for H2 since CO dissociation lines are broader due to predissociation.HD does not self–shield. However some of its lines do overlap with those of H2 allowing shielding by the H2 lines to reduce its photodissociation rate. Barsuhn (1977) estimated that the HD photodissociation rate will be reduced by 1/3, assuming that the overlapped HD lines are totally shielded by H2. We adopt this factor and scale it where necessary to take account of the region where H2 does not fully self–shield.
-
2.
Cosmic rays
Cosmic rays can produce ionization in the disk if the surface density is low enough for them to penetrate i.e. less that 150 g cm-2 (Umebayashi & Nakano, 1981). This is always the case in the region of the disk considered here. Cosmic rays can cause ionization both directly and indirectly by producing photons from their interaction with H2. The rates of these processes are taken from the UMIST ratefile with an assumed cosmic ray ionization rate of 1.3 10-17 s-1. -
3.
Radioactive isotope decay
The decay of radioactive nucleides is an additional source of ionization. 26Al can decay to form excited 26Mg, which in turn decays by either positron decay or by electron capture. We include ionization due to these processes with a rate:(9) (Umebayashi & Nakano, 1981)
-
4.
X–rays
T Tauri stars are strong X–ray emitters. Igea & Glassgold (1999) modeled the effects of X–ray ionization in a disk and found that it can be effective in the surface layers where the attenuation length of X–rays is very small. Aikawa & Herbst (2001) included the effects of X–rays in their model of the chemistry in the outer disk, but found that they did not significantly affect the results for this region. Based on this we have chosen to ignore the effects of X–rays in these models.
2.7 Input abundances for the disk model
We assume that the material which is incorporated into the disk has first been processed to some extent in the parent molecular cloud. We therefore use the abundances produced by a molecular cloud model that has been run for 1 Myrs as inputs to the disk model. The elemental abundances used as inputs to the cloud model are listed in Table 2. We assume that initially all hydrogen is molecular and that the deuterium is in HD. All other elements are in their atomic form, with the exception of carbon which is ionic. The molecular cloud model is run at a density of 2 104 cm-3, T = 10 K and a visual extinction of 10 magnitudes. It includes all the processes that are included in the disk model, with the exception of photodesorption and ionization by the decay of radioactive nucleides. The molecular abundances which are used as inputs to the disk model are given in Table The chemistry of multiply deuterated molecules in protoplanetary disks. I. The outer disk. For comparison we also include the molecular abundances observed in the dark cloud TMC–1. In general we find good agreement between these observations and the abundances calculated in the molecular cloud model.
2.8 The disk model
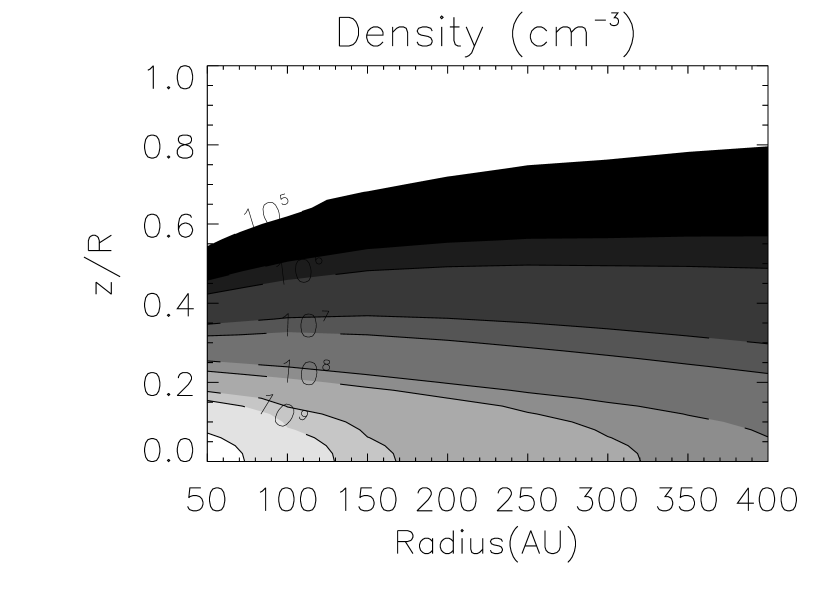
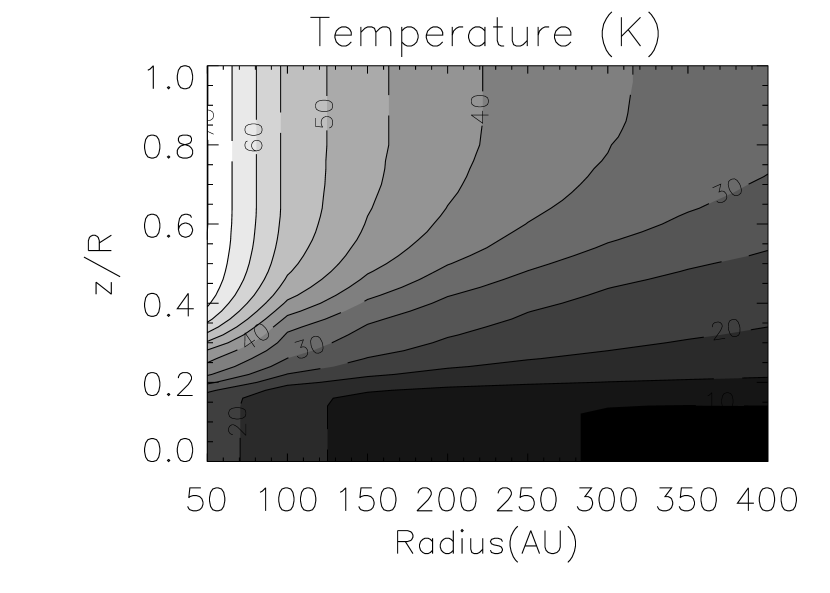
We have used the disk model of d’Alessio et al. (2001) with a mass accretion rate, = 10-8 M⊙ yr-1 to provide the physical parameters of the disk used here. The central star has a temperature of 4000 K, a mass of 0.7 M⊙ and a radius of 2.5 R⊙. The surface density is 25 gcm-2 at 10 AU and varies as 1/ for 10 AU. The disk mass out to 400 AU is 0.063 M⊙. The grain size distribution is given by with 0.005 m 0.25 m. The density and temperature distributions are shown in Figure 1. The gas temperature is set equal to the grain temperature, and the density and temperature are assumed to remain constant over the timescale considered in the chemical model.
3 Results
In the discussion that follows we look at the results of our models. Since the majority of molecules have been observed in the gas phase of disks we concentrate on these, but we also include a discussion of the grain chemistry and abundances because in some regions of the disk the solid phase is the dominant component, and because of the importance of grain chemistry in determining the gas phase composition and molecular deuteration. We look at how the molecular abundances vary with height above the midplane, and at the radial column density distribution. Finally, we compare our results with the available observations and use this to determine whether we can say anything about the nature of the desorption processes acting in the disk.
3.1 The vertical molecular distribution
3.1.1 Gas phase
We begin by looking at the vertical abundance distributions at = 250 AU and a time of 1 Myrs. In this section we concentrate on Model B; differences in the chemistry that arise because of desorption processes included in the other models are discussed in the next sections.
The fractional abundances as a function of height, , above the midplane are displayed in Figure 3. The three layer structure (see Figure 2) found by previous authors (Aikawa et al., 2002; Willacy & Langer, 2000; Aikawa & Herbst, 1999b) is clearly seen, with most molecules having low abundances in the midplane (due to freezeout at 50 AU) and in the surface layers (due to photodissociation at 100 AU), and abundance peaks in the molecular layer, which for this model is between 50 and 95 AU above the midplane.
The midplane is not completely devoid of molecules since desorption by CRH can maintain low levels of CO and N2 in this region. The reaction of these two species with H and its deuterated isotopomers results in the formation of N2H+, N2D+, HCO+ and DCO+. Since the temperature is cold, there is a high level of deuteration of H, producing high D/H ratios in the daughter molecules. The presence of CO and N2 in the gas reduces the deuteration of H compared to Model A (which does not have non–thermal desorption) from D/H 70 to a value of 25. Deuterated H forms from the reaction of HD with the previous molecule in the chain e.g. H2D+ reacts with HD to form HD. If CO and N2 are present in the gas, H and its deuterated isotopomers are more likely to react with these molecules than with HD, reducing the formation rate of the deuterated molecules (see Ceccarelli & Dominik (2005) for details).
The molecular layer begins at the point where thermal desorption can remove some molecules, mainly CO, N2 and CH4 from the grains. The upper boundary is set by photodissociation. In the molecular layer most of the CO cycles between its gaseous and solid phases, but a small proportion is broken up by reaction with He+ releasing C+ and O, some of which go on to form molecules in the gas such as H2O and H2CO. At 90 AU photodissociation can begin to destroy CO, forming carbon and oxygen atoms which do not reform CO but instead are converted into other molecules such as H2O and hydrocarbons. These subsequently freezeout and are not sufficiently volatile to be thermally desorbed. Carbon and oxygen are thus removed from the gas, leading to a sharp decrease in the abundance of CO at 90 AU. At the very top of the disk most of the carbon is in its ionic form, since it is efficiently produced by photoionization and the temperature is warm enough that its freezeout is not efficient.
N2 exists in a narrower region than CO. CRH ensures that it is present in low abundances in the midplane. Above this, just below the level at which thermal desorption becomes efficient ( 50 AU), its fractional abundance shows a decrease from its midplane value. The loss of N2 is a result of its conversion into N2H+ and N2D+. These ions can be destroyed either by reaction with CO or by recombination with electrons. At 45 AU, the main process is recombination, which produces mostly nitrogen atoms with NH and ND. These freezeout and are quickly hydrogenated to form ices of ammonia and its deuterated equivalents. Once CO begins to thermally desorb, its reaction with N2H+ and N2D+ becomes their main destruction route, producing N2, rather than N and NH or ND, and so less nitrogen is lost by conversion into non–volatile ices.
Moving to higher , there is a relatively narrow peak in the abundance of N2 due to thermal desorption. This is followed by a rapid decrease in abundance at 65 AU where photodissociation becomes efficient and the molecule is destroyed. The resulting nitrogen atoms can freezeout onto grains where they react quickly with hydrogen atoms to form NH, the first step towards forming ammonia ice. However NH is very volatile, with a binding energy of only 604 K (Allen & Robinson, 1977) and so can be easily returned to the gas (if the temperature is high enough) before hydrogenation can occur. The volatility of NH drives the nitrogen chemistry in the gas at 100 AU. Formation of gaseous molecules such as HCN and CN can proceed via
| (10) |
The photodissociation of CN produces nitrogen atoms and the cycle starts again. This process is sufficiently rapid to maintain low abundances of HCN in the gas phase, even in regions with high UV fields.
Several other molecules also have small abundance peaks at the surface of the disk e.g. CH and H2O (Figure 3). These are formed in the warm gas by efficient reactions involving the atoms and ions produced by the photodissociation of molecules. The number of molecules produced is relatively small and does not greatly affect the calculated column densities.
The effects of the increase in temperature with on the D/H ratios can be seen in Figure 3. H is highly deuterated at 50 AU, with the most abundant isotopomer being D. At higher , H is more abundant and of the deuterated forms only H2D+ is important. The peak in H between = 90 and 130 AU is due to the heavy depletion of molecules that would normally destroy it e.g. CO and N2. The variation in D/H ratio with for H translates into variations in the D/H ratio of other molecules e.g. DCO+/HCO+ 1 at 50 AU, but at 50 AU HCO+ is the dominant isotopomer.
3.1.2 How photodesorption affects the calculated gas phase abundances and the molecular deuteration
Figure 4 shows the fractional abundances at 250 AU as calculated in Model C which includes both photodesorption and CRH. (Model D, which includes only photodesorption has a similar abundance distribution to Model C for 60 AU, but with much lower gas phase abundances in the midplane.) Photodesorption provides an efficient means of returning accreted species to the gas, especially important for those molecules which are too strongly bound to be affected by thermal desorption. It produces higher fractional abundances than Model B in the molecular layer, where the UV field is high enough that molecules can be removed from the grains but low enough that they can still survive in the gas. Photodesorption also increases the depth of the molecular layer.
At = 250 AU, photodesorption affects the vertical distribution of most molecules, even those that can thermally desorb. Without photodesorption, elements are gradually removed from the gas by being incorporated into less volatile molecules e.g. carbon is removed from CO and converted into hydrocarbon ices, and oxygen and nitrogen form H2O and NH3 ices respectively. When photodesorption is included we see large increases in the extent of the CO and N2 layers. The most dramatic differences are for the less volatile species. For example, the peak fractional abundance of HCN increases to 2.5 10-8 in Model C from 6 10-11 in Model B. NH3 and H2O show dramatic increases in both peak fractional abundance and column density. All of these molecules can form rapidly on the grain surface, where deuteration is also efficient and so high column densities of HDO, D2O, NH2D etc. are also seen. Similarly, N(H2CO) is increased by grain formation and desorption, although to a lesser extent than some of the other molecules.
3.1.3 The effectiveness of cosmic ray heating
Desorption due to cosmic ray heating (CRH) was first suggested as a means of preventing the complete depletion of CO from the gas in cold, prestellar cores (Leger et al., 1985). It was extended to cover other molecules in molecular cloud models (Hasegawa & Herbst, 1993) and has been included in disk models by Willacy & Langer (2000) and Willacy et al. (2006). Here we examine whether its inclusion affects the calculated abundances and column densities.
A comparison of the column densities calculated at = 250 AU for Models A and B (Table 4) shows that there is little difference for non-deuterated molecules. However, several deuterated molecules are affected by CRH, because this allows molecules to be exist in the gas in the cold midplane of the disk where deuteration is efficient. For example, in Model B we see high abundances of DCO+ at 50 AU (Figure 3). In Model A, CO is not present in the gas in the midplane, and therefore neither is DCO+. At 50 AU, where the temperature is high enough for CO to thermally desorb, the temperature is also high enough that deuteration is less efficient and so little DCO+ is present in Model A. A similar effect is seen for deuterated nitrogen-bearing molecules such as N2D+. This difference in D/H ratios provides a possible means of using the observations to differentiate between the models as shown below.
3.1.4 Vertical abundance distribution of the ices
Figure 5 shows how the mantle abundances vary with at = 250 AU for Models B and C. In both models, the most volatile species have sharp decreases in abundance at 60 - 70 AU where thermal desorption is able to return them to the gas. This corresponds to the peak in gas phase abundance seen in Figure 3. In Model B, H2CO and its isotopomers, which have a higher binding energy than CO, N2 and CH4, are removed from the grains at = 128 AU. In Model C, all species leave the grain between = 80 – 100 AU due to photodesorption.
In Model B many of the less volatile ice species show little change in abundance with height above the midplane, but there are some interesting variations, especially for molecules that contain two or more deuterium atoms. In the case of D2O, this molecule forms on grains by the addition of deuterium atoms to an accreted oxygen atom, but hydrogenation competes with the deuteration resulting in the production of H2O and HDO as well as D2O. The proportion of oxygen atoms ending up in D2O depends on the relative abundance of gaseous atomic hydrogen and deuterium. At D/H is high, ensuring that deuterium addition is efficient. At higher , photodissociation begins to break down the main molecular reservoirs of hydrogen and deuterium, namely H2, HD and D2. Since there is more hydrogen tied up in these molecules than deuterium, their photodissociation results in a decrease in the atomic D/H ratio, and hence deuterium addition to accreted oxygen atoms becomes less competitive with hydrogen addition. The rate of formation of D2O falls and we see this as a decrease in its abundance above = 90 AU. The same processes affect the abundances of NHD2 and ND3 which are also formed on the grains.
Several molecules e.g. H2O, HDO, HCN and DCN show peaks in abundance between = 50 and 150 AU. In this region, CO is abundant in the gas phase, where it can be broken up into C+ and oxygen atoms by reaction with He+. Some of the oxygen atoms freezeout and react with hydrogen or deuterium, producing abundance peaks in H2O and HDO. Similarly, the freezeout of C+ can result in its reaction with nitrogen atoms on the grain surface to form CN and subsequently HCN and DCN. There is also a peak in the abundance of hydrocarbons in the ice in this region. These form efficiently on the grains by the reaction of carbon (produced by the photodissociation of CO in the gas) and hydrogen. Their abundance falls at 140 AU, where the majority of carbon exists as gas phase ions.
Model C shows similar behavior at 80 AU. The peak in CO2 ice abundance just below this is due to its efficient formation in the gas by the reaction of OH and CO. The CO2 then freezes out. Photodesorption is active at this but not sufficiently so to remove all of the accreted mantles. Above = 80 AU photodesorption dominates and the mantles are removed by = 130 AU.
3.1.5 How assumptions about the binding energy of hydrogen atoms affect the results
As discussed in Section 3.1.5 we have elected to use a relatively high value of (H) = 600 K (Cazaux & Tielens, 2002). This is almost double our previously assumed value of 350 K, and results in more efficient H2, HD and D2 formation at temperatures above 15 K, with correspondingly lower gas phase abundances of atomic hydrogen and deuterium. The binding energy not only controls the residence time of hydrogen atoms on the grain, but also affects their ability to react. Hence the higher binding energy used here will increase the time that a hydrogen atom remains on the surface but will also reduce the rate at which hydrogenation processes can occur.
To determine how (H) affects the chemistry we reran Model B at = 250 AU but this time with (H) = 350 K and (D) = 371 K. All other binding energies and assumptions remain the same. The reduction in increases the abundance of atomic hydrogen at 50 AU. For example, at = 70 AU (within the molecular layer) (H) increases from 2.5 10-7 for (H) = 600 K to 4.7 10-4 for (H) = 350 K. A similar increase is seen in the atomic deuterium abundance. The column density of H doesn’t change but that of D increases from 6.5 1015 cm-2 to 3.5 1016 cm-2.
The changes in H and D abundance lead to changes in the abundances and column densities of other gaseous molecules. (The column densities of molecules in the ice mantles do not show much variation with the change in (H)). In the gas phase, with (H) =350 K N(H2O) increases by a factor of 10, as does N(H2CO), N(HDCO) and N(NH2). The largest increase is for CH3OH whose column density increases from 6.5 105 cm-2 to 2.2 107 cm-2. The reduction in binding energy also changes some deuteration levels, most noticeably DCO+/HCO+ increases to 3.4 (up from 0.9 in Model B).
Using the lower value of (H) in Model D changes the column densities even more. There are large reductions in column densities of factors between 5 and 10 for many of the deuterated molecules, including D2O, all of the deuterated isotopomers of CH4 and NH3, DCN, and C2D. For example, N(D2O) is reduced from 7 1012 cm-2 to 8.7 1011 and N(DCN) from 1.2 1012 cm-2 to 1.2 1011 cm-2. DCO+/HCO+ is also a factor of 4 higher than in Model D.
The choice of H-atom binding energy can therefore have quite an effect on the calculated abundances. We have chosen the larger value since the results for a few species are in better agreement with the observations: in particular using (H) = 350 K produces DCO+/HCO+ ratios which are much higher than observed.
3.2 The radial distribution of molecules
The radial distribution of molecular column densities, as calculated in Model B, are shown in Figure 6. N(CO) is fairly flat with radius for 100 AU, but shows a sharp rise at = 50 AU, where thermal desorption of this molecule is efficient throughout the vertical extent of the disk. N2 has a more gradual increase because of its slightly lower binding energy which means that it can desorb at larger radii. As discussed in the previous section, the presence of these volatile species in the gas can lead to the production of other molecules, which are not themselves thermally desorbed. For example, photodissociation of N2 and CO can release the elements required to form molecules such as HCN and HCO+, and the column densities of these species increase towards the central star.
N(D) falls off with decreasing radius, because of the increase in temperature which inhibits its formation from H. The relative levels of deuteration in some other molecules such as HCO+, H2O, HCN and NH3 also decrease with decreasing . CH4 and H2CO do not show this decrease in deuteration, because they can form from CH2D+, which is less temperature sensitive due to the higher energy barrier for the conversion of CH2D+ back into CH ( = 370 K compared to = 230 K for the conversion of H2D+ into H). Hence deuteration via reactions of CH2D+ is more efficient in the warmer regions of the disk, than deuteration via H2D+.
The column density of H2O falls off as the radius decreases until = 200 AU where it begins to rise again. The decrease at = 50 AU is due to the high photon field.
The radial distribution of column densities is also affected by photodesorption (Model C: Figure 7), which increases the column densities of molecules at larger radii. Little difference is seen in the column densities of volatile species in the two models at = 50 AU, but at larger radii photodesorption increases both N(CO) and N(N2). In contrast, some molecules are little affected at large radii by the inclusion of photodesorption. For example, DCO+ and HCO+ have the same column densities in both models, as do N2H+, CH4 and their isotopomers.
The distributions of HCN, DCN and CN are all related, with CN being a photodissociation product of the other two molecules. Their column densities in Model C are fairly constant with radius for 200 AU, but all three molecules show decreases in column density at smaller radii, caused by the increase of photodissociation rates closer to the star. The column densities in Model C are much higher than in Model B and the radial distributions are different. In Model B, CN, HCN, and DCN all peak towards the center of the disk, whereas in Model C CN and HCN show a slight decrease.
3.3 The effect of disk chemistry on D/H ratios
3.3.1 D/H ratios in the gas phase
Aikawa & Herbst (1999a) found that chemical processing in the disk can affect the molecular D/H ratios and they therefore suggested that the ratios observed in comets do not just reflect the values set in the parent molecular cloud, but are instead a combination of processing in the cloud, during the infall phase and in the disk. Similarly, we find that gas phase D/H ratios are greatly changed by the disk chemistry. The situation for the grain mantles is a little more complicated, with disk chemistry having large effects on some molecules, and very little on others. This will be discussed below.
Table 5 lists the calculated D/H ratios at = 250 AU for each model and compares them to the input values as determined in the molecular cloud model. In the midplane very few molecules remain in the gas. Those that are present show a considerable increase in deuteration ratios compared to the input values. The effect is most marked for multiply deuterated molecules. Thus D/H increases from 3.1 10-3 in the molecular cloud to 25 in the midplane of Models B and C, due to the high molecular depletions in the disk. This compares to H2D+/H in the same models, which increases from an input value of 0.16 to 0.95. The increase in the midplane D/H ratio is even higher in Models A and D where the depletion is also higher due to the absence of CRH.
The radial variation of the ratios of the column densities of deuterated to non–deuterated molecules in Model B (Figure 8) shows a similar distribution to those of Aikawa & Herbst (2001). There is a decrease in D/H with decreasing radius for molecules such as NH3, H2O and HCO+ whose deuteration depends on the isotopomers of H. The deuteration of H decreases towards the star because of the increase in temperature. Molecules such as H2CO and CH4 whose deuteration depends on CH are less affected by the temperature increase, since the barrier to the reverse reaction of
| (11) |
at 370 K is higher than that for H2D+ + H2 H + HD (220 K). The ratio CH2D+/CH decreases towards the center of the disk, because there is a fall in HD in the molecular layer, caused partly by the increase in photodissociation as the UV field increases and partly by the efficient incorporation of deuterium into water and ammonia ices.
With the inclusion of photodesorption the picture changes. This mechanism can alter the molecular D/H ratios by injecting molecules formed on the grains into the gas and therefore the gaseous D/H ratios partly depend on the ratios in the ice mantles. Some molecules do not show much variation in the D/H ratio with photodesorption e.g. HDCO/H2CO and DCO+/HCO+ are roughly the same in both Models B and C.
In Models C and D the high abundance of molecules in the molecular layer keep the abundances of H and D in this region low. Hence most of the H and D are in the midplane where the temperatures are low and the deuteration is high leading to high D/H ratios for these models. In Models A and B the higher depletion at 50 AU means that the destruction rate of H is lower and we see a secondary peak in abundance for this molecule at 70 - 120 AU (Figure 3). Consequently N(H) is higher and N(D)/N(H) is lower in these models.
In Model B we find that DCN/HCN decreases slightly with decreasing radius in agreement with Aikawa & Herbst (2001), although our ratios are slightly higher than theirs. At large radii DCN forms from DCNH+ which is produced by the reaction of either DCO+ or D with HNC. Hence DCN/HCN is dependent on the deuteration of H. At = 50 AU, neutral–neutral reactions become important with DCN forming from D + HNC DCN + H and therefore the DCN/HCN ratio is dependent on the atomic D/H ratio. Another important route to both DCN and HCN at small radii is the reaction of N with either CH2D or CH3. DCN/HCN is also relatively constant with for Model C, where both molecules form on the grain surfaces and then photodesorb. In this case their ratio is therefore dependent on the gas phase atomic D/H.
In summary, chemical processing in the disk can affect the D/H ratios of some molecules. The effects is strongest for multiply deuterated molecules, and for ammonia. The radial variation of molecular deuteration depends on the formation route of the deuterated molecule, with species that are deuterated via reactions with H2D+, HD and D showing a decrease in the deuteration with decreasing radius, in contrast to molecules deuterated by CH2D+, CHD and CD. If photodesorption is included then the formation of deuterated molecules on the grains becomes more important.
3.3.2 D/H ratios in the ice mantles
In general, chemical processing in the disk has less effect on the D/H ratios of the ices than on the gas phase molecules. Looking first at the midplane (Table 5) we find that the ratios calculated for the ices in Model A are close to the input values, with the exception of DCN/HCN. Model A also shows no change in the fractional abundances of most ice molecules. At the start of the model, most molecules have much higher abundances on the grains than in the gas, and so the freezeout of the gaseous molecules does not greatly affect the grain mantle abundances. The exceptions are for CO, N2, HCN and DCN. For CO and N2 the initial gas phase abundances are high. In the case of HCN and DCN these molecules form on the grains from the freezeout and hydrogenation/deuteration of CN.
CRH causes some changes in the ice deuteration in the midplane in Models B and C. As in the gas we find that the biggest changes are for multiply deuterated molecules. The break up of desorbed CO and N2 provides carbon ions and oxygen and nitrogen atoms which can freezeout and react on the grain surface, most likely with hydrogen or deuterium. The relative efficiency of these two processes depends on the atomic D/H ratio, which in the midplane is very high. Hence multiply deuterated ices are easily formed in this region. Ammonia ice is particularly highly deuterated because a lot of it is produced in the disk (due to the high input abundances of both gaseous and solid N2 which provide a plentiful source of nitrogen atoms), whereas for H2O and CH4 the majority of these ices are produced in the molecular cloud phase and the disk chemistry makes a much lower contribution to both their abundances and their deuteration.
If we calculate the molecular D/H ratios from the column densities of the ices, we again find that Models A and D show the least change from the molecular cloud values. In Models B and C the column density ratios show similar behavior to the midplane ratios, with multiply deuterated species and the isotopomers of ammonia being most affected.
In summary we find that the inclusion of a non–thermal desorption process, such as CRH, which is effective in the midplane will affect the D/H ratios of some of the ice molecules and that this effect increases for multiply deuterated molecules. Such a process would be expected to alter the D/H ratios of the material that is later incorporated into Solar System bodies such as comets. In the absence of such a non–thermal desorption process, the ice mantles retain the D/H ratios set in the molecular cloud and are unaffected by the disk chemistry. The exception to this is ammonia, which is predicted to be highly deuterated in the ice by all of our models. At smaller radii, where thermal desorption is efficient, we would expect that disk chemistry will play a more important role in determining the D/H ratios of the ices.
There are limitations to our model. We have not incorporated chemical processing of the grain mantles by cosmic rays or UV photons. UV will not be important in the heavily shielded midplane and so can be safely ignored in this region, but cosmic rays can penetrate and may have a chemical effect. Whether or not this can affect the D/H ratios is unclear. A further complication ignored here is processing of the grain mantles during the collapse phase as the molecular cloud material is accreted into the disk. An accretion shock forms at the surface of the disk and it is possible that the grains will lose their mantles as they travel through this. Lunine et al. (1991); Chick & Cassen (1997) find that grains will lose their water ice coatings if they are infalling at radii of less than 30 AU, with the effect decreasing with increasing radius (Lunine et al., 1991). The grains will regain their ice mantles once they have passed through the shock, but processing in the shock could alter the composition and deuteration levels of the ices. Both these papers suggest that at least some of the material in comets comes directly from the interstellar medium. At the radii under consideration here, it seems likely based on Lunine et al. (1991); Chick & Cassen (1997) that at least some of the grains will retain their volatiles as they are accreted into the disk. At present it is unclear what effect the accretion shock would have on the D/H ratios of the ice mantles on grains at smaller radii, where these mantles may have been desorbed in the shock and the released molecules processed in the gas before re–accreting onto the grains.
It has been suggested that comets are composed of interstellar grains that have undergone relatively little processing in the Solar Nebula (see review by Irvine et al., 2000, and references therein). One reason for supposing this is the similarity between the chemistry of comets and interstellar clouds, and in particular the similarity between the molecular D/H ratios. Dynamical studies of comets have shown that short period comets formed in the trans–Neptunian region (Duncan et al., 1988) whereas long period comets formed closer to the Sun and then had their orbits perturbed by interaction with the giant planets, to eject them outwards to the Oort cloud. Our model is of the outer disk, with an inner radius well outside the region where long period comets - the only ones for which we have observed D/H ratios - are likely to have formed. Still we include the comet data here for comparison, while recognizing that models of the inner disk are required to properly cover the comet formation region. In Hale–Bopp, DCN/HCN = 2.3 10-3 (Meier et al., 1998a). HDO/H2O = 3.3 10-4 in Hale–Bopp (Meier et al., 1998a) and 2.9 10-4 in Hyakutake (Bockelee-Morvan et al., 1998). Our model results are close to the input values with DCN/HCN 6.6 10-3 and HDO/H2O 2.7 10-2 in the midplane at = 50 AU (Model D). The DCN/HCN ratio is consistent with the observations but HDO/H2O is much higher than the observed value. The discrepancy could be a result of too efficient deuteration on grain surfaces, or it could be because our model considers a region further out in the disk than the comet formation radius. Processing at a small radii (with higher temperatures) could reduce the calculated HDO/H2O value.
4 Comparison to observations
One reason for modeling the outer parts of the protoplanetary disk is that most current observations in the millimeter and submillimeter probe this region and therefore can provide a test of the models. Three disks in which several molecules (including deuterated forms) have been observed are LkCa15, DM Tau and TW Hya.
-
•
TW Hya: This object is the closest classical T Tauri star known. Its disk is almost face on with a radius of 200 AU. It is relatively old with an estimated age of 5 - 20 Myrs. It has a mass accretion rate, = 10-9 – 10-8 M⊙ yr-1 (Kastner et al., 2002). The disk mass is estimated from continuum observations to be 3 10-2 M⊙ (Wilner et al., 2000).
-
•
LkCa15: This source is one of the strongest T Tauri emitters in the millimeter found in the survey of Beckwith et al. (1990). It is found located in Taurus and has an age of 3–10 Myrs (Simon et al., 2000; Thi et al., 2001). The disk mass is 0.03 M⊙ and the mass accretion rate is 10-9 M⊙ yr-1 (Hartmann et al., 1998). The disk radius is 650 AU (Simon et al., 2000). The stellar mass is 1 M⊙ (Simon et al., 2000) and its temperature is 4365 K (Muzerolle et al., 2000)
-
•
DM Tau: This object is also found in Taurus. It has an age of 5Myrs. Its stellar mass is 0.55 (Simon et al., 2000) and its stellar temperature is 3720 K (Guilloteau & Dutrey, 1998). The disk has a mass of 0.03 M⊙ (Guilloteau & Dutrey, 1998), a radius of 800 AU (Simon et al., 2000) and a mass accretion rate of 10-8 M⊙ yr-1 (Hartmann et al., 1998).
We compare our results with the available observations of both deuterated and non–deuterated species. The column densities derived from observations are very sensitive to assumptions made about the source. Single disk observations cannot resolve the disks and assumptions about the density and temperature structure of the disks must be made in order to determine abundances and column densities. For DM Tau, Dutrey et al. (1997) determined the gas density distribution of a geometrically thin disk in hydrostatic equilibrium and used this to derive the average fractional abundances with respect to H2, assuming that the fractional abundances were the same everywhere in the disk. Aikawa et al. (2002) used the model and data from Dutrey et al. (1997) and integrated vertically to determine the column densities quoted in Table The chemistry of multiply deuterated molecules in protoplanetary disks. I. The outer disk. For LkCa15 both single dish and interferometric data is available. Qi (2001) used the Owens Valley Radio Interferometer (OVRO) array to observe this source and derived beam average column densities. The resolution of the array ( 300 AU at the distance of LkCa15) is such that the source is just resolved. Thi et al. (2004) present single dish observations of LkCa15. They derive the column densities assuming that the radius of the disk is 450 AU. The disk radius can have a large effect on the calculated column densities with a change from to scaling the column densities by . The single dish column densities are significantly higher than those from the interferometer data due to the differences in the assumptions used to determine these numbers.
Several deuterated molecules are now claimed to have been detected in protoplanetary disks. However, it should be noted that some of these detections have recently been disputed. Guilloteau et al. (2006) re–analyzed the spectra of HDO and H2D+ in DM Tau (Ceccarelli et al., 2005) and found only a 2- detection of H2D+ and no evidence of HDO in this disk. They attributed the discrepancy between their work and that of the original authors to the use of an over–estimation of the continuum flux and the wrong systematic velocity by the latter. In the following discussion we have elected to use all the available data on deuterium molecules in disks for comparison with our models, including that which is still under dispute.
The observations referred to here are of the outer disk, where the radius is greater than 50 – 100 AU. Here we use our results at = 250 AU as representative of the outer disk model and compare these to the observations. The results for Models B, C and D, together with the observations are given in Table The chemistry of multiply deuterated molecules in protoplanetary disks. I. The outer disk. Good agreement is defined as less than a factor of 5 difference between the models and the observations. We have not included Model A in this table since the column densities for this model are consistently lower than the others and much lower than observed, indicating that non–thermal desorption is required to account for the observations.
For each source we find that Models C and D give better agreement with the observations than Model B. In particular, strongly bound molecules such as HDO require the presence of photodesorption in order to remain in the gas phase.
Ceccarelli et al. (2005) observed HDO in absorption in DM Tau using the JCMT and determined N(HDO) = 1.6 1013 cm-2. In Model B, N(HDO) is too low at 9.3 109 cm-2 to account for the observations, but in Models C and D photodesorption can keep a much higher abundance of HDO in the gas. These models have N(HDO) = 2.0 1014 cm-2, somewhat higher than the observed value, but demonstrating that photodesorption is an efficient means of returning HDO (and other molecules) to the gas.
Dominik et al. (2005) also looked the effects of photodesorption on water and its isotopomers. Using a simplified model they calculated the column density of H2O averaged across a face on disk to be 1.6 1015 cm-2, in excellent agreement with our model. Combining their model results with the observations of Ceccarelli et al. (2005), they estimate HDO/H2O 0.01. Our models calculate much higher ratios with HDO/H2O = 0.13 in Models C and D. These calculated ratios are also much higher than are observed in Solar System objects and may point to deuteration on the grains being less efficient than assumed here.
There is another reported detection of HDO in a protostellar disk. Qi (2001) observed HDO in LkCa15 using the OVRO interferometer and found N(HDO) = 2 – 7 1014 cm-2, with an intensity peak that was offset from the central star. As in DM Tau, models that include photodesorption give the best agreement with the observations.
Qi (2001) also observed DCN in LkCa15 with N(DCN) 1013 cm-2 and DCN/HCN = 0.01. Model B calculates a low value of N(DCN) = 8.9 108 cm-2, but Models C and D have N(DCN) = 1.2 1012 cm-2 (DCN/HCN = 0.036), in good agreement with the observations.
H2D+ has been observed in DM Tau (Ceccarelli et al., 2004) with a column density of 8.8 1012 cm-2, and a midplane fractional abundance (H2D+) = 3.4 10-10. In all our models we find (H2D+) few 10-12 in the midplane for 100 AU, and N(H2D+) few 1011 cm-2. Our calculated N(H2D+) is therefore a factor of 10 lower than observed and our midplane fractional abundance more than a factor of 100 lower.
DCO+ and HCO+ have both been detected in two sources: DM Tau (DCO+/HCO+ = 4 10-3; Guilloteau et al., 2006) and TW Hya (DCO+/HCO+ = 0.035; van Dishoeck et al., 2003). The formation of these molecular ions depends on the presence of CO in the gas. The column density of CO in DM Tau is 5.7 1016 cm-2 (Dutrey et al., 1997) in good agreement with all our models. Guilloteau et al. (2006) do not give a column density for DCO+, but in TW Hya N(DCO+) = 3 1011 cm-2 compared to the calculated values of 3.1 1012 in Models B and C and 4.8 1011 in Model D. In the same source, N(HCO+) = 8.5 1012 cm-2 and the model values, which range from 2.8 - 3.3 1012 cm-2, are in good agreement with this. In our models the desorption process that affects the calculated ratios most is CRH. This allows CO to be present in the cold midplane where deuteration is most efficient. When CRH is included N(DCO+) is high and our calculated DCO+/HCO+ 1 (Models B and C). Without CRH (Model D) both N(DCO+) and the ratio of 0.18 are in agreement with the TW Hya observations. However for this model DCO+/HCO+ is 42 times higher than seen in DM Tau. The observations and modeling of the DCO+/HCO+ ratio suggests that CO is not present in the midplane, but instead does not begin to become abundant until the disk is warm enough that deuteration is not so efficient, as happens in Model D. Based on this we suggest that CRH is not acting in disks, or if it is, it is less efficient than assumed in our (and other) models.
Qi et al. (2003) observed N(N2H+) = 3.1 1013 cm-2 in LkCa15. The highest column density found in any of our models is 2.8 1010 (Model C), 1100 times lower than observed. The discrepancy is even larger for Model D, where N(N2H+) = 1.1 1010 cm-2. The increase in N(N2H+) in models that include CRH suggests that a high column density of N2H+ requires that N2 is present in the midplane of the disk.
So from a comparison of observations with our models we can see that we require N2 to be present in the midplane, but CO to be absent. In the current models the binding energies of these two molecules are similar and therefore they have similar desorption rates. In order to account for the observations we would need (N2) to be somewhat smaller than (CO). The values we use are taken from Öberg et al. (2005) who measured the binding energy of N2 on N2 ice, CO on CO ice and the binding energies of both molecules on a mixture of CO and N2 ices. However, in the interstellar medium and protostellar disks the main component of the ice mantles is water and it is possible that the binding energies of N2 and CO to water ice are very different from those measured by Öberg et al. (2005). Various theoretical and experimental work points towards this being the case. For example, Herbst & Cuppen (2006) take (CO) and (N2) to be 1150 K and 1000 K respectively, based on the laboratory work of Collings et al. (2003) and Ayotte et al. (2001). Calculations by Al-Halabi et al. (2004) find (CO) to be 1010 K on amorphous ice and 1215 K on crystalline ice. These values are rather more than the Öberg et al. values. Increasing the binding energies will reduce the efficiency of both thermal desorption and CRH (for which rates are calculated using ). Also increasing the relative value of (CO) compared to (N2) will mean that N2 could be desorbed in regions where CO is retained on the grains. For example, using (CO) = 1200 K and (N2) = 1000 K, we find midplane abundances (N2) = 3.2 10-10 and (CO) = 5.2 10-10 at = 250 AU, compared to 1.4 10-9 and 6.0 10-8 respectively using the Öberg et al. binding energies. In terms of column densities, the higher binding energies have N(N2H+) = 6.2 1010 cm-2 (an increase of a factor of 2.4 over the value in Model C), while N(CO) = 1.4 1017 cm-2 and DCO+/HCO+ = 0.23. Thus with the higher binding energies, N(CO) is still in agreement with the observations and N(N2H+) increases but is still a factor of 500 lower than the observed value in LkCa15. A higher column density could be achieved if N2 is more efficiently desorbed in the midplane.
Even with the increased CO binding energy, DCO+/HCO+ is still much higher than observed, because CRH can still desorb some CO in the midplane. Another possibility is that CO does not desorb by CRH as efficiently as we assume here. Our rates are based on the work of Hasegawa & Herbst (1993), but recent work by Bringa & Johnson (2004) suggests that theses rates maybe an over-estimate for CO and an underestimate for H2O. According to Bringa and Johnson the desorption rate for CO is a factor of 10 lower than estimated by Hasegawa & Herbst (1993) which would reduce the abundance of CO in the midplane considerably. There is no data for N2, but if it is able to desorb at the Hasegawa & Herbst rate, then this would allow there to be a midplane layer of N2 that is also lacking in CO.
On the basis of our modeling we find that efficient non–thermal desorption such as photodesorption must be active in the surface and molecular layers to account for the observed column densities of molecules such as HDO and HCN which would otherwise be expected to be accreted onto the grains. The observed DCO+/HCO+ ratio indicates that CO is not present in the midplane where deuteration is efficient, ruling out desorption of CO in this region that is as efficient as the CRH included here. However, some desorption must be occurring in the midplane to account for observations of N2H+. Overall Model D gives the best agreement with observations, but in order to account for N2H+, N2 must be able to desorb in the midplane.
5 Summary
We have presented results from new models of the deuterium chemistry in disks which include grain mantle chemistry and multiply deuterated molecules, and have considered how desorption processes affect the calculated abundances and the molecular deuteration. Our main findings are as follow:
-
1.
Very high levels of deuteration can be achieved in the midplane, where freezeout removes most molecules from the gas.
- 2.
-
3.
Chemical processing in the disk, including grain surface chemistry, can make great changes to the deuteration of gas phase molecules compared to the input molecular cloud values. This is partly a consequence of processing in the gas and partly due to the formation of molecules on the grains and their subsequent desorption. We find that DCO+/HCO+ is very sensitive to the desorption processes included in the models. From a comparison of observational data for this molecule and the models we find that CO cannot be present in the midplane, suggesting either that the rate of cosmic ray desorption of this molecule is less than assumed in these models, or that its binding energy on water ice is much higher than the value adopted here.
-
4.
From comparison of the model results in the midplane at 50 AU we find that some molecules found in comets have D/H ratios which reflect the input molecular cloud abundances, but that others, notably NH3 have undergone considerable chemical processing in the disk. Based on this it seems that comets could be comprised of some molecules that have their origin in the parent molecular cloud and others that were formed in the disk.
The deuterium chemistry provides a means of testing the models against observations and of distinguishing among the various processes that might be acting in the disk. As observations continue to be acquired and gain in sensitivity and resolution, the ability to use models and observations together to understand the chemistry of protoplanetary disks will be greatly enhanced.
References
- Aikawa & Herbst (1999a) Aikawa, Y., & Herbst, E. 1999a, ApJ, 526, 314
- Aikawa & Herbst (1999b) Aikawa, Y., & Herbst, E. 1999b, A&A, 351, 223
- Aikawa & Herbst (2001) —. 2001, A&A, 371, 1107
- Aikawa et al. (2003) Aikawa, Y., Momose, M., Thi, W.-F., van Zadelhoff, G.-J., Qi, C., Blake, G. A., & van Dishoeck, E. F. 2003, PASJ, 55, 11
- Aikawa et al. (2002) Aikawa, Y., van Zadelhoff, G. J., van Dishoeck, E. F., & Herbst, E. 2002, A&A, 386, 622
- Al-Halabi et al. (2002) Al-Halabi, A., Kleyn, A. W., van Dishoeck, E. F., & Kroes, G. J. 2002, J. Phys. Chem., 106, 6515
- Al-Halabi et al. (2004) Al-Halabi, A., van Dishoeck, E. F., & Kroes, G. 2004, J. Chem. Phys., 120, 3358
- Allen & Robinson (1977) Allen, M., & Robinson, G. W. 1977, ApJ, 212, 396
- Ayotte et al. (2001) Ayotte, P., Smith, R. S., Stevenson, K. P., Dohnálek, Z., Kimmel, G. A., & Kay, B. D. 2001, J. Geophys. Res., 106, 33387
- Bacmann et al. (2003) Bacmann, A., Lefloch, B., Ceccarelli, C., Steinacker, J., Castets, A., & Loinard, L. 2003, ApJ, 585, 55
- Barsuhn (1977) Barsuhn, J. 1977, ApJS, 28, 453
- Beckwith et al. (1990) Beckwith, S., Sargent, A., Chini, R., & Guesten, R. 1990, AJ, 99, 924
- Bergin et al. (2003) Bergin, E., Calvet, N., d’Alessio, P., & Herczeg, G. J. 2003, ApJ, 591, 159
- Bockelee-Morvan et al. (1998) Bockelee-Morvan, D., Gautier, D., Lis, D. C., Young, K., Keene, J., Phillips, T., Owen, T., Crovisier, J., Goldsmith, P. F., Bergin, E. A., Despois, D., & Wootten, A. 1998, Icarus, 133, 147
- Bringa & Johnson (2004) Bringa, E. M., & Johnson, R. E. 2004, ApJ, 603, 159
- Caselli et al. (2002) Caselli, P., Stantcheva, T., Shalabiea, O., Shematovich, V. I., & Herbst, E. 2002, Planet. Space Sci., 50, 1257
- Cazaux & Tielens (2002) Cazaux, S., & Tielens, A. G. G. M. 2002, ApJ, 575, 29
- Cazaux & Tielens (2004) —. 2004, ApJ, 604, 222
- Ceccarelli & Dominik (2005) Ceccarelli, C., & Dominik, C. 2005, A&A, 440, 583
- Ceccarelli et al. (2005) Ceccarelli, C., Dominik, C., Caux, E., Lefloch, B., & Caselli, P. 2005, ApJ, 631, 81
- Ceccarelli et al. (2004) Ceccarelli, C., Dominik, C., Lefloch, B., Caselli, P., & Caux, E. 2004, ApJ, 607, 51
- Chick & Cassen (1997) Chick, K. M., & Cassen, P. 1997, ApJ, 477, 398
- Collings et al. (2003) Collings, M. P., Dever, J. W., Fraser, H. J., McCoustra, M. R. S., & Williams, D. A. 2003, ApJ, 583, 1058
- d’Alessio et al. (2001) d’Alessio, P., Calvet, N., & Harmann, L. 2001, ApJ, 553, 321
- d’Alessio et al. (1999) d’Alessio, P., Calvet, N., Hartmann, L., Lizano, S., & Canto, L. 1999, ApJ, 527, 893
- Dominik et al. (2005) Dominik, C., Ceccarelli, C., Hollenbach, D., & Kaufman, M. 2005, ApJ, 635, L85
- Duncan et al. (1988) Duncan, M., Quinn, T., & Tremaine, S. 1988, ApJ, 328, 69
- Dutrey et al. (1997) Dutrey, A., Guilloteau, S., & Guélin, M. 1997, Astron. Astrophys. Lett., 317, 5
- Eberhardt et al. (1995) Eberhardt, P., Reber, M., Krankowsky, D., & Hodges, R. R. 1995, A&A, 302, 301
- Geppert et al. (2004) Geppert, W. D., Thomas, R., Semaniak, J., Ehlerding, A., Millar, T. J., Österdahl, F., af Ugglas, M., Djurić, N., Paál, A., & Larsson, M. 2004, ApJ, 609, 459
- Guelin et al. (1982) Guelin, M., Langer, W. D., & Wilson, R. W. 1982, A&A, 107, 107
- Guilloteau & Dutrey (1998) Guilloteau, S., & Dutrey, A. 1998, A&A, 369, 467
- Guilloteau et al. (2006) Guilloteau, S., Piétu, V., Dutrey, A., & Guélin, M. 2006, A&A, 448, 5
- Hartmann et al. (1998) Hartmann, L., Calvet, N., Gullbring, E., & d’Alessio, P. 1998, ApJ, 495, 385
- Hasegawa & Herbst (1993) Hasegawa, T. I., & Herbst, E. 1993, MNRAS, 261, 83
- Herbig & Goodrich (1996) Herbig, G. H., & Goodrich, R. W. 1996, ApJ, 309, 294
- Herbst & Cuppen (2006) Herbst, E., & Cuppen, H. M. 2006, Proc. National Academy of Sciences, 103, 12257
- Hornekaer et al. (2003) Hornekaer, L., Baurichter, A., Petrunin, V. V., Field, D., & Luntz, A. C. 2003, Science, 302, 1943
- Howe et al. (1994) Howe, D. A., Millar, T. J., Schilke, P., & Walmsley, C. M. 1994, MNRAS, 267, 59
- Igea & Glassgold (1999) Igea, J., & Glassgold, A. E. 1999, ApJ, 518, 848
- Irvine et al. (2000) Irvine, W. M., Schloerb, F. P., Crovisier, J., Fegley, Jr., B., & Mumma, M. J. 2000, Protostars and Planets IV, 1159
- Kastner et al. (2002) Kastner, J. H., Huenemoerder, D. P., Schulz, N. S., Canizares, C. R., & Weintraub, D. A. 2002, ApJ, 567, 434
- Katz et al. (1999) Katz, N., Furman, I., Biham, O., Pirronello, V., & Vidali, G. 1999, ApJ, 522, 305
- Lee et al. (1996) Lee, H.-H., Herbst, E., Pineau des Forets, G., Roueff, E., & Le Bourlot, J. 1996, A&A, 311, 690
- Leger et al. (1985) Leger, A., Jura, M., & Omont, A. 1985, A&A, 144, 147
- Lis et al. (2002) Lis, D. C., Roueff, E., Gerin, M., Phillips, T. G., Coudert, L. H., van der Tak, F. F. S., & Schilke, P. 2002, ApJ, 571, 55
- Loinard et al. (2001) Loinard, L., Castets, A., Ceccarelli, C., Caux, E., & Tielens, A. G. G. M. 2001, ApJ, 552, 163
- Loinard et al. (2002) Loinard, L., Castets, A., Ceccarelli, C., Lefloch, B., Benayoun, J.-J., Caux, E., Vastel, C., Dartois, E., & Tielens, A. G. G. M. 2002, Planet. Space Sci., 50, 1205
- Lunine et al. (1991) Lunine, J. I., Engel, S., Rizk, B., & Horanyi, M. 1991, Icarus, 94, 333
- Meier et al. (1998a) Meier, R., Owen, T. C., Jewitt, D. C., Matthews, H. E., Senay, M., Biver, N., Bockelee-Morvan, D., Crovisier, J., & Gautier, D. 1998a, Science, 279, 1707
- Meier et al. (1998b) Meier, R., Owen, T. C., Matthews, H. E., Jewitt, D. C., Bockelee-Morvan, D., Biver, N., Crovisier, J., & Gautier, D. 1998b, Science, 279, 842
- Millar et al. (1989) Millar, T. J., Bennett, A., & Herbst, E. 1989, ApJ, 340, 906
- Millar et al. (1998) Millar, T. J., Farquhar, P. R. A., & Willacy, K. 1998, A&AS, 121, 139
- Muzerolle et al. (2000) Muzerolle, J., Calvet, N., Briceno, C., Hartmann, L., & Hollenbrand, L. 2000, ApJ, 535, 47
- Öberg et al. (2005) Öberg, K. I., van Broekhuizen, F., Fraser, H. J., Bisschop, S. E., van Dishoeck, E. F., & Schlemmer, S. 2005, ApJ, 621, L33
- Ohishi et al. (1992) Ohishi, M., Irvine, W. M., & Kaifu, N. 1992, in IAU Symp. 150: Astrochemistry of Cosmic Phenomena, ed. P. D. Singh, 171
- Ohishi & Kaifu (1998) Ohishi, M., & Kaifu, N. 1998, in Chemistry and Physics of Molecules and Grains in Space. Faraday Discussions No. 109, 205
- Parise et al. (2002) Parise, B., Ceccarelli, C., Tielens, A. G. G. M., Herbst, E., Lefloch, B., Caux, E., Castets, A., Mukhopadhyay, I., Pagani, L., & Loinard, L. 2002, A&A, 393, 49
- Perets et al. (2005) Perets, H. B. and. Biham, O., Manicó, G., Pirronello, V., Roser, J., Swords, S., & Vidali, G. 2005, ApJ, 627, 850
- Prasad & Tarafdar (1983) Prasad, S. S., & Tarafdar, S. P. 1983, ApJ, 267, 603
- Pratap et al. (1997) Pratap, P., Dickens, J. E., Snell, R. L., Miralles, M. P., Bergin, E. A., Irvine, W. M., & Schloerb, F. P. 1997, ApJ, 486, 862
- Qi (2001) Qi, C. 2001, PhD thesis, California Institute of Technology
- Qi et al. (2003) Qi, C., Kessler, J. E., Koerner, D. W., Sargent, A. I., & Blake, G. A. 2003, ApJ, 597, 986
- Roberts et al. (2002) Roberts, H., Herbst, E., & Millar, T. J. 2002, MNRAS, 336, 283
- Roberts et al. (2003) —. 2003, ApJ, 591, 41
- Roberts et al. (2004) —. 2004, A&A, 424, 905
- Roberts & Millar (2000) Roberts, H., & Millar, T. J. 2000, A&A, 364, 780
- Rodgers & Millar (1996) Rodgers, S. D., & Millar, T. J. 1996, MNRAS, 280, 1046
- Roueff et al. (2000) Roueff, E., Tiné, S., Coudert, L. H., Pineau des Forêts, G., Falgarone, E., & Gerin, M. 2000, A&A, 354, 63
- Ruffle & Herbst (2000) Ruffle, D. P., & Herbst, E. 2000, MNRAS, 319, 837
- Sandford & Allamandola (1988) Sandford, S. A., & Allamandola, L. J. 1988, Icarus, 76, 201
- Sandford & Allamandola (1990) —. 1990, Icarus, 87, 188
- Sandford & Allamandola (1993) —. 1993, ApJ, 417, 815
- Simon et al. (2000) Simon, M., Dutrey, A., & Guilloteau, S. 2000, ApJ, 545, 1034
- Thi et al. (2001) Thi, W. F., van Dishoeck, E. F., Blake, G. A., van Zadelhoff, G. J., Horn, J., Becklin, E. E., Mannings, V., Sargent, A. I., van den Ancker, M. E., Natta, A., & Kessler, J. 2001, ApJ, 561, 1074
- Thi et al. (2004) Thi, W.-F., van Zadelhoff, G.-J., & van Dishoeck, E. F. 2004, A&A, 425, 955
- Tielens & Allamandola (1987) Tielens, A. G. G. M., & Allamandola, L. J. 1987, in Physical processes in interstellar clouds, ed. G. E. Morfill & M. Schöler (Dordrecht: Reidel), 333
- Tiné et al. (2000) Tiné, S., Roueff, E., Falgarone, E., Gerin, M., & Pineau des Forêts, G. 2000, A&A, 1039
- Turner (2001) Turner, B. E. 2001, ApJS, 136, 579
- Turner et al. (2000) Turner, B. E., Herbst, E., & Terzieva, R. 2000, ApJS, 126, 427
- Umebayashi & Nakano (1980) Umebayashi, T., & Nakano, T. 1980, PASJ, 32, 405
- Umebayashi & Nakano (1981) —. 1981, PASJ, 33, 617
- van der Tak et al. (2002) van der Tak, F. F. S., Schilke, P., Müller, H. S. P., Lis, D. C., Phillips, T. G., Gerin, M., & Roueff, E. 2002, A&A, 388, 53
- van Dishoeck et al. (2003) van Dishoeck, E. F., Thi, W.-F., & van Zadelhoff, G.-J. 2003, A&A, 400, 1
- Westley et al. (1995) Westley, M. S., Baragiola, R. A., Johnson, R. E., & Baratta, G. A. 1995, Nature, 373, 405
- Willacy et al. (2006) Willacy, K., Langer, W., Allen, M., & Bryden, G. 2006, ApJ, 644, 1202
- Willacy & Langer (2000) Willacy, K., & Langer, W. D. 2000, ApJ, 544, 903
- Wilner et al. (2000) Wilner, D. J., Ho, P. T. P., Kastner, J. H., & Rodríguez, L. F. 2000, ApJ, 534, 101
| Species | (K) | Reference | Species | (K) | Reference | |
|---|---|---|---|---|---|---|
| H | 600 | 1 | D | 621 | 2 | |
| H2 | 315 | 8 | C | 800 | 3 | |
| CH | 645 | 9 | CH2 | 956 | 9 | |
| CH3 | 1158 | 9 | CO | 855 | 4 | |
| CO2 | 2860 | 5 | H2CO | 1760 | 3 | |
| CH3OH | 4240 | 7 | O | 800 | 3 | |
| O2 | 1210 | 3 | OH | 1259 | 9 | |
| H2O | 4820 | 6 | N | 800 | 3 | |
| N2 | 790 | 4 | NH | 604 | 9 | |
| NH2 | 856 | 9 | NH3 | 3080 | 5 |
| Element | Abundance |
|---|---|
| H2 | 0.5 |
| He | 0.14 |
| HD | 1.6 10-5 |
| O | 1.76 10-4 |
| C+ | 7.3 10-5 |
| N | 2.14 10-5 |
| Fe | 3.0 10-9 |
| Mg | 7.0 10-9 |
| Molecule | Fractional abundance | TMC–1 | |
|---|---|---|---|
| Gas | Grain | Gas phase | |
| observations | |||
| H | 3.8 (-5) | ||
| D | 7.9 (-7) | ||
| HD | 1.1 (-5) | ||
| H | 3.5 (-9) | ||
| H2D+ | 5.7 (-10) | ||
| HD | 8.3 (-11) | ||
| D | 1.1 (-11) | ||
| CO | 4.2 (-5) | 3.5 (-6) | 8.0 (-5)1 |
| CO2 | 1.7 (-8) | 3.1 (-7) | |
| C3O | 1.0 (-10) | 1.0 (-10)1 | |
| HCO+ | 2.9 (-9) | 8.0 (-9)1 | |
| DCO+ | 2.1 (-10) | 1.6 (-10)2 | |
| H2CO | 5.3 (-8) | 4.0 (-6) | 5.0 (-8)1 |
| HDCO | 2.2 (-9) | 2.8 (-8) | 3.0 (-9)3 |
| D2CO | 5.4 (-11) | 2.7 (-10) | |
| CH3OH | 1.5 (-10) | 3.9 (-8) | 3.0 (-9)1,4 |
| CH3OD | 3.8 (-12) | 1.7 (-10) | 8.0 (-11)3 |
| CH2DOH | 1.1 (-11) | 1.9 (-9) | |
| O | 3.3 (-6) | ||
| O2 | 6.0 (-8) | ||
| OH | 4.5 (-8) | 2.0 (-7)1 | |
| OD | 3.2 (-8) | ||
| H2O | 8.1 (-8) | 1.2 (-4) | |
| HDO | 3.6 (-9) | 2.4 (-6) | |
| D2O | 1.6 (-11) | 1.8 (-8) | |
| N | 4.5 (-7) | ||
| N2 | 2.2 (-6) | 7.3 (-8) | |
| NO | 1.1 (-7) | 3.0 (-8)1 | |
| CN | 2.5 (-8) | 5.0 (-9)4 | |
| HCN | 1.5 (-8) | 4.6 (-6) | 2.0 (-8)1 |
| DCN | 4.9 (-10) | 2.8 (-8) | 2.2 (-10)2,3 |
| HNC | 1.0 (-8) | 7.2 (-7) | 2.0 (-8)1 |
| DNC | 1.2 (-10) | 3.0 (-9) | 3.0 (-10)3,5 |
| C3N | 2.9 (-9) | 6.0 (-10)9 | |
| HC3N | 5.8 (-8) | 3.7 (-7) | 2.0 (-8)4 |
| DC3N | 1.3 (-9) | 8.0 (-9) | 6.0 (-10) – 2.0 (-9)6 |
| CH3CN | 1.0 (-9) | 1.5 (-8) | 6.0 (-10)9 |
| NH3 | 3.4 (-9) | 1.0 (-5) | 2.0 (-8)1,4 |
| NH2D | 4.4 (-11) | 2.4 (-7) | 2.2 (-10)2 |
| NHD2 | 5.6 (-13) | 9.2 (-10) | |
| ND3 | 9.2 (-14) | 1.4 (-11) | |
| N2H+ | 2.8 (-10) | 4.0 (-10)1 | |
| N2D+ | 2.2 (-11) | 3.2 (-11)2 | |
| C | 7.8 (-7) | ||
| C+ | 1.8 (-8) | ||
| CH | 5.2 (-9) | 2.0 (-8)1 | |
| C2H | 1.2 (-9) | 2.0 (-8)7 | |
| C2D | 3.5 (-11) | 2.0 (-10)8 | |
| C3H | 5.9 (-7) | 1.0 (-8)7 | |
| C2H2 | 1.7 (-8) | 1.9 (-6) | |
| CH4 | 2.7 (-7) | 1.4 (-6) | |
| CH3D | 1.7 (-8) | 9.2 (-8) | |
| CH2D2 | 9.3 (-10) | 2.6 (-9) | |
| CHD3 | 3.3 (-11) | 1.8 (-10) | |
| CD4 | 1.2 (-13) | 6.4 (-13) | |
| Molecule | ||||
|---|---|---|---|---|
| Model A | Model B | Model C | Model D | |
| Gas species | ||||
| HD | 5.2 (17) | 2.9 (17) | 2.8 (17) | 5.1 (17) |
| CO | 1.2 (17) | 1.2 (17) | 2.9 (17) | 2.7 (17) |
| H2O | 2.7 (10) | 4.0 (10) | 1.6 (15) | 1.6 (15) |
| HDO | 1.4 (9) | 9.3 (9) | 2.0 (14) | 2.0 (14) |
| D2O | 1.5 (7) | 1.3 (8) | 7.1 (12) | 7.0 (12) |
| CO2 | 9.8 (9) | 1.0 (10) | 1.1 (14) | 1.1 (14) |
| CH4 | 2.9 (14) | 3.3 (14) | 2.9 (14) | 2.5 (14) |
| CH3D | 3.7 (13) | 4.5 (13) | 3.4 (13) | 2.7 (13) |
| CH2D2 | 3.0 (12) | 3.8 (12) | 2.5 (12) | 1.7 (12) |
| CHD3 | 1.1 (11) | 1.8 (11) | 1.1 (11) | 4.6 (10) |
| CD4 | 1.3 (9) | 6.9 (9) | 5.9 (9) | 2.6 (8) |
| HNC | 2.0 (10) | 3.7 (10) | 3.2 (12) | 3.1 (12) |
| DNC | 8.9 (7) | 2.2 (8) | 8.5 (10) | 8.6 (10) |
| HCN | 1.7 (10) | 1.8 (10) | 3.3 (13) | 3.3 (13) |
| DCN | 2.3 (8) | 8.9 (8) | 1.2 (12) | 1.2 (12) |
| CN | 3.7 (11) | 3.8 (11) | 3.6 (13) | 3.6 (13) |
| H2CO | 3.3 (11) | 3.3 (11) | 3.9 (12) | 3.9 (12) |
| HDCO | 6.7 (9) | 7.5 (9) | 8.6 (10) | 8.5 (10) |
| D2CO | 6.0 (8) | 6.5 (8) | 1.2 (9) | 1.2 (9) |
| HC3N | 1.5 (9) | 1.6 (9) | 7.0 (11) | 7.0 (11) |
| DC3N | 4.6 (7) | 4.9 (7) | 2.1 (10) | 2.2 (10) |
| N2 | 3.8 (15) | 3.9 (15) | 2.2 (16) | 2.2 (16) |
| 6.3 (9) | 2.3 (10) | 2.8 (10) | 1.1 (10) | |
| 3.2 (9) | 1.6 (11) | 1.6 (11) | 3.8 (9) | |
| CH3CN | 2.1 (7) | 2.1 (7) | 4.9 (10) | 4.8 (10) |
| CH3OH | 6.4 (5) | 6.5 (5) | 1.5 (11) | 1.5 (11) |
| CH3OD | 7.9 (3) | 1.2 (4) | 1.2 (10) | 1.2 (10) |
| CH2DOH | 3.3 (4) | 3.5 (4) | 1.3 (10) | 1.3 (10) |
| 2.8 (12) | 3.1 (12) | 8.9 (11) | 5.3 (11) | |
| 5.3 (11) | 8.2 (11) | 7.7 (11) | 4.8 (11) | |
| 6.6 (11) | 1.1 (12) | 1.1 (12) | 6.6 (11) | |
| 2.6 (13) | 1.3 (13) | 1.3 (13) | 2.6 (13) | |
| HCO+ | 2.9 (12) | 3.3 (12) | 3.2 (12) | 2.8 (12) |
| DCO+ | 3.4 (11) | 3.0 (12) | 3.2 (12) | 4.8 (11) |
| CH | 9.2 (10) | 9.2 (10) | 1.1 (11) | 1.1 (11) |
| CH2D+ | 1.0 (9) | 1.0 (9) | 4.2 (8) | 4.0 (8) |
| CHD | 4.4 (7) | 4.3 (7) | 1.0 (7) | 9.1 (6) |
| CD | 9.6 (5) | 9.8 (5) | 1.7 (5) | 1.6 (5) |
| C2H | 3.6 (12) | 3.6 (12) | 7.2 (12) | 7.2 (12) |
| C2D | 8.0 (10) | 8.1 (10) | 2.2 (11) | 2.1 (11) |
| NH3 | 2.7 (11) | 2.9 (11) | 1.4 (13) | 1.4 (13) |
| NH2D | 3.5 (9) | 1.9 (10) | 1.3 (12) | 1.2 (12) |
| NHD2 | 2.5 (8) | 1.5 (9) | 2.6 (10) | 2.3 (10) |
| ND3 | 1.6 (8) | 4.9 (8) | 4.2 (9) | 3.2 (9) |
| H | 3.8 (19) | 4.5 (19) | 4.8 (19) | 4.8 (19) |
| D | 6.6 (15) | 6.5 (15) | 1.3 (16) | 1.3 (16) |
| Mantle species | ||||
| CO | 4.1 (18) | 4.0 (18) | 4.0 (18) | 4.1 (18) |
| H2O | 1.2 (19) | 1.2 (19) | 1.2 (19) | 1.2 (19) |
| HDO | 2.7 (17) | 3.2 (17) | 3.3 (17) | 2.8 (17) |
| D2O | 4.0 (15) | 1.9 (16) | 1.9 (16) | 4.1 (15) |
| CH4 | 2.5 (17) | 2.7 (17) | 2.7 (17) | 2.4 (17) |
| CH3D | 2.2 (16) | 5.5 (16) | 5.4 (16) | 2.1 (16) |
| CH2D2 | 1.9 (15) | 1.1 (16) | 1.1 (16) | 1.8 (15) |
| HCN | 4.5 (17) | 4.9 (17) | 4.7 (17) | 4.7 (17) |
| DCN | 9.5 (15) | 8.9 (15) | 8.3 (15) | 8.9 (15) |
| H2CO | 3.9 (17) | 3.9 (17) | 3.8 (17) | 3.7 (17) |
| HDCO | 3.3 (15) | 3.8 (15) | 3.6 (15) | 3.0 (15) |
| D2CO | 4.1 (13) | 4.2 (13) | 3.5 (13) | 3.6 (13) |
| NH3 | 1.0 (18) | 1.0 (18) | 1.0 (18) | 9.6 (17) |
| NH2D | 3.4 (16) | 2.3 (17) | 2.3 (17) | 3.3 (16) |
| NHD2 | 2.1 (15) | 5.2 (16) | 5.2 (16) | 2.0 (15) |
| CH3OH | 4.3 (15) | 4.3 (15) | 3.9 (15) | 3.9 (15) |
| CH2DOH | 3.1 (14) | 3.2 (14) | 2.1 (14) | 2.0 (14) |
| CH3OD | 1.7 (13) | 1.7 (13) | 2.4 (13) | 2.4 (13) |
| N2 | 1.9 (17) | 3.2 (16) | 3.2 (16) | 1.9 (17) |
| Molecule | Cloud | Midplane | N(XH)/N(XD) | ||||
|---|---|---|---|---|---|---|---|
| Models A & D | (Models B & C) | Model A | Model B | Model C | Model D | ||
| Gas Species | |||||||
| H2D+/H | 1.6 (-1) | 9.9 (-1) | 9.5 (-1) | 1.9 (-1) | 2.6 (-1) | 8.7 (-1) | 9.1 (-1) |
| HD/H | 2.4 (-2) | 1.6 | 1.5 | 2.4 (-1) | 3.5 (-1) | 1.2 (-1) | 1.2 (-1) |
| D/H | 3.1 (-3) | 76.9 | 25.1 | 9.3 | 4.1 | 14.6 | 49.1 |
| CH2D+/CH | 8.7 (-2) | 1.1 (-2) | 1.1 (-2) | 3.8 (-3) | 3.6 (-3) | ||
| CHD/CH | 3.7 (-3) | 4.8 (-4) | 4.7 (-4) | 9.1 (-5) | 8.3 (-5) | ||
| CD/CH | 6.8 (-5) | 1.0 (-5) | 1.1 (-5) | 1.5 (-6) | 1.5 (-6) | ||
| DCO+/HCO+ | 7.2 (-2) | 12.1 | 1.2 (-1) | 9.1 (-1) | 1.0 | 1.7 (-1) | |
| DCN/HCN | 3.3 (-2) | 1.4 (-2) | 4.9 (-2) | 3.6 (-2) | 3.6 (-2) | ||
| DNC/HNC | 1.2 (-2) | 4.5 (-3) | 5.9 (-3) | 2.7 (-2) | 2.8 (-2) | ||
| HDCO/H2CO | 4.2 (-2) | 2.0 (-2) | 2.3 (-2) | 2.2 (-2) | 2.2 (-2) | ||
| D2CO/H2CO | 1.0 (-3) | 1.8 (-3) | 2.0 (-3) | 3.1 (-4) | 3.1 (-4) | ||
| NH2D/NH3 | 1.3 (-2) | 1.3 (-2) | 6.6 (-1) | 9.3 (-2) | 8.6 (-2) | ||
| NHD2/NH3 | 1.6 (-4) | 9.3 (-4) | 5.2 (-3) | 1.9 (-3) | 1.6 (-3) | ||
| ND3/NH3 | 2.7 (-5) | 5.9 (-4) | 1.7 (-3) | 3.0 (-4) | 2.3 (-4) | ||
| HDO/H2O | 4.4 (-2) | 5.2 (-2) | 2.3 (-1) | 1.3 (-1) | 1.3 (-1) | ||
| D2O/H2O | 2.0 (-4) | 5.6 (-4) | 3.3 (-3) | 4.4 (-3) | 4.4 (-3) | ||
| CH3D/CH4 | 6.3 (-2) | 1.3 (-1) | 1.4 (-1) | 1.2 (-1) | 1.1 (-1) | ||
| CH2D2/CH4 | 3.4 (-3) | 1.0 (-2) | 1.2 (-2) | 8.6 (-3) | 6.8 (-3) | ||
| CHD3/CH4 | 1.2 (-4) | 3.8 (-4) | 5.5 (-4) | 3.8 (-4) | 1.8 (-4) | ||
| CD4/CH4 | 4.4 (-7) | 4.5 (-6) | 2.1 (-5) | 2.0 (-5) | 1.0 (-6) | ||
| N2D+/N2H+ | 7.9 (-2) | 12.0 | 5.1 (-1) | 7.0 | 5.7 | 3.5 (-1) | |
| CH3OD/CH3OH | 2.5 (-2) | 1.2 (-2) | 1.8 (-2) | 8.0 (-2) | 8.0 (-2) | ||
| CH2DOH/CH3OH | 7.3 (-2) | 5.1 (-2) | 5.4 (-2) | 8.7 (-2) | 8.7 (-2) | ||
| D/H | 2.1 (-2) | 1.5 | 1.0 | 1.7 (-4) | 1.4 (-4) | 2.7 (-4) | 2.7 (-4) |
| Mantle species | |||||||
| HDO/H2O | 2.0 (-2) | 2.1 (-2) | 2.4 (-2) | 2.3 (-2) | 2.7 (-2) | 2.8 (-2) | 2.3 (-2) |
| D2O/H2O | 1.5 (-4) | 1.8 (-4) | 1.3 (-3) | 3.3 (-4) | 1.6 (-3) | 1.6 (-3) | 3.4 (-4) |
| NH2D/NH3 | 2.4 (-2) | 2.4 (-2) | 2.3 (-1) | 3.4 (-2) | 2.3 (-1) | 2.3 (-1) | 3.4 (-2) |
| NHD2/NH3 | 9.2 (-5) | 1.2 (-4) | 5.5 (-2) | 2.1 (-3) | 5.2 (-2) | 5.2 (-2) | 2.1 (-3) |
| CH3D/CH4 | 6.6 (-2) | 6.7 (-2) | 2.1 (-1) | 8.8 (-2) | 2.0 (-1) | 2.0 (-1) | 8.8 (-2) |
| CH2D2/CH4 | 1.9 (-3) | 3.8 (-3) | 4.6 (-2) | 7.6 (-3) | 4.1 (-2) | 4.1 (-2) | 7.5 (-3) |
| DCN/HCN | 6.1 (-3) | 2.0 (-2) | 1.9 (-2) | 2.1 (-2) | 1.8 (-2) | 1.8 (-2) | 1.9 (-2) |
| Molecule | Model B | Model C | Model D | DM Tau1 | LkCa15 | TW Hya3 | |
|---|---|---|---|---|---|---|---|
| Interferometer2 | Single dish3 | ||||||
| CO | 1.2 (17) | 2.9 (17) | 2.7 (17) | 5.7 (16) | 1.7 (18)7 | 1.9 (16) | 3.2 (16) |
| HCN | 1.8 (10) | 3.3 (13) | 3.3 (13) | 2.1 (12) | 2.4 (13) | 1.8 (12) | 8.5 (12)6 |
| HNC | 3.7 (10) | 3.2 (12) | 3.1 (12) | 9.1 (11) | 5.4 (12) | 1.4 (12) | |
| CN | 3.8 (11) | 3.6 (13) | 3.6 (13) | 9.5 - 12 (12) | 9.7 – 25 (13) | 1.5 (13) | 6.6 (13) |
| CH3OH | 6.5 (5) | 1.5 (11) | 1.5 (11) | 7.3 – 18 (14) | 7.1 (13) | 1.1 (13) | |
| H2CO | 3.3 (11) | 3.9 (12) | 3.9 (12) | 7.6 – 19 (11) | 7.2 – 19 (12)4 | 7.1 – 51 (11) | 8.0 (11) |
| HCO+ | 3.3 (12) | 3.2 (12) | 2.8 (12) | 4.6 – 28 (11) | 1.5 (13) | 3.3 (11) | 8.5 (12)6 |
| C2H | 3.6 (12) | 7.2 (12) | 7.2 (12) | 4.2 (13) | |||
| N2H+ | 2.3 (10) | 2.8 (10) | 1.1 (10) | 7.6 (11) | 3.1 (13)7 | 1.4 (12) | 1.0 (13) |
| DCO+ | 3.0 (12) | 3.2 (12) | 4.8 (11) | 2.9 (11) | 3.0 (11)6 | ||
| DCN | 8.9 (8) | 1.2 (12) | 1.2 (12) | 1 (13)8 | 4.0 (10) | ||
| HDO | 9.3 (9) | 2.0 (14) | 2.0 (14) | 1.6 (13) | 2 – 7 (14)8 | ||
| 8.2 (11) | 7.7 (11) | 4.8 (11) | 8.8 (12)5 | 2.0 (14)5 | 1.3 (14) | ||