The Cosmic Evolution Survey (COSMOS): The morphological content and enviromental dependence of the galaxy color-magnitude relation at
Abstract
We study the enviromental dependence and the morphological composition of the galaxy color-magnitude diagram at , using a pilot sub-sample of the COSMOS survey. The sample includes galaxies with and photometric redshift within , covering an area of 270 square-arcmin. Galaxy morphologies are estimated via a non-parametric automatic technique. The vs. color-magnitude diagram shows a clear red-sequence dominated by early-type galaxies and also a remarkably well-defined “blue sequence” described by late-type objects. While the percentage of objects populating the two sequences is a function of environment, following a clear morphology/color-density relation also at this redshift, we establish that their normalization and slope are independent of local density. We identify and study a number of objects with “anomalous” colors, given their morphology, polluting the two sequences. Red late-type galaxies are found to be mostly highly-inclined or edge-on spiral galaxies, for which colors are dominated by internal reddening by dust. In a sample of color-selected red galaxies, these would represent a 33% contamination with respect to truly passive spheroidals. Conversely, the population of blue early-type galaxies is composed by objects of moderate luminosity and mass, concurring to only of the mass in spheroidal galaxies. The majority of them () occupy a position in the - plane not consistent with them being precursors of current epoch elliptical galaxies. Their fraction with respect to the whole galaxy population does not depend on the environment, at variance with the general early-type class. In a color-mass diagram, color sequences are even better defined, with red galaxies covering in general a wider range of masses at nearly constant color, and blue galaxies showing a more pronounced dependence of color on mass. While the red sequence is adequately reproduced by models of passive evolution, the blue sequence is better interpreted as a specific star-formation sequence. The substantial invariance of its slope and normalization with respect to local density suggests that the overall, “secular” star formation is driven more by galaxy mass than by environment.
Subject headings:
large-scale structure: general — clusters of galaxies: general — galaxies: morphology — galaxies: general — galaxies: evolution1. Introduction
It has become clear in recent years that galaxy colors show a bimodal distribution (Strateva et al. 2001, Hogg et al. 2002, Blanton et al. 2003): in a rest-frame color-magnitude diagram galaxies tend to segregate between a “red sequence” (similar to, but less tight than that observed for cluster galaxies) and a “blue cloud”.
The red sequence is mostly composed by spheroidal galaxies, a class of objects of special interest as it includes the most massive galaxies, adding up to represent about half the stellar mass in the Universe (Bell et al. 2004a,b; Baldry et al. 2004, Hogg et al. 2004). This behaviour seems to be already established at fairly high redshifts (Bell et al. 2004a; Giallongo et al. 2005; Cucciati et al. 2006; Franzetti et al. 2006). The SDSS data (Hogg et al. 2004) show that the blue cloud contains mainly late (spiral) morphological types, while the bulk of the red sequence consists of early-type galaxies. Hogg et al. (2004) find also that galaxies with high Sérsic indices (indicating an early-type morphology) dominate the red sequence, almost independently of local density. Balogh et al. (2004), using a color criterion to describe galaxy populations, also find that the colors of the red and the blue populations depend weakly on the environment.
A dependence of galaxy colors on the environment would seem to be a natural expectation of a hierarchical scenario: the most dense regions are also those that collapse first, and therefore those appearing as most evolved at any epoch. If the baryonic component simply follows the evolution of dark matter haloes, high density regions should contain galaxies that are older and redder than the low-density field population. How these properties of the stellar population are inter-laced with the construction of the morphological type and its relation to the environment is not obvious, given the impossibility of semi-analytical models to predict galaxy morphologies, a part from adopting simple recipes. Thus, attempts to explain the observed bi-modality in the rest-frame color-magnitude distribution seem to be succesfull in reproducing the gross color features of the population (Menci et al. 2005; Dekel et al. 2005), but obviously do not tell us much on the specific morphological differentiation.
Investigation of the actual morphological composition of the red sequence at high redshift has been performed so far by Bell et al. (2004b), using the GEMS survey, and by Weiner et al. (2005), using the smaller DEEP-1 survey. Both works consistently show that the red sequence also contains galaxies of type later than Sa for a percentage between 20% and 25%. They do not explore, however, the dependence of the morphological composition of the color sequences on the environment.
The Cosmic Evolution Survey (COSMOS, Scoville et al. 2007a) provides us with an ideal combination of area, high-resolution HST imaging and multi-band information to perform such study. In this paper we present a first pilot study based on a sub-sample of the COSMOS catalogue, with mean redshift . This sample is centered around a large-scale structure discovered by an adaptive-filter search in redshift space (Scoville et al. 2007b). A parallel analysis (Guzzo et al. 2007, Paper I hereafter) investigates in detail the local environment of galaxies in this sample using projected densities and X-ray and weak-lensing measurements. A comparison with the total parent COSMOS sample within the same redshift range shows this subsample to be representative with respect to galaxy color, luminosity and mass. While we are already working on extending our analysis to the whole area using improved spectroscopic and photometric redshifts, the current uncertainties on galaxy distances and consequently on measured local densities have suggested us this first exploratory work in an area where these quantities are better under control (see Paper I).
The paper is organized as follows: in § 2 we give a brief description of the data used here; in § 3 we present the sample selection, we review the techniques used to estimate local densities and we present the tool used to assign morphological types; in § 4 we describe the color-magnitude relation, and its morphological content; in § 5 we analyze in more detail the properties of red late-type and blue early-type populations; in § 6, we introduce the color-mass relation with the aim of understanding the color-magnitude diagram; we discuss these findings in § 7 and summarize paper results in § 8.
We adopt throughout the paper a “concordance” cosmological model, with km s-1 Mpc-1, , . However, when needed, we quote lengths and densities in units of .
2. The Data
The COSMOS Treasury project is centered upon a complete 2-degree survey in the near-infrared () F814W band using the Advanced Camera for Surveys (ACS) on board HST. The field is centered at (J2000) = and (J2000) = (Scoville et al. 2007a, 2007c). The ACS camera, with a field of view of 203 arcsec side, has covered the whole field with a mosaic of 590 tiles, corresponding to one orbit each, split into 4 exposures of 507 seconds dithered in a 4-point box pattern. The final 590 images, obtained with the “Multi-Drizzled” software (Koekemoer et al. 2002) using the latest improved geometric distortion corrections for ACS, are pixels each, with 0.05 arcsec pixels and an absolute astrometric accuracy of better than 0.1 arcsec. More details and a full description of the ACS data processing and products are provided in Koekemoer et al. (2007).
The COSMOS 2-square degree field has been also fully covered by optical ground-based observations (Taniguchi et al. 2007), using Suprime-Cam on the 8.2 m Subaru Telescope on Mauna Kea (Kaifu et al. 2000). The Suprime-Cam panoramic camera consists of CCDs of 2k 4k pixels, with a pixel scale of arcsec pixel-1 (Miyazaki et al. 2002). During two observing runs in January and February 2004, , , , , and band images of the whole COSMOS field were obtained. These data were complemented with further deep imaging in and from CFHT, and in from KPNO/CTIO, UH88 and UKIRT. The -band data are essentially complete to . The detection of the sources has been performed on a combination of the Subaru and CHFT original PSF images. The photometry, on the other hand, has been measured within 3” apertures in PSF omogenized images. In pratice, each image is smoothed to achieve the same of the image with the largest PSF (the -band), and then the photometry is measured in a 3” aperture. This procedure reduces the effects of the PSF variation from band to band and has the advantage that the total correction factors are identical in all bands. The resulting global photometric catalogue contains around 440,000 objects to . More details on the observations, data reduction and assembly of the catalogue are given in Taniguchi et al. (2007) and Capak et al. (2007a).
Photometric redshifts were derived from this catalogue using a Bayesian Photometric Redshift method (BPZ) (Benitez 2000; Mobasher et al. 2007), which uses six basic SED types, together with a loose prior distribution for galaxy magnitudes. The output of the code includes, in addition to the best estimate of the redshift, the 68 and 95% confidence intervals, the galaxy SED type, its absolute magnitude in several bands, and stellar masses. Based on nearly 1200 objects for which spectroscopic observations are available in the COSMOS area (z-COSMOS, Lilly et al. 2007), the difference between spectroscopic and photometric redshifts has a typical rms value (not considering catastrophic failures). The quality of the photometric redshift however does not strongly depend on the SED type. As discussed in detail in Mobasher et al. (2007), we have for early-type (E/S0) galaxies, for spiral galaxies and for starbursts, with a number of catastrophic failures below 2%. These figures are consistent with the restricted statistical sample of spectroscopic redshifts available within the large-scale structure at studied here (Paper I). To improve typical redshift errors, for this analysis we shall restrict the photometric redshift sample to . Stellar masses were estimated from the same SED fits and rely, in particular, on the available K-band photometry. Indeed, at the moderate redshifts of our sample galaxies, the K-band effectively probes the low-mass stellar content dominating the galactic mass budget (while higher-z determinations will need the longer-wavelength Spitzer photometry). More detailed information on the quality of the photometric redshifts and stellar mass estimates can be found in Mobasher et al. (2007).
3. SAMPLE DEFINITION AND DATA ANALYSIS
Scoville et al. (2007b) use an adaptive-smoothing algorithm to search for large-scale structures within the COSMOS field, by exploiting photometric redshift to divide the survey volume in “slices”. This analysis provides evidence – among a number of systems at different redshifts – for a conspicuous overdensity peaking in the redshift interval . The reality of this structure, with a mean redshift , has been spectroscopically confirmed by early redshift measurements of 14 galaxies in this area (Comastri et al., priv. comm.) and, more recently, by the first data from the VIMOS spectroscopic survey of the field (Lilly et al. 2007). The higher-density peaks within these structures are detected both in the XMM X-ray data (Finoguenov et al. 2007) and in the weak-lensing mass-reconstruction map (Massey et al. 2007; see Paper I for comparisons).
We concentrate here (as in Paper I) on a sample of galaxies selected from an area of arcmin2 that roughly encloses the main part of the detected structure. This area is covered by 30 ACS tiles of the overall COSMOS ACS survey.
Following Dressler (1980), galaxy projected densities are estimated as , where is the projected comoving distance (in h-1 Mpc) to the nearest galaxy, and then corrected for background contamination. The robustness of our local density estimates has been extensively tested using simulations (Paper I, Appendix). In particular, we have applied our technique to a mock catalog generated from the Millennium simulation (Kitzbichler & White 2006), and we have showed that projected densities correlate well with real 3-d ones above . Capak et al. (2007), using a different technique, find similar results. As thoroughly discussed in Paper I, we find that our estimate is fairly robust with respect to varying the redshift slice thickness, and on this basis adopt as standard for our analysis the redshift interval corresponding roughly to around the structure mean redshift. The sample includes 2041 galaxies to .
3.1. Morphological classification
The size of the COSMOS sample naturally suggests the use of an automatic and objective morphological classification technique. Our aim in this paper is to separate galaxies into early-types (including ellipticals and S0) and late types (spirals of any B/D, irregulars and mergers). We have therefore based our morphological estimates on non-parametric measurements of the galaxy light distribution, extending the work of Cassata et al. (2005). We have made use of a parameter set including Concentration , Asymmetry , Clumpiness , Gini index and Moment (Conselice 2003, Abraham et al. 2003, Lotz et al. 2004). We estimated these parameters for all galaxies in the 30 ACS/HST images covering the structure. At this redshift, the observed F814W band approximately corresponds to rest-frame band. The thickness of our redshift slice is small enough to ensure that morphological K-correction and cosmological dimming effects can be neglected inside it. Most of the results discussed here are based on internal comparisons (e.g. for different density regimes); when reference to local (e.g. SDSS) morphological types is made, these effects are in general small for our two simple classes of early- and late-type galaxies (see Brinchmann et al. 1998) and in any case well within the differences in morphological definitions among different authors.
The technique used is directly derived from Cassata et al. (2005), to which we refer for all technical details about the methods for measuring Concentration, Asymmetry and Clumpiness. In this paper we have added two further estimators, namely the Gini index and M20 parameter.
The Gini coefficient is a concentration parameter, measuring how fairly the light is distribuited among the galaxy pixels. In pratice, it is high when the light is concentrated in a small number of pixels, wherever they are located inside the galaxy. On the contrary, it is low when the galaxy light is spread over a large number of pixels. M20 is the moment of the brightest of galaxy flux: it is another concentration parameter, that however is more sensitive than Concentration to any off-axis light clump. Thus, it correlates with Concentration for normal galaxies, and is expected to diverge from that for non-symmetric objects with clumps of light far from the center. Parameters are defined and measured as in Lotz et al. (2004). The only difference is in the segmentation technique used to assign image pixels to galaxies. In this work, we select an area around each galaxy 4 times larger than the isphotal area measured by SExtractor, centered on the galaxy centroid, and then consider only pixels brighter than 1.5 times the rms of the background. In fact, given that we are dealing here with galaxies almost at the same redshift, we do not need to use Petrosian apertures, that have the advantage of including the same part of galaxy image independently of redshift, minimizing surface brightness dimming effects. This latter approach is being applied in the extension of our work to the whole COSMOS area and to different redshifts, which is in preparation.
Stars were removed from the sample using SExtractor (Bertin & Arnouts 1996), according to their CLASS-STAR and FLUX-BEST parameters measured on the ACS data, for which this method proves to be reliable (much more than on ground-based images).
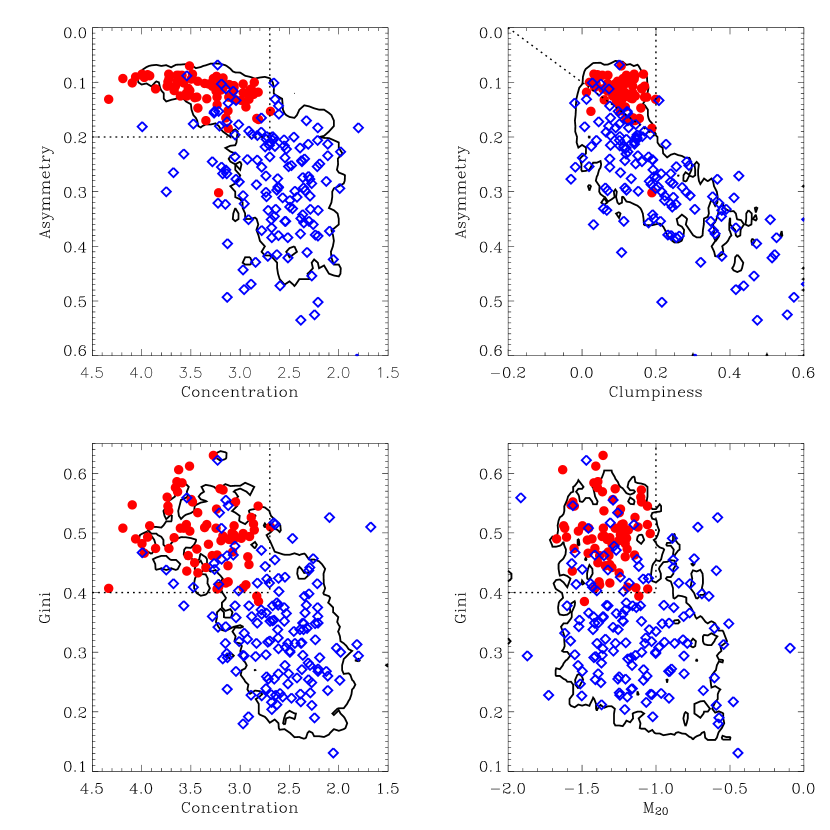
As shown by Cassata et al. (2005), there is a precise locus in the CAS parameter space where early-type galaxies typically fall. To re-define this region for the COSMOS ACS data, adding the new two parameters, we used a control sample of 211 galaxies, extracted from two ACS/HST tiles including the core of the main structure, for which we performed a visual classification into early-types (ellipticals and S0) and late-types (spirals, irregulars and mergers). In Figure 1 we show the distribution of these galaxies in the space defined by Concentration, Asymmetry, Clumpiness, Gini and M20 parameters. Using the following empirical selection rules:
| (1) | |||
we are able to recover 92% of the galaxies visually classified as early-types in the control sample, with a contamination of only 6% from the late-type class (mainly bulge dominated spirals). The contours in the different panels of Fig. 1 describe the areas where 90% of the total galaxy sample lies, showing how the control sample is a representative random selection of the parent population. We therefore adopt Eq. 3.1 to classify early-type galaxies in the full sample, ending up with 1614 late-type and 427 early-type objects.
4. The color-magnitude relation at
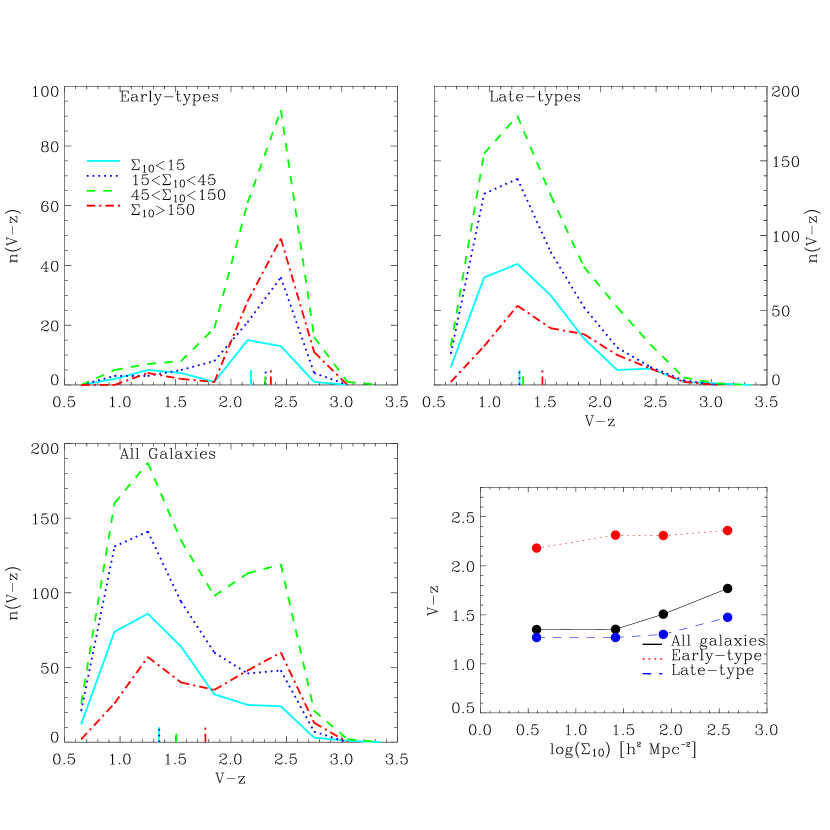
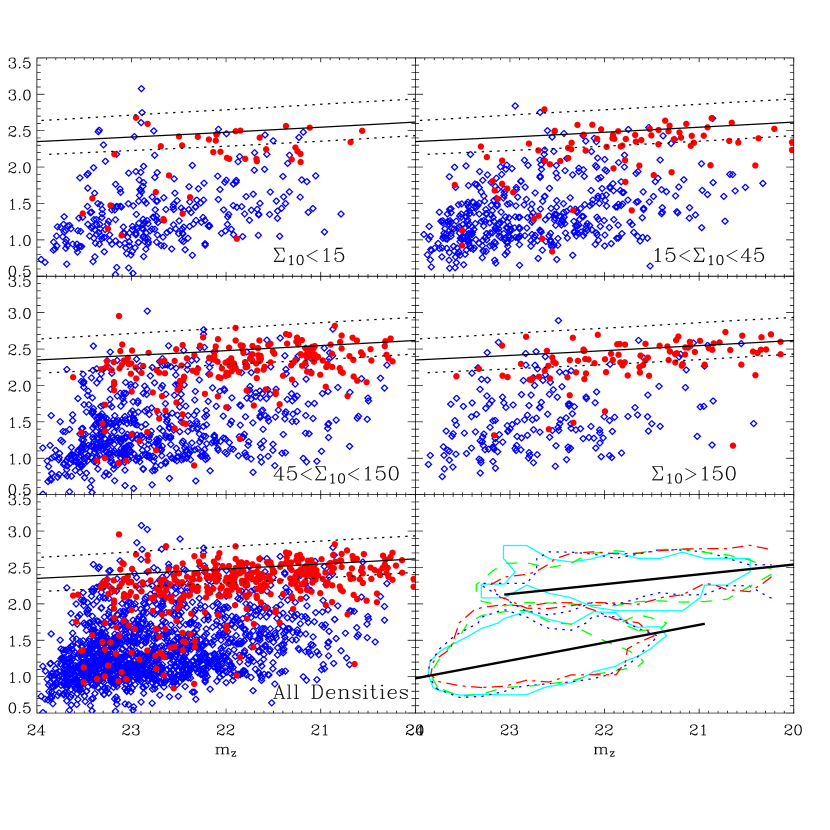
Figure 2 plots the observed color versus band magnitude for early- and late-type galaxies in our sample, for different intervals of local density . Although we are working with observed colors, the limited redshift range covered () makes this plot grossly equivalent to a rest-frame diagram. Using observed rather than rest-frame K-corrected colors reduces the impact of redshift errors and avoids further uncertainties that are introduced by the SED fitting procedure (see Franzetti et al. 2006). The choice of the colour, among the several available, optimally brackets the 4000 Å break at , maximizing the color contrast of red galaxies.
Even if some contamination by foreground and background objects not belonging to our redshift slice is certainly present, because of the uncertainties in photometric redshifts (see Paper I for detailed discussion), the bimodal nature of the color distribution for the whole population is evident. The morphological information contribuites to separate the two sequences more clearly: a quite well defined red sequence, composed in large majority by early-type galaxies and with a small color scatter; and a bluer, somewhat more dispersed one, dominated by late-type morphologies. The blue sequence has a larger scatter and a slightly steeper slope than that of the red sequence. However, in comparison to other analyses based on rest-frame colors (e.g. Bell et al. 2004a, Tanaka et al. 2005, Franzetti et al. 2006) it is remarkably well-defined.
Also, as shown by the contour plots in the right bottom panel of Figure 2, the two sequences keep their identity independent of density. Bi-dimensional Gaussian fits to the two sequences show the following dependences of the average colors on magnitude:
| (2) |
for the red and
| (3) |
for the blue sequence. We have verified that these fits do not depend on the magnitude limit chosen (), by building a similar plot for all galaxies brighter than , and, within , recovering the same best-fit values of eqs. 2 and 3.
Although being dominated by spheroidal and late-type galaxies, respectively, both red and blue sequences include a mixture of morphological types. We will discuss extensively in § 5 the origin of these two classes.
The solid lines in the Color Magnitude (CM) diagrams of Figure 2 show the locus for the red sequence predicted by the model of Kodama & Arimoto (1997), for a population of early-type galaxies formed at and observed at . In this model galaxies are coeval and described by a single burst of star formation, after which they evolve passively. The inclination of the red sequence is produced in this scenario by a metallicity gradient (see § 7 for more details). One notes that while the slope of the data is reproduced fairly well, the model corresponding to the structure mean redshift seems to be systematically redder by about 0.1 magnitudes. We also plot (dotted lines) the red sequences corresponding to our assumed upper and lower redshift boundaries, and . The scatter is comparable to the region enclosed between the two extreme model sequences.
The effect of the environment on the the color distribution of the galaxies in this sample is summarized in the histograms of Figure 3, corresponding to the ordinate-axis marginal distributions of the 2D plots of Figure 2 (see also Kodama et al. 2001 and Tanaka et al. 2005, for similar analyses around clusters at different redshifts). The upper panels show the color distributions for the two morphological classes separately, the bottom-left one for the total sample. The vertical long tick-marks on the x-axis with different line styles give the median values for the corresponding distributions. The color distribution of the global sample (bottom-left panel) is bimodal in all environments, although the distribution of galaxies between the two main sequences does clearly depend on local density, with the red sequence being less evident in the lowest density bin, as already noticed in the color-magnitude diagram. When looking at the color distribution of early-types only, an interesting excess of blue galaxies, independently of the environment, can be noted. At the same time, the color distribution of late-types show a tail of galaxies with 2. For the rest, the histograms confirm that the color distributions of spheroidal galaxies, as well as that of late-types, are only weakly dependent on the environment: the shape of the histograms for the two classes separately are not sensitive to local density, with median values rather close to each other, and only a slight tendency for having redder colors at the highest projected densities. This is summarized in the bottom right panel of Figure 3, that reports the median color as a function of local density for the whole population and for the early- and late-types separately. When considered as a whole, galaxies display a clear direct dependence of the median color on local density, in agreement with the color-density relation recently observed also at these redshifts by Cucciati et al. (2006) and Cooper et al. (2006a). Our analysis specifically shows how this relation behaves for morphologically homogeneous classes. In fact, the median colors of early- and late-type galaxies separately do not seem to depend strongly on local density. We conclude that the bulk of the observed color-density relation is a by-product of the varying fraction of the two basic morphological types with environment: the median color for each class alone shows a mild dependence on local density, but when they are combined, the median color is dominated by blue spirals/irregulars at low densities and by red ellipticals/S0s at high densities, thus producing the observed overall effect.
5. The morphological mix of the red and blue sequences at
The objects in the color-magnitude plot of Figs. 2 with “anomalous” colors and morphologies, either “blue early-types” or “red late-types”, bear a potential for understanding the relationship of the two galaxy categories and whether they might evolve into each other. Moreover, it is important to quantify the number of late-type populating the red sequence. When in fact a morphological analysis is unavailable, due to the lack of high resolution imaging, it is common to use a simple color criterion to segregate passive early-type galaxies from star-forming late-type galaxies (e.g. Bell et al. 2004a).
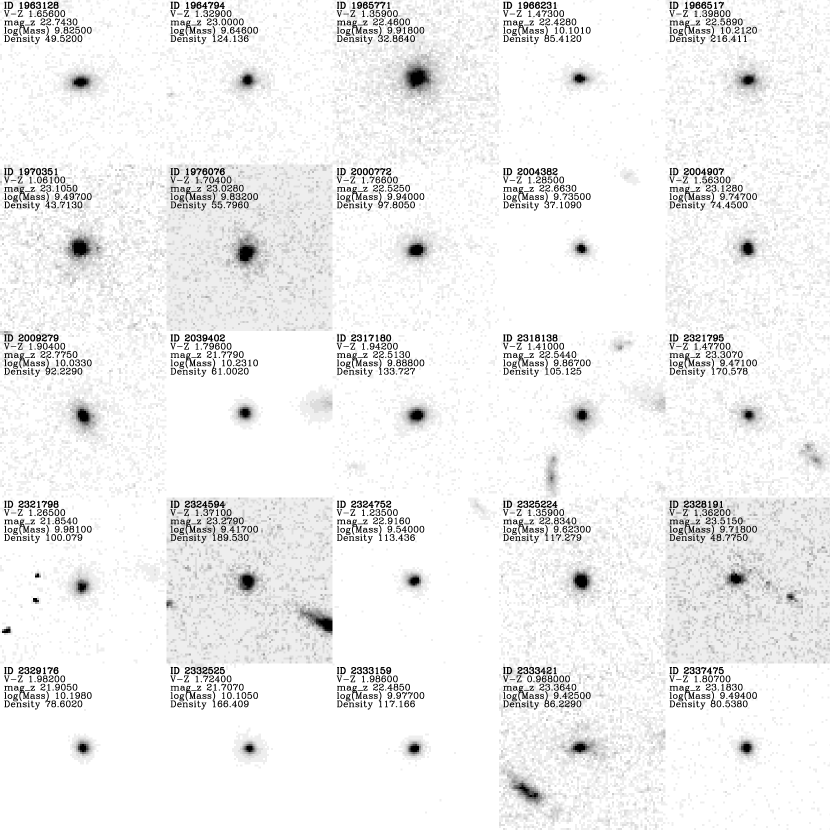
We have 78 early- and 184 late-type objects with anomalous colors in our sample. The nature of these galaxies is unveiled in Figure 4 and Figure 5, where we have collected postage-stamp ACS images for 25 early-type-classified galaxies with “blue” colors () and 25 late-type galaxies with “red” colors (), randomly drawn from the total population in each class. For each galaxy, we report the values of the mass, color and local projected density . The first encouraging result from these figures is that the large majority of the displayed cases are not failures of our automatic morphological classification. In fact, in Figure 4 all objects are morphologically dominated by an evident spheroid, while in Figure 5 the prevalent morphology is disk-dominated or irregular.
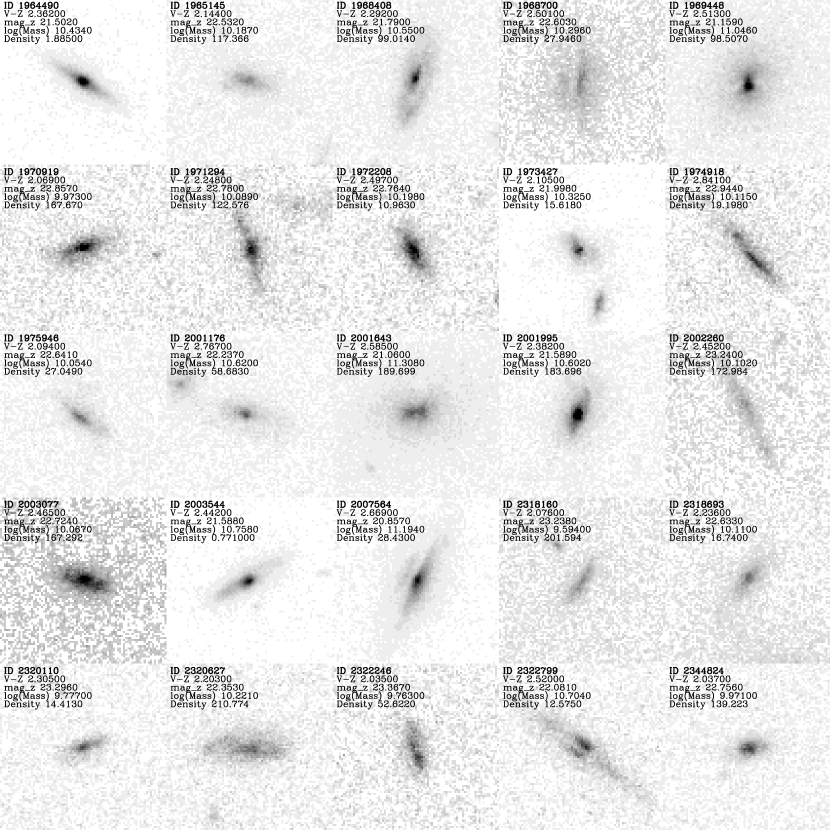
5.1. The red late-type population

As evident from Figure 5, virtually all the red late-type objects are edge-on or very inclined spirals, showing red colors because of strong internal reddening due to their geometrical orientation. Weiner et al. (2005), studying the relation between colors and morphologies for galaxies observed in the DEEP1 survey, also find a significant number of late-type galaxies showing red rest-frame colors. They claim in particular that only 75% of red galaxies are ellipticals or bulge dominated galaxies. Similarly, Bell et al. (2004b), using the GEMS survey, find that at 80% of the -band luminosity density in red galaxies is contributed by ellipticals or bulge-dominated galaxies. Franzetti et al. (2006), via spectroscopic measurements, claim that 35% of the red galaxies in the VVDS survey show emission lines due to star formation (with a very small contamination by AGN). As in our case, the majority of those galaxies in DEEP1 and GEMS are edge-on spirals, in which galaxy colors are reddened by dust absorption, or bulge-dominated spirals.
To quantify the excess of highly inclined disks observed in Fig. 5, and to verify the hypothesis that a particular geometrical orientation of spiral galaxies can explain their extreme red colors, we studied the distribution of the ellipticities for late-type galaxies as a function of their color. The axial ratio is related to the galaxy disk inclination (the angle between the perpendicular to the plane of the disk and the plane of the sky) by the Holmberg formula:
| (4) |
where is the intrinsic ratio between the height and the radius of the disk (a typical value for is 0.2, Tully & Pierce 2000). In Fig. 6 we compare the distribution of ellipticities that we have measured for late-type galaxies lying in the blue and red sequences. The dotted line, in particular, shows the ellipticity for blue late-type galaxies: the excess of intermediate ellipticity values () is very probably due to the large number of irregular/merging objects, that are mixed to spiral galaxies in the late-type class. For red galaxies, instead, the distribution is significantly skewed towards higher ellipticity values, peaking at . A Kolmogorov-Smirnov test shows that the probability that the two ellipticity distributions are drawn from the same intrinsic population is less than . This confirms that the inclination of the disk is the dominant effect in determining the measured color for late-types that are observed well redward of the blue sequence.
Consequently, a simple color criterion to identify passive elliptical galaxies will always suffer of a certain degree of contamination. Based on our 184 “red spirals” out of 533 galaxies, this contamination amounts to 33%. These red late-type galaxies contribute to 20% of the luminosity density on the red sequence, a figure that confirms the result by Bell et al. (2004b), Weiner et al. (2005) and Franzetti et al. (2006). Remarkably, our percentage of red galaxies with an early-type morphology is comparable to that measured in the local Universe for SDSS galaxies (58%, see Renzini 2006). Also, a parallel study of the evolution of the global early-type population in the COSMOS field (Scarlata et al. 2007) is in very good agreement with our estimate at , showing also a similar fraction between and . Taking into account the differences in the selection criteria, these results indicate that the fraction of red galaxies with a relaxed morphology remains substantially unchanged between and the current epoch.
5.2. The blue early-type population
Whereas the red late-type galaxy population is clearly the result of a geometrical effect, the colors of the bonafide blue early-types could be indicative of recent or ongoing star-formation activity, placing them outside of the red sequence. These are interesting objects, as they may represent a transition stage, in the process of migrating onto the red sequence.
Evidence for blue colors or star-formation signatures in the spectra of early-type galaxies has been reported by various studies in the past (Schade et al. 1999; Im et al. 2001; Menanteau, Abraham & Ellis 2001; Menanteau et al. 2004; Cross et al. 2004; Cassata et al. 2005; Treu et al. 2005a; Ilbert et al. 2006). Schade et al. (1999), in their study of CFRS galaxies find a percentage of about 30% of morphologically- selected spheroidals that exhibit [OII] emission. Cassata et al. (2005), studying the morphological properties of the sample (Cimatti et al. 2002), recognize a class of ”peculiar ellipticals”, i.e. spheroidal galaxies with some distortion of the isophotes or with signs of a recent interaction. The majority of these galaxies show evidence for recent star formation in their spectra. The morphologies of the blue early-type galaxies found here are quite compatible with these properties. A direct check of their spectroscopic properties will soon become possible thanks to the ongoing z-COSMOS redshift survey at the VLT (Lilly et al. 2007).
In our sample, we have 78 blue objects among the 427 spheroidals (18%). This percentage is lower than that measured at similar redshifts by various authors (Im et al. 2001, Cross et al. 2004, Ilbert et al. 2001), who indicate fractions around 30%. This is not surprising, as our sample is centred on a large-scale structure that is clearly over-abundant in high-density regions, including the very massive X-ray/lensing cluster (Guzzo et al. 2007), making it possibly richer in early-type objects than an average volume at the same redshift. The blue early-types concur to 5% of the mass in ellipticals and to less than 3% of the total mass in galaxies. This means that if these will eventually migrate to the red sequence, they are not able to increase significantly its mass content.
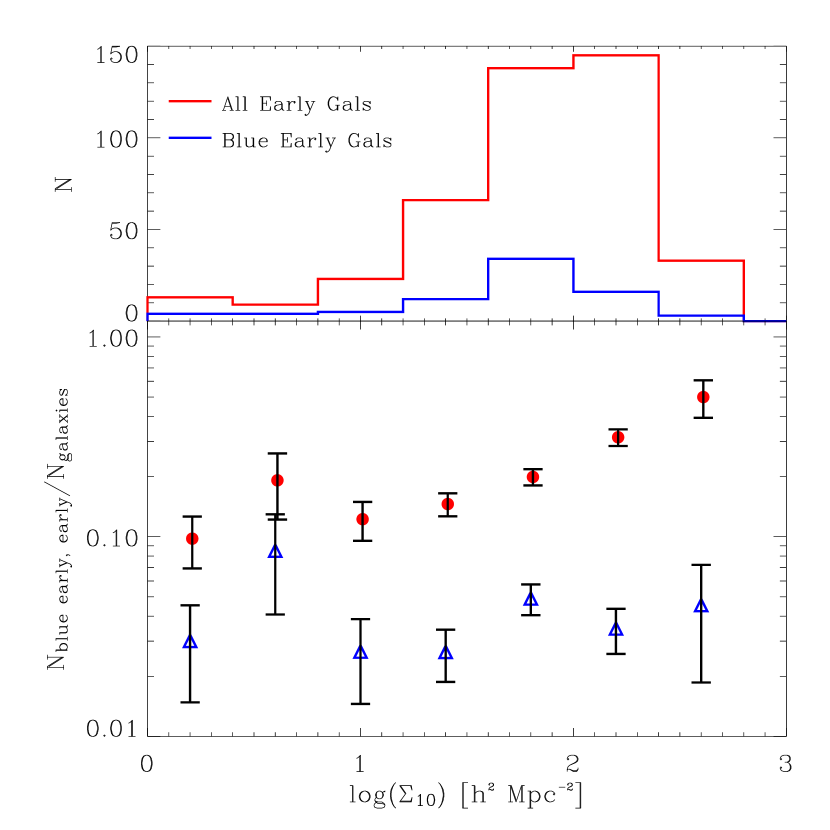
Figure 7 investigates a possible relation between the blue early-type population and the environment. Specifically, we plot the fraction of objects as a function of local density separately for all early-type galaxies and for those with blue colours only. While the fraction of all early-types rises with local density, (see Paper I for a full discussion of the morphology-density relation at this redshift) the percentage of blue spheroidals remains constant as a function of the environment, about . A Kolmogorov-Smirnov test confirms that the two distributions are statistically distinct, as the probability that they are drawn from the same original population is less than .
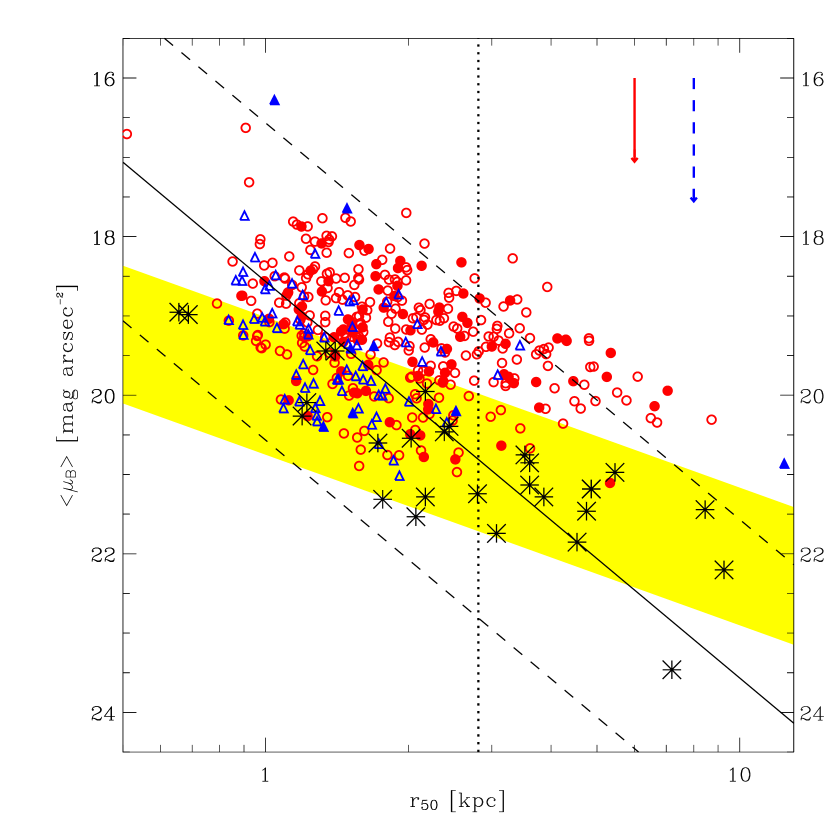
Could these objects be precursors of some of today’s red early-type galaxies? Ferreras et al. (2005) suggest that a robust criterion to isolate the progenitors of early-type galaxies at different redshifts should exclude those objects that, even though showing a clear elliptical morphology, will not plausibly evolve into the local Kormendy Relation at the current epoch (see also Scarlata et al. 2007). The Kormendy Relation relates the effective radius (the radius, in physical units, containing half of the total light) with , the mean surface brightness within (in arcsec). In this plane, local bright elliptical galaxies show a relatively tight scaling relation, for sizes between 1 and 100 Kpc (Kormendy 1977). This is nothing else than a projection of the well-known fundamental plane of elliptical galaxies, connecting these two quantities to the galaxy velocity dispersion. Capaccioli et al. (1992) show that more in general galaxies form 2 distinct families in the vs plane: while luminous ellipticals follow the classical Kormendy relation, some S0s, spiral bulges and dwarf ellipticals populate a narrow nearly vertical strip with sizes typically smaller than Kpc and a wide range of surface brightnesses.
We have therefore computed the surface brightness in the rest-frame band, , and the corresponding from the ACS/F814W band, for the early-type galaxies in our sample. The result is plotted in Fig. 8. To obtain the plotted quantities, one has to take into account that due to the cosmological dimming the observed surface brightness is related to the rest-frame intrinsic surface brightness as
| (5) | |||
| (6) |
where is the rest-frame surface brightness, reproduces the redshifting of the bandwidth, the ratio between and accounts for the difference in flux between the observed and emitted bands, and is the -correction. For the redshift range we are exploring (), the observed band well matches the rest-frame band. Hence, to first approximation, , and the -correction reduces to , without any evolutionary correction. The main uncertanties on the measured quantities are due to the scatter in the photometric redshifts, that affect the determination of distances and the surface brightness dimming correction. We estimate a typical error of less than 10% on , and 0.2 mags on . For comparison, we also plot in Fig. 8 the points corresponding to early-type galaxies in the Coma Cluster (Jorgensen et al. 1995), together with the corridor around the best fit (grey/yellow band).
We can notice that, in our sample, blue early-type galaxies have typically Kpc, while early-type galaxies larger than this size have normally red colors. Also, for a fixed blue galaxies have fainter than red ones. On the contrary, the most luminous red galaxies follow a flatter relation, virtually parallel to the Kormendy relation, with sizes in the range 3 Kpc Kpc. Thus, blue elliptical galaxies seem to form a different population with respect to the most luminous red ones.
Simple evolutionary considerations can be used to establish which of the blue and red galaxies can evolve onto the local Kormendy Relation, and can thus be considered progenitors of nowadays spheroidals. Purely passive evolution models (Bruzual & Charlot 2003) with an initial burst of 1 Gyr and a Salpeter IMF, predict a dimming of 0.7-1 magnitudes between and , for a redshift of formation between 2 and 5. If this is the case, the majority of our red early-type objects will move onto the yellow/grey strip indicating the local relation for Coma elliptical galaxies. It seems thus reasonable to conclude that the large majority of our red early-type galaxies could well be progenitors of local ellipticals, in terms of their surface-brightness/radius properties. We should also consider that the Kormendy relation shown in Fig. 8 strictly holds for early-type galaxies in high density environments, being based on Coma-cluster galaxies. In our sample, instead, only elliptical galaxies among 427 live in high density regions (). These galaxies are plotted as filled circles in Fig. 8, showing that they do not seem to differ from the overall population of red early-types in this diagram.
A fading of 0.7 to 1 magnitude is actually a lower limit to the luminosity decrease of any galaxy between to (see also Gebhardt et al. 2003, Van Dokkum & Stanford 2003, Treu et al. 2005b). Blue objects will in general fade by an even larger amount. A reasonable estimate can be obtained by a model which continuously forms stars at a constant rate from the redshift of formation, down to the redshift of observation ( in our case); at that point star formation is switched off. Implementing this recipe using the Bruzual & Charlot (2003) code and considering formation redshifts between 2 and 5, we obtain an expected fading of 2.5 magnitudes between z=0.73 and today. The decay in magnitude will be even larger than this if these galaxies are experiencing a short-lived star-burst triggered for example by an interaction/merger.
Even conceiving a fading as small as 1.5 magnitudes for our blue sample (which is unrealistic if these galaxies are starbursting), then, just the 26 objects lying above the yellow/grey region (i.e. of the total sample of blue spheroidals), would end up onto the local Kormendy relation. More in general, those with surface brightness fainter than 19.5 mag arcsec-2 should eventually move below the local relation, occupying the region with Kpc where Capaccioli et al. (1992) find mainly bulges of spirals, S0 galaxies and dwarf spheroidals. Could our blue spheroidals be a mixture of these three classes?
One one side, looking carefully at the morphologies shown in Fig. 4 (and to the other galaxies in the same sub-sample), we see that only about 10% of the objects show signs for a faint disk component. We cannot exclude that, additionally, some very low-surface brightness disks are in fact below the SB limit of the ACS data. However, previous studies based on deeper, multi-band HST imaging (as GOODS, Cassata et al. 2004) do not find evidence for a general population of low-surface brightness disks around similar objects. Also, resolved color analysis of similar objects shows evidence of blue cores rather than blue disks (Menanteau et al. 2004). At the same time it seems also difficult to think of these objects as precursors of S0’s, for the very simple reason that we do not detect any correlation with density of their relative fraction, that is instead observed locally for S0 (e.g. Dressler 1980). Finally, if the fading is comparable to that computed from our simplified star-forming model (i.e. of the order of 2.5 magnitudes), we see that only a fraction of these objects might become as faint as to be classified as dwarf ellipticals. Considering a blue elliptical in our sample with =20 and =1.5 kpc, this implies a total magnitude =21.4 and thus an absolute magnitude . Assuming as a definition of a dwarf ellipticals a magnitude limit -18, we see that a fading of more than 3.5 magnitudes would be required. This is not implausible, but would require that our blue spheroidals are typically experimenting a strong burst of star formation.
6. Understanding the CM diagram: the color-mass relationship
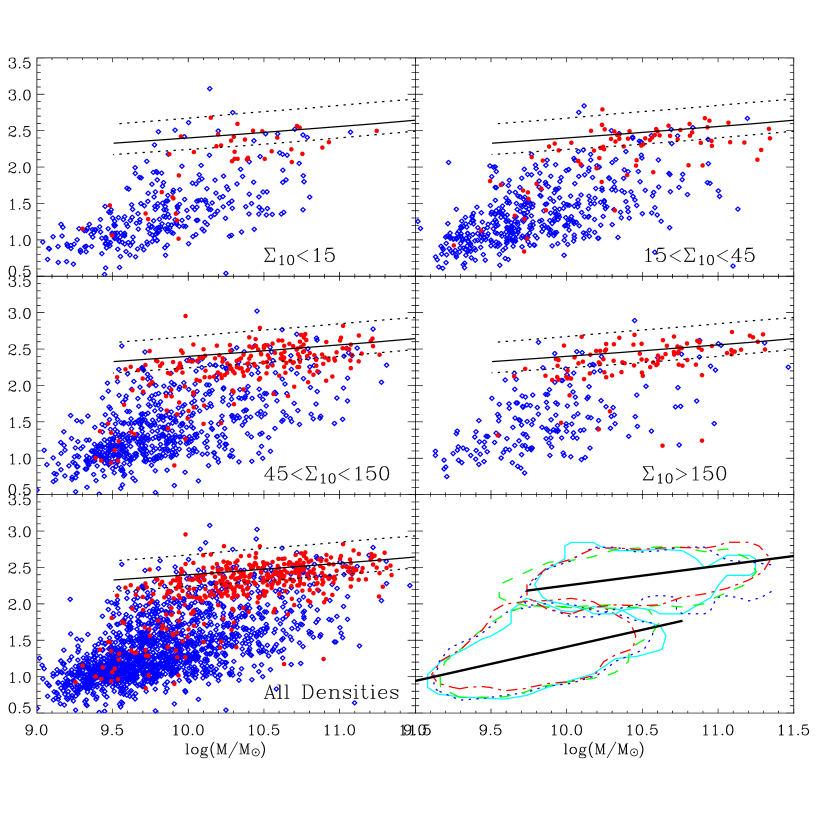
It is interesting to recast the CM diagrams of Figure 2 in terms of stellar mass. This is shown in Figure 9. Also in this case, two well-defined red and blue sequences, respectively dominated by spheroidal and late-type galaxies, are evident. The red sequence is more clearly defined as the projected density increases, whereas in the lowest density bin it is nearly absent, similarly to the CM plot. With this noted exception, in all other density regimes the red and blue sequences, again, keep remarkably invariant. The bottom-right panel summarizes these results by plotting the density contour plots in the Color-Mass plane for the red early-type and blue late-type galaxies (that is galaxies that satisfy both morphological and color criteria) in various density regimes. The remarkable consistency of the contours confirms the substantial indipendence of the color-mass relation within each morphological class on the environment. The thick continuous lines correspond to the average dependences of red and blue galaxies found with a 2D gaussian fitting. While the slopes of the two sequences in the CM diagrams of Figure 2 were fairly similar (just slightly steeper in eq. 3 than in eq. 2), in the current plots the blue sequence is steeper than the red one:
| (7) |
| (8) |
We have tested (as for Eq. 2 and 3) that these fits do not change by including galaxies with .
7. DISCUSSION
In this paper we have detailed the morphological composition of the blue and red parts of the CM diagram at as a function of the environment, extending previous results from combined HST - ground-based surveys (Bell et al. 2004b, Weiner et al. 2005). Our results show at the substantial invariance of the main features in this diagram of galaxies with respect to local density, similarly to what was found by Hogg et al. (2004) at . The properties of the red sequence at moderate/high redshifts have so far been so far studied in particular in clusters (see e.g. Gladders et al. 1998, Kodama et al. 2001, Blakeslee et al. 2003, Yee et al. 2005, Tanaka et al. 2005), or using rest-frame colors, for large comprehensive galaxy surveys (as SDSS, e.g. Hogg et al. 2004, Combo-17, Bell et al. 2004a, DEEP-2, Cooper et al. 2006a,b and VVDS, Cucciati et al. 2006 and Franzetti et al. 2006). On the other hand, the evidence for a “blue sequence” when considering galaxy colors at a fixed redshift emerges here more clearly than in previous works. As it is evident from Figure 2, the separation in morphological classes helps to better separate the two color populations. These patterns become only slightly more confused confused when other colors, not bracketing the 4000 break, are used instead of the . This suggests that they are not simply the result of a population-dependent Balmer jump, but derive from more general properties of the UV-optical spectrum.
We have shown in Fig. 6 that a significant fraction of highly inclined spiral galaxies are observed to have red colors only because of internal extinction. Correcting for this would clearly have the effect to move them down in the CM diagram. When photometrically estimated stellar masses are plotted instead of galaxy luminosities (Figure 9), the galaxy distribution patterns keep some similarities, but also show differences, compared to the CM plots. In particular, the two red and blue color sequences show steeper dependences on galaxy mass (eqs. 7 and 8) than on magnitude. Another difference is that, while the slopes of the red and blue sequences in the CM plot appear to be similar (cf. bottom panel of Figure 2) , the blue color-mass sequence is significantly steeper than the red one. Figure 9 shows that galaxies with colors to and masses in the range to are dominated by late-type morphologies, while the locus with colors from to is dominated by spheroidal systems with . These transition scales in mass are comparable to those shown at z0 by Scodeggio et al. (2002) and Kauffmann et al. (2004) and agree with the trend of an evolving star formation quenching mass suggested by Bundy et al. (2006).
The models by Kodama & Arimoto (1997), that we have superimposed on top of our observed red sequence distributions in Figures 2 and 9, have been originally developed to explain the tight red sequence observed in galaxy clusters. In these models, galaxies are co-eval (with formation redshift in our case111We also tested models with , that give, for the same redshift, a slightly redder sequence.) and are described by a classical single burst of star formation and subsequent passive evolution in color and luminosity down to the time of observed galaxy redshift. The slope of the red sequence is explained as a differential metallicity effect: galaxies with smaller mass have more difficulty to retain the metals ejected by supernova explosions, and thus look bluer than their more massive companions with the same age. On the other hand, the blue/late-type sequence shows a significantly steeper dependence of color on mass, and cannot be explained in terms of metallicity, especially at such blue colors. It seems more physically plausible to associate the color of blue galaxies to the timescale of star formation (Searle, Sargent & Bagnuolo 1973, Larson & Tinsley 1978). Thus, the observed blue sequence can be interpreted as a relationship between the actual specific star formation, evidenced by the galaxy color, and its mass. In this picture, the observed steep sequence would indicate a gradual fading of star formation, with bluer hot stars gradually disappearing for late-type galaxies of larger and larger mass. This shows in quite an explicit way, at a fixed epoch, the so-called “downsizing” effect, now observed in several galaxy surveys (e.g. Cowie et al. 1996, Gavazzi et al. 1996, Franceschini et al. 1998, Treu et al. 2005a, Bundy et al. 2006). This picture is reinforced by the observation that the slope of the blue sequence in the color-mass plane does not depend on the value of the local density (Figure 9), indicating that the specific amount of young stars produced per unit mass in late-type galaxies does not depend on the environment and is essentially regulated by internal processes.
What is dependent on the environment is the relative number of early- and late-type galaxies populating the two sequences, i.e. the well-known morphology-density relation, still present at these redshifts (see Paper I and references therein). In this respect, our results agree very well with those recently obtained at the same redshift by the VVDS (Cucciati et al. 2006) and DEEP-2 (Cooper et al. 2006b). The VVDS work, in particular, explcitly claims that the color-magnitude distribution is not universal but strongly depends upon environment, a statement which might seem in apparent contraddiction with the findings of our work. This apparent confusion needs to be clarified. What this sentence and the overall Cucciati et al. work imply, is simply that there exist a color-density relation observed at virtually any redshift (with a tendency to disappear and possibly even invert its trend for , which is the main result of that paper), and thus that the density of points occupying the red and blue parts of the diagram is a function of environment. Again, this is simply the color-density or morphology-density relation that we observe also here. What we mean here by stating that the color sequences do not depend on the environment, is that the location and slope of the two main clouds is independent of the local density, as shown by Fig. 2. This is also implicitly noted by Cucciati et al., that find that the location of the colour gap between the red and blue peaks appears to be roughly constant and insensitive to the environment at all redshifts. In their Fig. 10, in fact, while the blue sequence is too compressed to define a slope, it is very clear that the red sequence position and slope is rather insensitive, at all redshifts, to local density.
8. SUMMARY AND CONCLUSIONS
The main results we have obtained in this paper can be summarized as follows.
-
•
The color-magnitude diagram at for our sub-sample of the COSMOS catalogue shows a clear red sequence compatible to the expectations of the passive models of Kodama & Arimoto (1997). Rather than forming a “blue cloud”, blue galaxies also tend to aggregate along a similar, bluer sequence with increasing average color with luminosity. The distinction and “sharpness” of the two sequences is enhanced by separating galaxies into morphological types, with early (late) types dominating the red (blue) sequence.
-
•
The distribution function of galaxy colors is a function of the environment, as locally measured by Balogh et al. 2004, using SDSS, with a distribution more skewed towards redder colors in in high-density regions. This confirms the positive color-density relation measured at similar redshift by Cucciati et al. (2006) and Cooper et al. (2006a). However, when early- and late-type galaxies are separated, the distributions become nearly independent of the environment.
-
•
We also study in detail the population of “anomalous” galaxies, with contrasting colors and morphologies. “Red late-types” are found to be mostly edge-on spiral galaxies, for which colors are dominated by internal reddening by dust. Their ellipticity distribution in fact is dominated by a peak around . In a simple color-selected sample, these galaxies would represent a 33% contamination over the population of truly red, passive spheroidals. At the same time, red late-type galaxies are less luminous than red early-types, thus contributing only to the 20% of the luminosity density of red galaxies (similarly to Bell et al. 2004b).
-
•
We also identified an interesting population of “blue spheroidals”, that show a flat Morphology Density relation, at variance with that of red early-types. They are also found to have smaller physical half light radii and fainter surface brightnesses, and contribute to less than 3% of the total galaxy mass content. Simple considerations about the evolution of their stellar populations lead us to conclude that at least 70% of them will not evolve into the Kormendy relation for bright ellipticals, but will occupy a region in the plane where nowadays we find S0 galaxies, spiral bulges and dwarf ellipticals. None of these three classes seems to be an obvious candidate for the descendents of our blue spheroidals.
-
•
In a color-mass diagram color sequences are even better defined, with red galaxies covering in general a wider range of masses at nearly constant color, and blue galaxies showing a more pronounced dependence of color on mass. We interpret the blue sequence as a specific star formation sequence, thus with the less massive late-type galaxies showing a younger average age of their stellar population. Notably, the slope of this sequence has no dependence on the environment, indicating that the specific amount of young stars produced per unit mass does not depend on local density, but seems to be regulated more by the total galaxy mass itself. What the environment does, is to regulate the relative number of galaxies between the red and blue sequences, which at this redshift we still find (once cleaned of spurious effects as internal extinction due to inclination in spirals), is nearly synonimous of being morphologically an early-type or late-type galaxy, respectively. This could be obtained via ab initio processes (e.g. by simply forming more massive galaxies, which form stars and become redder faster, in higher-density regions, as it is natural in hierarchical models). Alternatively, rapid bursts of star formation and/or gas depletion could be induced later in the life of the galaxy, as e.g. due to interactions/mergers in groups or ram-pressure stripping during infall of the galaxy into clusters or cluster-cluster mergers (see evidence for this in Paper I). Both classes of mechanisms would seem to be able to rapidly move the galaxy away from the ‘quiet life’ of the blue sequence (where things develop driven simply by the galaxy mass) and place it into the ’passive repository’ of the red sequence. Using the full-fledged COSMOS data set we hope to be able in the near future to be able to disentangle the respective role of these mechanisms, perhaps including also the possibly crucial contribution, not considered here, of switching-on an AGN in the galaxy nucleus.
References
- (1) Abraham, R. G., et al., 2003, ApJ, 588 , 218
- Baldry et al. (2004) Baldry, I K., Glazebrook, K., Brinkmann, J., et al., 2004, ApJ, 600, 681
- Balogh et al. (2004) Balogh, M. L., et al., 2004, ApJ, 615, 101L
- Bell et al. (2004) Bell, E. F., et al., 2004a, ApJ, 608, 752
- Bell et al. (2004) Bell, E. F., et al., 2004b, ApJ, 600, 11L
- (6) Benitez, N., 2000, ApJ, 536, 571
- (7) Bertin, E., & Arnouts, 1996, A&AS, 125, 1882
- Blakeslee et al. (2003) Blakeslee, J. P., et al., ApJ, 596, 143
- Blanton et al. (2003) Blanton, M. R., et al., ApJ, 594, 186
- Bower et al. (1998) Bower, R. G., et al., 1998, MNRAS, 299, 1193
- Brinchmann et al. (1998) Brinchmann, J., et al., 1998, ApJ, 499, 112
- Bruzual & Charlot (2003) Bruzual, G., & Charlot, S., 2003, MNRAS, 344, 1000
- bundy (06) Bundy, K., et al., 2006, ApJ, 651, 120
- Capaccioli et al. (1992) Capaccioli, M., Caon, N., & D’Onofrio, M. , 1992, MNRAS, 259, 323
- (15) Capak, P., et al., 2006, ApJS, this volume
- (16) Capak, P., et al., 2006, ApJS, this volume
- (17) Cassata, P., et al., 2005, MNRAS, 357, 903
- Cimatti et al. (2002) Cimatti, A., et al., 2002, A&A, 392, 395
- Conselice (2003) Conselice, C. J., 2003, ApJ, 147, 1
- (20) Cooper, M. C., et al., 2006a, MNRAS, 370, 198
- (21) Cooper, M. C., et al., 2006b, submitted to MNRAS, (astro-ph/0607512)
- Cowie et al. (1996) Cowie, L., Songaila, A., Hu, E.M., Cohen, J.G., 1996, AJ, 112, 839
- Cross et al. (2004) Cross, N J. G., et al., 2004, AJ, 128, 1990
- Cucciati et al. (2006) Cucciati, O., et al., 2006, A&A, 458, 39
- (25) Dekel, A., et al., 2005, Nature, 437, 707
- Dressler (1980) Dressler, A., 1980, ApJ, 236, 351
- (27) Ferreras I., Lisker T., Carollo C. M., et al., 2005, ApJ, 635, 243
- Finoguenov et al. (2007) Finoguenov, A., et al., 2007, ApJS, this volume
- Franceschini et al. (1998) Franceschini A., Silva L., Fasano, G., et al., 1998, ApJ, 506, 600
- Franzetti et al. (2006) Franzetti, P., et al. (the VVDS Team), 2006, A&A, submitted
- (31) Gavazzi, G., Pierini, D., & Boselli, A., 1996, A&A, 312, 397
- Gebhardt et al. (2003) Gebhardt, K., et al., 2003, ApJ, 597, 239
- Guzzo et al. (2007) Guzzo, L., et al., 2007, ApJS, this volume (Paper I)
- Hogg et al. (2003) Hogg, D. W., et al., 2003, ApJ, 585, L5
- (35) Giallongo, E., et al., 2005, ApJ, 622, 116
- (36) Gladders, M. D., Lopez-Cruz, O., Yee, H. K. C., $ Kodama, T., 1998, ApJ, 501, 571
- Hogg et al. (2002) Hogg, D. W., et al., 2002, AJ, 124, 646
- Hogg et al. (2004) Hogg, D. W., et al., 2004, ApJ, 601, L29
- Ilbert et al. (2006) Ilbert, O., et al., 2006, A&A, 453, 809
- Im et al. (2001) Im, M., et al., 2001, AJ, 122, 750
- (41) Jorgensen, I., Franx, M., & Kjaergaard, P., 1995, MNRAS, 273, 1097
- Kaifu et al. (2000) Kaifu, N., et al. 2000, PASJ, 52, 1
- Kauffmann (2004) Kauffmann, G., et al., 2004, MNRAS, 353, 713
- Kitzbichler & White (2006) Kitzbichler, M. G., & White, S. D. M., 2006, submitted to MNRAS, (astro-ph/0609636)
- (45) Kodama,T., & Arimoto, N., 1997, A&A, 320, 41
- Kodama et al. (2001) Kodama,T., et al., 2001, ApJ, 562, L9
- Koekemoer et al., (2007) Koekemoer., A., et al., 2007, ApJS, this volume
- Kormendy et al. (1977) Kormendy., J., 1977, ApJ, 218, 333
- (49) Larson., R. B., & Tinsley, B. M., 1978 AJ, 219, 46
- Lilly et al. (2007) Lilly, S., et al., 2007, ApJS, this volume
- Lotz et al., (2004) Lotz., J. M., et al., 2004 AJ, 128, 163
- Massey et al. (2007) Massey, R., et al., 2007, ApJS, this volume
- Menanteau et al. (2001) Menanteau, F., Abraham, R. G., & Ellis, R. S., 2001, MNRAS, 322, 1
- Menanteau et al. (2004) Menanteau, F., et al., 2004, ApJ, 612, 202
- Menci et al. (2005) Menci, N., et al., 2005, ApJ, 632, 49
- Mobasher et al. (2007) Mobasher, B., Capak, P., et al., 2007, ApJS, this volume
- Yagi et al. (2002) Yagi M., Kashikawa, N., Sekiguchi, M., Doi, M., Yasuda, N., Shimasaku, K. and Okamura, S., 2002, AJ, 123, 66
- Miyazaki et al. (2002) Miyazaki, S., et al. 2002, PASJ, 54, 833
- Renzini (2006) Renzini, A., 2006, Annual Reviews of Astronomy & Astrophysics, (astro-ph/0603479)
- Scodeggio et al. (2002) Scodeggio, M., et al., 2002, A&A, 384, 812
- Scarlata et al. (2007) Scarlata, C., et al., 2007, ApJS, this volume
- (62) Scoville, N. Z., et al., 2007a, ApJS, this volume
- (63) Scoville, N. Z., et al., 2007b, ApJS, this volume
- (64) Scoville, N. Z., et al., 2007c, ApJS, this volume
- Schade et al. (1999) Schade, D., et al., 1999, ApJ, 525, 31
- Searle et al. (1973) Searle, L., Sargent, W. L. W., & Bagnuolo, W. G., 1978, ApJ, 179, 427
- (67) Strateva, I., et al., 2001, AJ, 122, 1861
- Tanaka et al. (2005) Tanaka, M., et al., 2005, MNRAS, 362, 268
- Taniguchi et al. (2007) Taniguchi, Y., et al., 2007, ApJS, this volume
- (70) Treu, T., et al., 2005a, ApJ, 622, L5
- (71) Treu, T., et al., 2005b, ApJ, 633, 174
- Tully & Pierce (2000) Tully, R. B., & Pierce, M. J., 2000, ApJ, 533, 744
- Van Dokkum & Stanford (2003) Van Dokkum, P. G., & Stanford, S. A., 2003, ApJ, 585, 78
- Yee et al. (2005) Yee, H. K. C., Hsieh, B. C., Lin, H., & Gladders, M. D., 2005, ApJ, 629, 77
- Weiner et al. (2005) Weiner, B. J., et al., 2005, ApJ, 620, 617