Constraints on the prevalence of luminous, dusty starbursts at very high redshifts
Abstract
At a conference devoted to ever deeper surveys hunting for ever more distant galaxies, I posed a question for which a concensus view has been difficult to reach: ‘Is there evidence for, or can we rule out, a significant population of dust-obscured starbursts at ?’ If, as seems likely, submm-selected galaxies are proto-ellipticals, one of the biggest unanswered questions is whether a significant fraction form at very high redshift – perhaps by the collapse of single gas clouds – or whether the entire population forms over a range of redshifts, primarily via merging. The latter scenario is favoured strongly by existing data for the majority of bright submm galaxies – mergers are common; typical spectroscopic redshifts are in the range 1–3. However, our reliance on radio imaging to pinpoint submm galaxies leaves open the possibility of a significant population of very distant, massive starbursts. To rule out such a scenario requires a completely unbiased redshift distribution for submm-selected galaxies and this is unlikely to be forthcoming using conventional optical/infrared spectroscopic techniques. Here, I summarise recent attempts to close that door, or pass through to an early Universe inhabited by a significant population of collosal, dust-obscured starbursts. I conclude that the door is only barely ajar; however, the idea of galaxies forming, near instantaneously, on a collosal scale is not dead: I show an SMG imaged by MERLIN+VLA for 1 Ms – the deepest high-resolution radio image so far obtained. The data reveal a galaxy-wide starburst covering 10 kpc. Thus interpreting SMGs in terms of compact ULIRG-like events may not always be appropriate, as one might expect when considering the Eddington limit for 103-M⊙ yr-1 starbursts.
Royal Observatory, Blackford Hill, Edinburgh, Scotland
1. Introduction
Surveys with bolometer arrays at mm and submm wavelengths are potentially sensitive to dusty objects at extreme redshifts, galaxies that drop out of surveys at shorter and longer wavelengths due to obscuration and unfavourable corrections. The first cosmological surveys, using the SCUBA and MAMBO cameras, radically changed the accepted picture of galaxy formation and evolution, moving away from the optocentric view of the last century. The discovery of so-called ‘SCUBA galaxies’ (Smail, Ivison & Blain 1997), now better known as submm galaxies or SMGs, was greeted with surprise due to the remarkable evolution in dusty, starburst galaxies implied by such a large source density at the flux levels accessible to the first generation of bolometer arrays.
Sadly, SCUBA has been retired. SCUBA-2 will revolutionise submm astronomy once again, but not until the winter of 2007-08. At the depths that were accessible to SCUBA, and to cameras like MAMBO-117, SMGs constitute around half of the submm background and thus at least a quarter of the total extragalactic background. The relation between metal production and background radiation then implies that roughly 25% of all the stars ever formed have formed in extreme objects like this (Eales et al. 1999). The combination of this argument, their space density and their high bolometric luminosities made it hard to resist the conclusion that these objects are ellipticals seen during a phase in which a significant fraction of their stars are forming, loosely ‘proto-ellipticals’.
Initial excitement was tempered by the first efforts to study SMGs at optical and infrared wavelengths. Early reports, backed up with a study in the GOODS North field by Hughes et al. (1998), suggested that the majority of the submm population had no plausible counterparts at magnitudes routinely accessible to optical surveys. Attention was diverted to various redshift engines and broadband photometric techniques (e.g. Townsend et al. 2001; Wiklind 2003). As a result, only a handful of detailed studies were attempted, often for extreme and possibly unrepresentative galaxies.
Progress resumed when deep, wide-field, high-resolution radio imaging of submm survey fields were shown to recover roughly half of the SMGs in each field, with an astrometric precision of 0.3′′ (e.g. Ivison et al. 1998, 2002). Combined with the submm flux density, radio data provide a rough estimate of redshift (Carilli & Yun 1999). They also enable refinement of submm samples, increasing the detection fraction to two thirds of SMGs at 850-m flux density levels in excess of 5 mJy (Ivison et al. 2002; Pope et al. 2006). Accurate positions in hand, bright SMGs were found to be a diverse population — some are quasar-like, with broad lines and X-ray emission (e.g. Knudsen et al. 2003), some resemble BAL quasars (e.g. Vernet & Cimatti 2001), some are morphologically complex (e.g. Smail, Smith & Ivison 2005), some are extremely red (e.g. Smail et al. 1999; Webb et al. 2003; Dunlop et al. 2004); some bear the signatures of obscured active nuclei and/or powerful winds (e.g. Smail et al. 2003).
Not surprisingly, given their median magnitude (, Vega), spectroscopic redshifts have been difficult to determine. The most ambitious survey of SMGs was undertaken by Chapman et al. (2003, 2005 — hereafter C03, C05). The median redshift was 2.2 for -mJy galaxies selected using SCUBA and pinpointed at 1.4 GHz or, in some cases, selected as optically faint radio galaxies and detected subsequently with SCUBA. The accurate redshifts reported by C03 and C05 facilitated the first systematic measurements of molecular gas mass for SMGs (–) via observations of CO (Neri et al. 2003; Greve et al. 2005; see also early work by Frayer et al. 1998, 1999), as well as constraints on gas reservoir size and dynamical mass (Tacconi et al. 2006 – though see later). The data suggest SMGs are massive systems and provide some of the strongest tests of galaxy-formation models to date.
2. Current state of play
In spite of this progress, a detailed understanding of SMGs remains a distant goal that many believe is now best achieved by detailed study of individual objects. Confusion currently limits our investigations to the brightest SMGs (although surveys through lensing clusters have provided a handful of sources typical of the faint population that dominates the cosmic background, e.g. Smail et al. 2002; Kneib et al. 2004; Borys et al. 2004). We must also recall that selection biases have potentially skewed our understanding. Around half of all known SMGs remain undetected in the radio due partly, at least, to the lack of sufficiently deep radio data, which do not benefit from the same correction as submm data. Although a handful of radio-undetected SMGs have been targeted spectroscopically, few have yielded reliable redshifts. Finally, there has been only limited coverage at red and IR wavelengths in existing spectroscopic surveys.
Here, at a conference devoted to ever deeper surveys hunting for ever more distant galaxies, I posed the question: “Is there evidence for, or can we rule out, a significant population of dust-obscured starbursts at ?”
It is difficult to present a concensus view: this issue divides the submm community, with opinions correlated distinctly with age. Deep imaging was not possible in the pre-SCUBA era so submm cosmologists spent their time hunting for thermal emission from distant quasars and radio galaxies (Fig. 1; e.g. McMahon et al. 1994; Ivison 1995; Hughes, Rawlings & Dunlop 1997). In the eyes of the SCUBA generation, these saggy, old astronomers have found it difficult to accept that their dusty high-redshift AGN were rare freaks which modellers can label ‘unrepresentative’. The C05 spectroscopic survey suggests that the vast majority of SMGs lie at with a mere smattering at and : 20% at most (cf. Dunlop 2001). But is this necessarily so? Would we be aware of a significant population of distant, dusty starbursts, maybe at the 25% level, hiding within current SMG samples?
Several potentially important effects – not least our reliance on radio imaging to pinpoint SMGs (see Fig. 2) – leave the door open for a significant population of distant, massive starbursts. To rule out such a scenario requires an unbiased redshift distribution for SMGs and this is unlikely to be forthcoming by conventional spectroscopic techniques (though see Pope et al. 2006 for the best available attempt using conventional optical/IR photometric methods). Before ALMA, JWST or the ELT, and without the construction of dedicated wide-bandwidth cm/mm/submm spectrometers designed to solve this specific problem, the only way to make progress is to use the distinctive SEDs of high-redshift dusty galaxies as a method of estimating redshifts.
3. Recent work

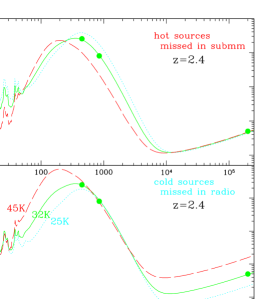
Carilli & Yun (1999) and Eales et al. (2003) were amongst the first to address this issue, along with Hughes et al. (2002), Wiklind (2003) and Aretxaga et al. (2003), though cf. Blain, Barnard & Chapman (2003) and C05. The approach generally employs long-wavelength flux ratios as redshift indicators. Carilli & Yun pioneered the use of the flux density ratio (Fig. 3), mentioned first by Hughes et al. (1998) and used later by Ivison et al. (2002) to determine a median redshift for SMGs of 2; however, this particular ratio flattens at higher redshifts and the flux ratio is not very useful at .
Eales et al. (2003) developed a different redshift indicator: the ratio of 850- to 1200-m flux density, as traced by MAMBO and SCUBA, respectively. This has complementary properties to the radio/submm flux ratio: it is useless as a redshift indicator at , but it should very good at higher redshifts. For answering the specific question of whether there is a significant population of dusty, starburst galaxies at , as one would expect if part of the elliptical population forms by monolithic collapse, this is the most useful redshift estimator. Fig. 4 shows the predicted 850-/1200-m flux density ratio as a function of redshift for several template SEDs. Errors for individual redshift estimates are clearly very large, to put it mildly, but the error on the mean redshift of a large sample is much smaller.
Eales et al. carried out SCUBA 850-m photometry-mode observations (in which a single bolometer in each array is pointed at the target) of the brightest sources from one of the earliest blank-field 1200-m MAMBO surveys. Using SCUBA to follow up MAMBO sources exploits two advantages over MAMBO follow-up of SCUBA sources: first, a 1200-m survey is likely to contain a larger fraction of very-high-redshift sources than an 850-m survey; second, the IRAM 30-m MRT’s resolution at 1200 m is 30% better than the SCUBA resolution at 850 m which is crucial for accurate photometry. More accurate positions from radio imaging would be better still, but this would re-introduce our most pernicious bias.
Eales et al. concluded that the 850-/1200-m flux density ratios for 15 of their sample of 23 SMGs were much lower than expected for low-redshift galaxies and that these SMGs must either be at higher redshifts, in fact, or have different rest-frame SEDs that local starbursts. Various systemic effects were investigated and ruled out, including concerns about absolute flux calibration, astrometric errors and flux boosting, the latter being a particular example of the process described by Eddington (1940) in which the statistical properties of a a distribution of experimental measurements are distorted by noise.
Greve et al. (2004) took the next logical step, using unbiased blank-field surveys at 850 and 1200 m (Fig. 5) to investigate the reliability of SMG samples, to analyse SMGs using flux ratios sensitive to redshift at , and to search for ‘SCUBA drop-outs’, i.e. galaxies, where the far-IR bump has moved through SCUBA’s 850-m filter. For a sub-sample of 13 SMGs detected by both MAMBO and SCUBA, Greve et al. concluded that the distribution of 850-/1200-m flux density ratios was consistent with the spectroscopic redshift distribution of radio-detected SMGs (C03, C05). For the 18 MAMBO sources not detected by SCUBA, the distribution of 850-/1200-m flux density ratios was indistinguishable statistically from that of the SMGs identified by both MAMBO and SCUBA.
Although Greve et al. (2004) disagreed fundamentally with the findings of Eales et al. (2003), it is easy to see that the sub-sample of SMGs detected by both MAMBO and SCUBA – which makes up less than half of the parent MAMBO sample – will (by definition) contain no ‘SCUBA drop-outs’. At this stage I therefore consider that the door to an early Universe inhabited by a significant population of collosal, dust-obscured starbursts is still ajar. In fact, the sample contains at least one object detected robustly (6.8) at 1200 m and yet apparently absent in the SCUBA image – an object with the very characteristic that Greve et al. set out to find. This SMG (LH 1200.02 at 10 52 38.8, +57 23 22, J2000) is circled in Fig. 5. It lacks both a robust radio detection and a convincing Spitzer identification (Fig. 6). Elucidating its nature – hyperluminous, dusty starburst at or an less distant object with significantly lower characteristic dust temperature, possibly 25 K – has progressed at an excruciatingly slow pace.
Ivison et al. (2005) presented a robust sample of bright SMGs selected using a dual-survey extraction technique, aiming to leave the regime where the modest significance of sources compromises the analyses via the presence of spurious sources or the effect of flux boosting. We would expect the resulting sample to be detected in well-matched radio imaging (). The goal was to determine the true fraction of radio drop-outs amongst SMGs, as well as some practical information such as the intrinsic positional uncertainty for SMGs in the absence of radio/IR counterparts.
The dual-survey selection technique yielded 19 SMGs of which a high fraction (80%) had radio counterparts (Fig. 7). Given the likely 10% contamination by spurious sources, this suggests that very distant SMGs () are unlikely to make up more than 10% of the bright SMG population and that almost all of the mJy SMG population is amenable to study via the deepest current radio imaging, e.g. the r.m.s. imaging of the Lockman Hole field at 1046+59 by Owen et al. (in preparation). A number of caveats remain, however: for one, an AGN contribution to the radio flux density could mask a high-redshift population.
4. SMGs as scaled-up ULIRGs?
It is often argued that SMGs resemble scaled-up ULIRGs, with compact, intense starbursts occurring on scales of a few kpc or less. Measurements of small source sizes for their radio or CO emission are often cited to support this notion (e.g. Tacconi et al. 2006). Evidence exists, however, that this compact mode of galaxy formation is not necessarily ubiquitous amongst high-redshift galaxies, nor would we expect it to be when we consider the Eddington limit for 103-M⊙ yr-1 starbursts. Ivison et al. (2000) and Stevens et al. (2003, 2004) presented images of distant, dusty AGN – radio galaxies and X-ray-absorbed quasars – showing rest-frame far-IR emission on scales of 10s of kpc, though whether that emission is due to smooth, galaxy-wide events or due to a number of intense starbursting clumps has so far been impossible to ascertain.
Bright SMGs for which high-resolution submm/mm imaging have been sought to address this question, thus far in vain, include HzRG850.1 (Ivison et al. 2000). Now, however, exceptionally deep, high-resolution radio imaging with the MERLIN array (Biggs & Ivison, in preparation) – an unprecendented 1-Ms integration, combined in the plane with 270 ks of VLA data using a new technique – means that we can investigate the scale of the radio (and thus far-IR) emission in normal SMGs. Fig. 8 shows one example: LH 1200.08 at . Its radio emission is extended on a scale of at least 2′′ (15 kpc), with several compact knots. As such, it bears only a passing resemblence to low-redshift ULIRGs.
It is interesting to speculate about how this object would appear if it were at observed with the resolution and sensitivity more usually available to us and it lay at the median spectroscopic redshift of SMGs? The answer: it would resemble many of the existing radio detections – a faint, barely-resolved radio source displaying very little evidence of the galaxy-wide starburst apparent in this deep MERLIN image.
Acknowledgments.
Many thanks to Steve Eales, Thomas Greve, Andy Biggs, Thomas Targett, Eiichi Egami, James Dunlop, Ian Smail, Andrew Blain, Scott Chapman, Jason Stevens, Mat Page and Dave Alexander.
References
- Aretxaga (2003) Aretxaga I. et al., 2003, MNRAS, 342, 759
- Blain (2003) Blain A.W., Barnard V.E., Chapman S.C., 2003, MNRAS, 338, 733
- Borys (2004) Borys C. et al., 2004, MNRAS, 352, 759
- Carilli (1999) Carilli C.L., Yun M.S., 1999, ApJ, 513, L13
- Chapman (2003) Chapman S.C. et al., 2003, Nature, 422, 695 (C03)
- Chapman (2005) Chapman S.C. et al., 2005, ApJ, 622, 772 (C05)
- Dunlop (2001) Dunlop J.S., 2001, New Astronomy Reviews, 45, 609
- Dunlop (2004) Dunlop J.S. et al., 2004, MNRAS, 350, 769
- Dunne (2001) Dunne L., Eales S., 2001, MNRAS, 327, 697
- Eales (1999) Eales S. et al., 1999, ApJ, 515, 518
- Eales (2003) Eales S. et al., 2003, MNRAS, 344, 169
- Eddington (1940) Eddington, A.S., 1940, MNRAS, 100, 354
- Frayer (1998) Frayer D.T. et al., 1998, ApJ, 506, L7
- Frayer (1999) Frayer D.T. et al., 1999, ApJ, 514, L13
- Greve (2004) Greve T.R. et al., 2004, MNRAS, 354, 779
- Greve (2005) Greve T.R. et al., 2005, MNRAS, 359, 1165
- Hughes (1997) Hughes D.H., Dunlop J.S., Rawlings S., 1997, MNRAS, 289, 766
- Hughes (1998) Hughes D.H. et al., 1998, Nature, 394, 241
- Hughes (2002) Hughes D.H. et al., 2002, MNRAS, 335, 871
- Ivison (1995) Ivison R.J., 1995, MNRAS, 275, L33
- Ivison (1998) Ivison R.J. et al., 1998, MNRAS, 298, 583
- Ivison (2000) Ivison R.J. et al., 2000, ApJ, 542, 27
- Ivison (2002) Ivison R.J. et al., 2002, MNRAS, 337, 1
- Ivison (2005) Ivison R.J. et al., 2005, MNRAS, 364, 1025
- Kneib (2004) Kneib J.-P. et al., 2004, MNRAS, 349, 1211
- Knudsen (2003) Knudsen K.K., van der Werf P.P., Jaffe W., 2003, A&A, 411, 343
- McMahon (1994) McMahon R.G. et al., 1994, MNRAS, 267, L9
- Neri (2003) Neri R. et al., 2003, A&A, 597, L113
- Pope (2006) Pope A. et al., 2006, MNRAS, 370, 1185
- Scott (2002) Scott S.E. et al., 2002, MNRAS, 331, 817
- Smail (1997) Smail I., Ivison R.J., Blain A.W., 1997, ApJ, 490, L5
- Smail (1999) Smail I. et al., 1999, MNRAS, 308, 1061
- Smail (2002) Smail I. et al., 2002, MNRAS, 331, 495
- Smail (2003) Smail I. et al., 2003, MNRAS, 342, 1185
- Smail (2005) Smail I., Smith G.P., Ivison R.J., 2005, ApJ, 631, 121
- Stevens (2003) Stevens J.A. et al., 2003, Nature, 425, 264
- Stevens (2004) Stevens J.A. et al., 2004, ApJ, 604, L17
- Tacconi (2006) Tacconi L.J. et al., 2006, ApJ, 640, 228
- Townsend (2001) Townsend R.H.D. et al., 2001, MNRAS, 328, L17
- Vernet (2001) Vernet J., Cimatti A., 2001, A&A, 380, 409
- Webb (2003) Webb T.M. et al., 2003, ApJ, 587, 41
- Wiklind (2004) Wiklind T., 2004, ApJ, 588, 736