H I and CO observations of Arp 104: a spiral–elliptical interacting pair
Abstract
We present data probing the spatial and kinematical distribution of both the atomic (H i) and molecular (CO) gas in NGC 5218, the late-type barred spiral galaxy in the spiral–elliptical interacting pair, Arp 104. We consider these data in conjunction with far-infrared and radio continuum data, and -body simulations, to study the galaxies interactions, and the star formation properties of NGC 5218. We use these data to assess the importance of the bar and tidal interaction on the evolution of NGC 5218, and the extent to which the tidal interaction may have been important in triggering the bar. The molecular gas distribution of NGC 5218 appears to have been strongly affected by the bar; the distribution is centrally condensed with a very large surface density in the central region. The -body simulations indicate a timescale since perigalacticon of yr, which is consistent with the interaction having triggered or enhanced the bar potential in NGC 5218, leading to inflow and the large central molecular gas density observed. Whilst NGC 5218 appears to be undergoing active star formation, its star formation efficiency is comparable to a ‘normal’ SBb galaxy. We propose that this system may be on the brink of a more active phase of star formation.
keywords:
galaxies: ISM – galaxies: interactions – galaxies: individual: NGC 5218 – radio lines: galaxies1 Introduction
Barred galaxies represent an important sub-sample of systems in any study of galaxy interactions and induced star formation. Bar formation is attributed to one of two possible mechanisms; bars can form spontaneously as a result of an intrinsic gravitational instability, or they can be produced by tidal disturbance of the galactic potential during an interaction. Both mechanisms are supported by numerical simulations. Massive stellar disks with small velocity dispersions are intrinsically unstable to bar formation and will develop a strong bar structure without external perturbation within a few rotation periods (e.g., Athanassoula & Sellwood, 1986). Similarly, external perturbations can induce bar structures in galactic disks that are stable in isolation (e.g., Noguchi, 1987; Gerin, Combes & Athanassoula, 1990; Mihos & Hernquist, 1996, hereafter MH96).
Observationally, Keel et al. (1996) used -band images to study the bar fraction in a sample of pairs, finding 80% of the pairs to display signs of bar formation. Elmegreen, Elmegreen & Bellin (1990) also find a high fraction of barred galaxies in binary systems (), higher than in the field () or group environments (). However, van den Bergh (2002), using a sample of 930 galaxies found no evidence for a dependence of bar frequency on galaxy environment, consistent with the nature of the host galaxy being the most important factor in bar formation. Taken together these results suggest that bar formation is strongly dependent on the host galaxy, but that pair-wise interactions do induce bars in many systems.
Galaxy bars represent a principal mode of disruption to the axisymmetric potential of spiral galaxies, providing a mechanism of gas inflow toward the central regions. The simulations of Mihos (1994) and MH96 indicate that bars can play a particularly important role in fly-by encounters, where they provide a dominant trigger for central gas concentration and ensuing star formation. In addition, the high proportion of galaxies in the local universe hosting bars (Eskridge et al., 2000; Menendez-Delmestre et al., 2004) means that the response of a barred potential to an external perturbation is also of interest. The relationship between bars and interactions and the evolution of the ISM in barred systems is crucial in attaining a better understanding of the star formation response of interacting galaxies.
Both theoretical (MH96) and observational (Sakamoto et al., 1999a; Sheth et al., 2005) evidence exists pointing to enhanced molecular gas concentration in barred systems (at least in early-type spirals). However, the relationship between bars and star formation remains less clear. Whilst bars do not appear to affect the disk-wide star-formation properties of galaxies, they can be important in triggering enhanced star formation in the central regions (for a review see Kennicutt, 1994). Star formation in barred galaxies manifests itself in a diverse range of morphologies (Phillips, 1996; Sheth et al., 2000, 2002). A number of studies point to an enhanced level of star formation in the central region of early-type barred systems, although similar enhancements are not observed in late-type systems (Huang et al., 1996; Ho et al., 1997). This distinction is consistent with molecular gas observations. Bars may well play a particularly important role in the evolution of the most actively star-forming systems. Phillips (1996) examined the ratio in a sample of IR-bright galaxies and only detected a difference between the barred and non-barred systems for the most actively star-forming galaxies. Similarly, Hunt & Malkan (1999) found a higher incidence of bars in starburst galaxies, and Hawarden et al. (1986), who looked at the properties of intrinsically luminous galaxies, detected a mean IR luminosity three times larger in barred systems than their unbarred counterparts.
In this paper we examine the spatial and kinematic distribution of both the atomic and molecular gas associated with NGC 5218, the late-type barred spiral galaxy in the spiral–elliptical interacting pair Arp 104. This is one of a small sample of nine spiral–elliptical interacting pairs, which have been studied by Cullen, Alexander & Clemens (2003, 2006) and Cullen & Alexander (2005). Each pair has an H i flux of at least 5 Jy km s-1, and Arp 104 has a relatively large separation between the galaxies, implying they are in the early state of interaction. We use these data in conjunction with -body simulations and data probing the star formation properties of this system to assess the impact of the bar on NGC 5218’s evolution, and look at the extent to which the tidal interaction may have been important in triggering its bar. In Section 2 we present details of our H i and CO observations. In Section 3 we discuss the star-formation properties and efficiency of NGC 5218 and present the results of the simulations. In Section 4 we examine the importance of the bar in this galaxy. In Section 5 we discuss our results, looking first at the importance of the bar in terms of NGC 5218’s evolution and subsequently at the likelihood that the bar has been triggered by the tidal interaction.
2 Observations and data reduction
2.1 Optical morphology of Arp 104
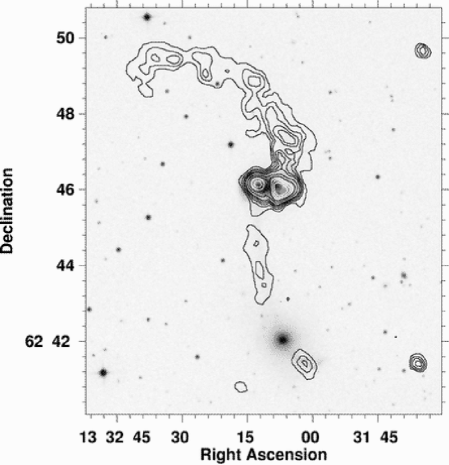
Arp 104, shown in Fig. 1, consists of two interacting galaxies, see NED111see http://nedwww.ipac.caltech.edu/: the southern galaxy, NGC 5216, is an E0 pec () and the northern galaxy, NGC 5218, is an SB(s)b? pec (). At an assumed distance of 41.1 Mpc (from a recessional velocity of 2880 , and using a Hubble constant of 70 Mpc-1), the projected major axis diameter () is 29.9 kpc () for NGC 5216 and 21.5 kpc () for NGC 5218. The projected separation of the two galaxies is 49.1 kpc. Schombert, Wallin & Struck-Marcell (1990) have conducted a multicolour photometric study of the optical tidal features of a sample of interacting galaxies, including Arp 104. They found the tidal features of Arp 104 are bluer than the central regions of both NGC 5218 and NGC 5216, but similar to the colours of the outer disk in NGC 5218.
2.2 VLA 21-cm observations
The H i observations of Arp 104 were made with the VLA in C-array configuration on 1994 December 24 and in D-array on the 1995 March 22. Both datasets were retrieved from the VLA archive and analysed. For both the C- and D-array observations, a correlator mode with online Hanning smoothing giving 63 channels with a velocity width per channel of 10.3 (48.8 kHz) was used. Both sets of observations were centred on RA , Dec (J2000), at a heliocentric radial velocity of 2900 . The total on-source integration times were 258 and 236 minutes for the C and D-array observations respectively. In both cases on-source scans were interleaved with those of the phase calibrator, 1400621. For the C-array observations both 3C48 and 3C286 were observed as flux calibrators during the observations, with assumed flux densities of 16.0 and 14.8 Jy respectively. For the D-array observations 3C286 was used as the flux calibrator with an assumed flux density of 14.8 Jy.
Data reduction followed standard procedures using the National Radio Astronomy Observatory (NRAO) Astronomical Image Processing System (AIPS). After flagging, the data were binned to velocity resolution of 20.7 to improve the signal to noise. Subtraction of the average of the line-free channels from all channels was used to remove the continuum emission. AIPS task IMAGR was used to produce naturally-weighted channel maps with an angular resolution for the C-array data and for the D-array data.
2.3 GMRT H i absorption observations
In addition to the H i images from the VLA observations, NGC 5218 was also observed with the Giant Metrewave Radio Telescope (GMRT) on 2003 October 16 to obtain an H i absorption spectra towards its nuclear continuum emission. The GMRT is an aperture synthesis telescope comprising of thirty 45-m dishes (Rao, 2002). The full width half maximum of the primary beam of the telescope at 1.4 GHz is . The backend setup employed was a 30 station FX correlator with 128 spectral channels over a 4 MHz bandwidth (857 ), giving a resolution of 31.25 kHz. The observations were centred at a heliocentric radial velocity of 2880 . The total integration time on source was 174 minutes. On-source scans were interleaved with those of the phase calibrator, 1313675. 3C286 was used as a flux calibrator with an assumed flux density of 14.8 Jy. The pointing centre was the core of NGC 5218: RA , Dec (J2000). These data were binned to a velocity resolution of 40 and channel maps made using natural weighting, giving a spatial resolution of . The flux density of the continuum source is approximately 25 mJy, consistent with the FIRST observation (White et al., 1997).
2.4 12CO () observations
Observations of NGC 5218 in the 12CO () line at 115.27 GHz were made using the 10-element Berkeley–Illinois–Maryland Association (BIMA) millimeter interferometer. Two usable tracks were observed in C-configuration on 2003 April 28 and May 13. The BIMA correlator was configured to have a resolution of 1.56 MHz (4 ) over a total bandwidth of 368 MHz (959 ). The primary beam at BIMA at this frequency is FWHM. 3C84 and 1638573 were observed for passband and phase calibration respectively. Data calibration was performed in Miriad (Sault, Teuben & Wright, 1995). Calibrated datasets were then read into AIPS, combined, averaged to a spectral resolution of 20 and images synthesised.
2.5 12CO () observations
Observations of the 12CO () emission of NGC 5218 at 230.54 GHz were made with the JCMT in ‘service’ mode on 2001 November 30 and 2003 January 4. Observations were made on a grid in RA and Dec, with spacing, centred at RA , Dec (J2000). The spacing of grid points produced a fully-sampled map over the area observed (JCMT beam at 230.54 GHz). Sky subtraction was achieved by beam switching to a point in declination from the reference position. Observations were centred on a heliocentric radial velocity of 2880 with a bandwidth of 920 MHz (1200 ), split into channels separated by 625 kHz. The spectra were binned to a velocity resolution of 20.9 to match that of the VLA data.
Standard calibration observations were made at the same time as the observations of NGC 5218. Data calibration followed the standard JCMT procedure, adopting the beam efficiency and forward scattering efficiency on the JCMT website yielding an of 0.77. To convert between main beam temperature and flux it was assumed that the 12CO () emission could be modelled as a point source. Whilst this is not strictly the case, it allows a lower limit to be placed on the 12CO () flux for NGC 5218. The conversion between flux and main beam temperature, assuming a point source, is given by (assuming the FWHM of the JCMT beam at 230 GHz is ).
3 Results
3.1 Star-formation rate
The flux densities of NGC 5218 at 12, 25, 60 and 100 m, taken from the IRAS High Resolution Image Restoration Atlas (Cao et al., 1997), are 0.36, 0.92, 7.14 and 14.38 Jy respectively. This yields a far-infrared (FIR) luminosity ( m, Helou et al., 1988) of W ( L⊙). Using the calibration of Bell (2003) we obtain a FIR star-formation rate (SFR) of 5.3 M⊙ yr-1. The infrared luminosity ( m) for NGC 5218 is L⊙ (Perault, 1987).
Both NGC 5218 and NGC 5216 have detected radio continuum emission recorded by the NVSS survey (Condon et al., 1998), with 30.4 and 31.8 mJy respectively. The NVSS flux density of NGC 5218 corresponds to a luminosity of 6.16 W Hz-1. Using the radio SFR calibration of Bell (2003) this yields a SFR of 3.4 M⊙ yr-1, a factor of below the SFR obtained using the calibration of Condon (1992) (7.6 M⊙ yr-1). For the purposes of this work we adopt the FIR estimated SFR of 5.3 M⊙ yr-1.
3.2 Atomic Hydrogen
The combined VLA C- and D-array H i map of Arp 104 (Fig. 1) reveals a tidal tail to the north-east of the late-type system (NGC 5218), and a tidal bridge extending southward toward the early-type companion (NGC 5216). Figure 1, like the other H i and CO results shown here, has not been corrected for the primary beam of the telescope, which is much larger than the scale of the emission that is seen. The tidal tail to the north-east forms a quarter-circle arc with a radius of approximately , corresponding to a physical radius of 48 kpc. The tidal bridge to the south is approximately long, corresponding to a physical length of 60 kpc. The bridge is oriented directly toward the elliptical, NGC 5216, with a small tail extending beyond the elliptical to the south-west.
Using the lower resolution D-array data we detect an H i flux above a level of 0.035 Jy beam-1 over an area of approximately 37 arcmin2. At a distance of 41 Mpc, this corresponds to a physical area of 5360 kpc2. The detected flux in this low resolution map peaks at 0.98 Jy beam-1 , falling to around 0.05 Jy beam-1 in the more extended regions of the tidal tail.
The total H i flux of the Arp 104 system, obtained by adding all the flux in the low-resolution channel maps is Jy , which is in good agreement with the single-dish flux, Jy (Theureau et al., 1998). The H i mass, given by
is M⊙.
Approximately 30% of the H i emission detected in the D-array map appears to be associated with the late-type system, NGC 5218, with the remainder forming an extended tidal tail. This is consistent with the trend found by Hibbard & van Gorkom (1996). For a sample of four galaxies (Arp 295b, NGC 4676a, NGC 4676b and NGC 520) considered to lie in the central region of the merger sequence, they find of the total atomic gas emission comes from the inner regions of the system; this percentage falls dramatically for more advanced mergers.
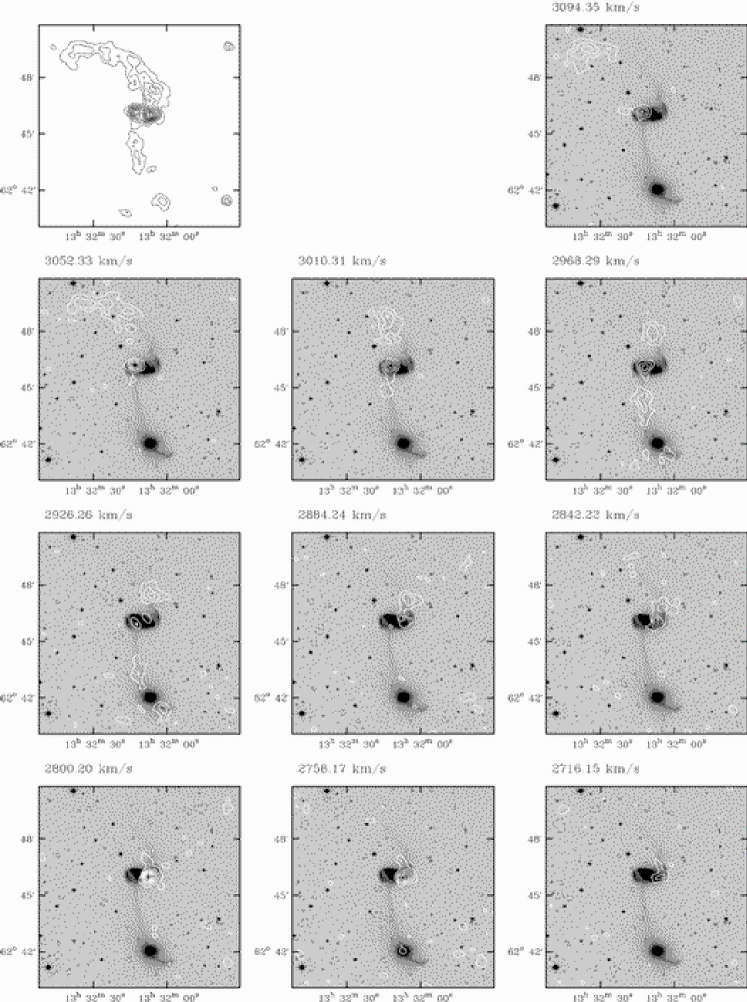
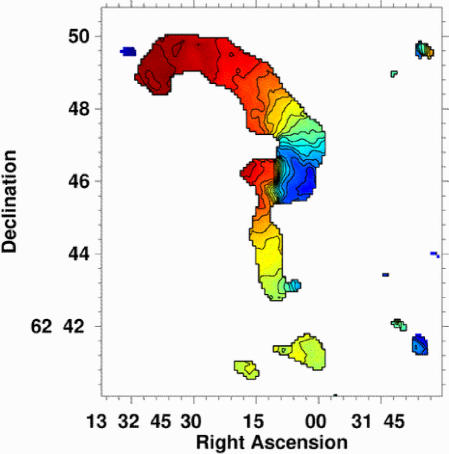
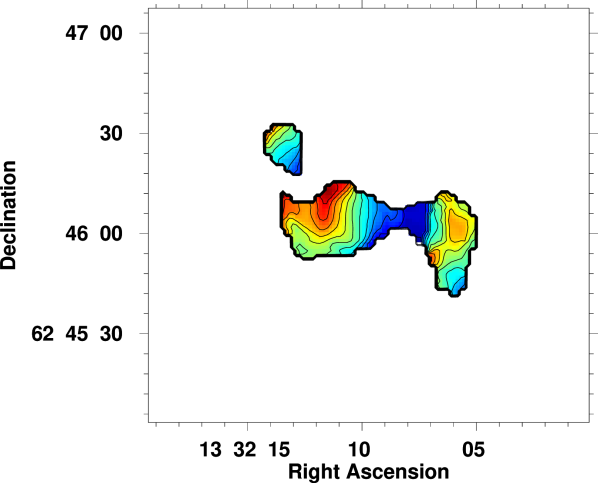
Channel maps of the H i emission are shown in Fig. 2, whilst Fig. 3 displays the intensity weighted mean velocity field of Arp 104. H i emission is detected in channels 7–25 corresponding to the velocity range . The northern tidal tail has a velocity dispersion of with velocities in the range . The tidal bridge to the south has a slightly smaller velocity dispersion of , with velocities in the range . The largest velocity dispersion is observed for the gas still associated with NGC 5218. Here velocities range from with the western side blueshifted.
The central region of NGC 5218 is seen in absorption due to the presence of a bright radio continuum source in NGC 5218 (see Fig. 4). The absorption profile is centred on a velocity of 2884 . The detected H i emission believed to be still bound to the late-type system is distributed approximately symmetrically about this velocity. In contrast, emission from tidal material is mostly redshifted.

The depth of the H i absorption feature give an optical depth of with a linewidth of 80 . Assuming a spin temperature of 100 K, this corresponds to an H i column density of cm-2. If the continuum source is located in the centre of the galaxy we would observe approximately half of the H i along the line of sight in absorption. This implies a total H i column density through the centre of the disk of cm-2.
3.3 Molecular Gas
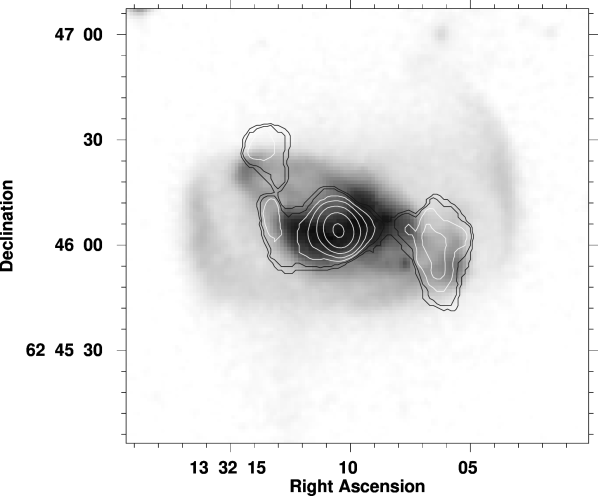
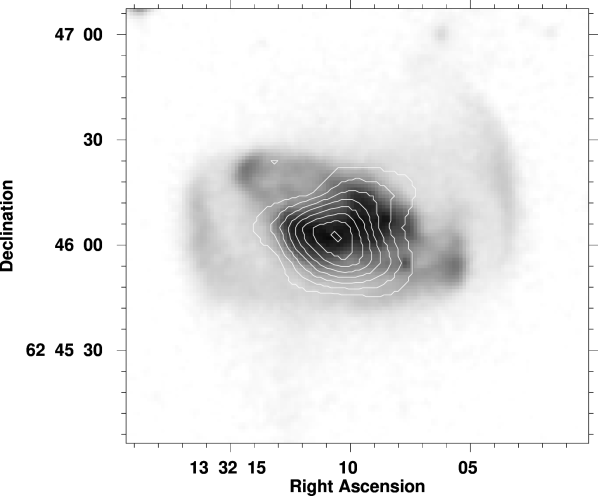
Naturally weighted BIMA data were used to produce an image cube with a synthesised beam of , corresponding to a physical scale of 1.4 kpc. Figure 5 shows the integrated 12CO () map overlayed on digitised sky survey -band image. The CO data reveal four distinct peaks. The central peak is significantly brighter than the peaks observed offset to the east and west, its emission exceeding that in the eastern and western peaks by a ratio of and respectively.
Whilst the molecular gas emission in NGC 5218 is clearly centrally condensed there is also a sizeable extended component. The central peak itself is extended in the easterly direction, well aligned with the optical bar axis. Examining the subsidiary peaks in the molecular gas, there is a clear peak located toward the eastern end of the bar, whilst at the western end there is a larger area of emission extending from the bar end toward a region of star formation in the spiral arm. There is similarly a peak in the eastern region of the galaxy associated with a region of star formation in the eastern spiral arm.
The integrated 12CO () flux for NGC 5218 was obtained from the primary beam corrected naturally weighted image cube. The molecular gas mass was estimated in solar masses from the integrated 12CO () flux using the empirical relation:
where is the wavelength in metres, is the distance in megaparsecs to the source, is the integrated CO flux in Jy km s-1 and CO-to-H2 conversion factor, cm-2 K km s-1 has been assumed (Bloemen et al., 1986). The observed integrated flux of Jy is in good agreement with single-dish observations of Zhu et al. (1999), who obtained Jy , which implies that the BIMA observations are not missing any flux. Our flux gives a total H2 mass of M⊙.
The gas surface density in NGC 5218 is given by (Shibatsuka et al., 2003):
and , where is the galaxy inclination and the factor 1.36 accounts for elements other than hydrogen (e.g., Allen, 1973). To estimate the peak central gas surface density from our 12CO () data we re-made the image cubes applying uniform weighting, giving a spatial resolution of . These data gave a peak central gas surface density of M⊙ pc-2. Additional observations of the molecular gas in this galaxy have been made by Olsson et al. (2004) at higher resolution () using the OVRO millimetre array. Using these data they observe a peak gas surface density of M⊙ pc-2.
The intensity weighted mean velocity field of the BIMA 12CO () data is shown in Fig. 6. These data are used later to fit a rotation curve for NGC 5218. The 12CO () emission observed with the JCMT is shown in Fig. 7. CO emission is detected over a region approximately . For comparison, we convolved the 12CO () data down to the same resolution as the JCMT data () and re-gridded the datasets to a common grid; the two datasets appeared consistent over their overlap region.
We measure the 12CO ()/12CO () line ratio at the centre of NGC 5218 (RA , Dec ) to be . This line ratio is similar to that found in Orion (Sakamoto et al., 1994) and is consistent with the presence of giant molecular clouds that have a kinetic temperature, K and density, cm-3. This ratio is similar to that observed by Braine & Combes (1992) in the centre of normal spiral galaxies (). The indication of a normal molecular gas environment at the centre of NGC 5218 is corroborated by the 13CO ()/12CO () line ratio of (Aalto et al., 1991), which is comparable to the value observed in our Galaxy when averaged over the inner 300 pc.
3.4 The relative gas content of NGC 5218
The 12CO () data for NGC 5218 give a molecular gas mass of M⊙ (see Section 3.3). The mass of atomic gas still bound to the late-type system is M⊙, while the total atomic gas mass associated with the Arp 104 system is M⊙ (see Section 3.2).
Allowing for differences in the H2-to-CO conversion factor, we compare the molecular-to-atomic gas ratio of NGC 5218 to galaxies in the literature. Including all the atomic gas associated with the extended tidal features in NGC 5218, we obtain a molecular-to-atomic ratio, in terms of of 0.40, which is significantly larger than that observed in both normal (, from (Casoli et al., 1990), and from (Bettoni et al., 2003)) an peculiar SBb systems (, (Casasola, Bettoni & Galletta, 2004)). All mean ratios quoted in the literature indicate SBb systems have less molecular gas than atomic gas; in contrast, NGC 5218 appears to have at least twice as much molecular than atomic gas.
3.5 The dynamics of the interaction
The spatial extent of Arp 104’s tidal tails can be used to make an approximate estimate the timescale of the interaction. The semi-circular tail extending to the north of NGC 5218 is , which corresponds to a physical distance of kpc, whereas the tidal bridge to the south is , or approximately 60 kpc in extent. The two tidal extensions have comparable lengths, indicative of similar formation timescales. If we assume that the atomic gas associated with NGC 5218 was not accelerated during the encounter, then the velocities of the gas will be comparable to those prior to the interaction. The velocity of the atomic gas that has travelled approximately 70 kpc to the tip of the tidal tails can then be estimated from the rotational velocity of the system and the orbital velocity of the galaxy, , where is the rotational velocity of the galaxy from which the tidal tail originated and is the relative radial velocity of the two interacting galaxies. The interaction between NGC 5218 and NGC 5216 appears to be largely in the plane of the sky; the galaxies have very similar systemic velocities so we assume a relative radial velocity of zero. We estimate the rotational velocity of NGC 5218 to be (corrected for inclination). The spatial extent of the tidal tail and the estimated velocity of the gas imply a time since perigalacticon of approximately yr.
As a further probe of the dynamical evolution of the Arp 104 interaction we have modelled the observed H i distribution using collisionless -body simulations which provide a better constraint on the dynamics. Our observational data place some immediate constraints on the simulations, including: the absolute masses of the galaxies involved and their mass ratio; the relative velocity difference of the line of sight velocities; the relative orientation of the galaxies; the physical separation of the galaxies and the length and orientation of the tidal tails.
Dynamical, -band and -band mass estimates for NGC 5218 and 5216, where appropriate, are given in Table 1. For the dynamical mass estimate of NGC 5218 a spherical mass distribution and inclination angle of (taken from the HyperLeda database222see: http://leda.univ-lyon1.fr/) were assumed. The -band mass estimates used a solar absolute -band magnitude of 5.46 and assumed a mass-to-light ratio of 4 (Roberts & Haynes, 1994) for the late-type system and between 6 (van der Marel, 1991) and 10 (Faber & Gallagher, 1979) for early-type system. The -band mass estimates assume a stellar -band absolute magnitude of 3.32 and adopt a mass-to-light ratio of for both the early and late-type systems (Bell et al., 2003). Both the -band and -band estimates are from the total emission magnitudes of the galaxies. Whilst these mass estimates are subject to a large degree of uncertainty, they nonetheless provide a useful starting point for simulations of this system.
Using these constraints a series of -body simulations were run using an in-house tree code (Clemens et al., 1999). Preliminary, restricted -body simulations were used to explore the parameter space. Simulations started with zero energy (parabolic) orbits. The restricted -body simulations allowed exploration of a range of possible perigalactic separations. Having established a parameter range within which simulations produced tidal features that were a good representation of those observed, further, self-consistent simulations were run to confirm the validity of the selected parameters. The criteria for the ‘best-fit’ model was a simulated mass distribution in which the projected separation of the galaxy pair was a good match to that observed and the morphology and velocity profile of the simulated galaxies most closely matched that of the H i distribution.
The self-consistent -body simulations of galactic systems used two types of collisionless particles to simulate the stellar and dark matter; we ignore hydrodynamical effects in the formation of the tidal tails. Initial conditions for the simulated late-type galaxies are determined by a technique developed by Hernquist (1993). Each late-type galaxy consists of a dark matter halo, a central stellar bulge, and a rotating disk. The particles are then positioned, following a spatial density profile modelled on observed profiles. The halo, disk and bulge components were assigned the mass ratio , the halo and bulge components we each composed of 16384 particles, whilst the disk component contained 32768 particles. The early-type system was simulated using the NEMO code (Teuben, 1995) to construct a Plummer model. In each case the model galaxies were evolved under gravity to confirm their stability prior to use in simulations.
| Galaxy | -band | -band | Dynamical |
| Mass Estimate | Mass Estimate | Mass Estimate | |
| (M⊙) | (M⊙) | (M⊙) | |
| NGC 5218 | |||
| NGC 5216 | – |
A series of simulations were run using models for an elliptical and spiral galaxy on zero energy (parabolic) or small positive energy (hyperbolic) orbits. A number of mass scalings were explored. These included, adoption of the -band mass estimates, adoption of the -band mass ratio but using the mass scale defined by the dynamical mass estimate for NGC 5218 and adoption of the dynamical mass estimate for NGC 5218 and the -band mass estimate for NGC 5216. The last of these combinations implied a mass ratio of the late to early-type galaxies of . These simulations produced short tidal tails, unlike those observed in the H i data. On the basis of this work we suggest that the mass ratio of the two galaxies is closer to , as implied by the -band mass ratio.
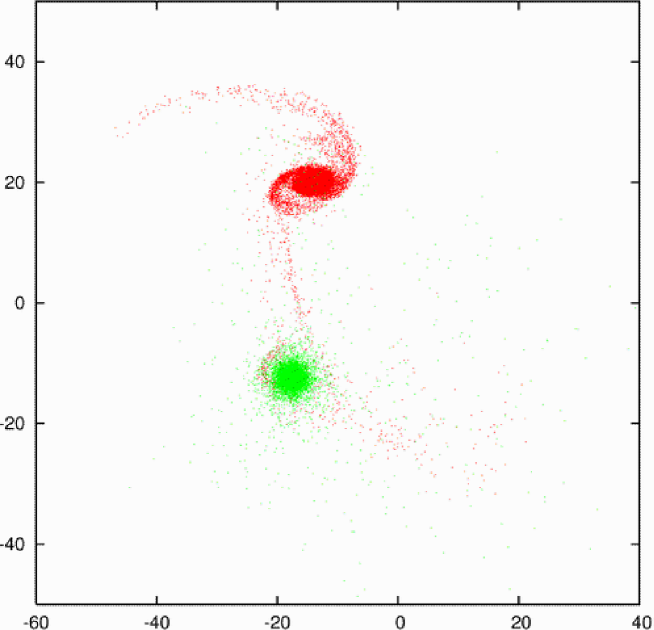
All the simulations run using a mass ratio for the late to early-type galaxies produced a tidal-tail morphology similar to that observed in the H i data. The results obtained appeared relatively robust. Several simulations were run, with an initial disk inclination of 0, 30, 60 and 90 degrees. The best-fit set of parameters were based on a parabolic interaction with a perigalactic separation of 12.5 kpc, using galaxies with a masses approximated using the -band mass-to-light ratio; the simulated data, for an initial disk inclination of 60 degrees, are shown in Fig. 8. The time from perigalacticon to the point at which the simulated data best represented the H i observations was time-steps, corresponding to a timescale of yr. This is in good agreement with the crude dynamical estimate derived above.
4 Analysis of the bar in NGC 5218
4.1 Rotation Curve
The first step in the analysis of the bar is to attain a rotation curve for NGC 5218. The rotation curve was established predominately using the VLA H i data. Using the channel maps (Fig. 2), spatial and velocity selection were use to isolate gas which is dynamically associated with NGC 5218, this corresponded to gas out to a radius of approximately 9 kpc. NGC 5218 contains a bright central radio continuum source and as a result H i in the nuclear region is seen in absorption, making it difficult to fit a rotation curve to the H i data in this region. However, in the central region our 12CO () observations provide a reliable estimate of the rotation curve. We therefore use H i data for radii beyond about 2.5 kpc and CO data within this radius. The 12CO () observations have the additional advantage that they are higher resolution than the H i data, reducing the problems of beam-smearing in the centre of the galaxy (Sofue et al., 1999).
Rotation curves for NGC 5218 were derived from the intensity-weighted velocity field of the H i and CO data using the AIPS task GAL. For both the H i and CO datasets we used the highest resolution images, so as to minimise the effect of beam smearing. For the H i data this corresponded to a spatial resolution , and for the CO data the resolution was . The rotation curves were derived using a tilted-ring model (Warner et al., 1973). This method approximates the galaxy as a set of concentric rings of gas at increasing radii, characterised by a circular velocity, position angle and inclination angle. Attempts to derive the rotation curve leaving the dynamic centre and inclination angle as free parameters yielded unphysical results. The dynamical centre was therefore calculated by performing a global rotation curve fit to H i datasets at three different resolutions for both Brandt and Exponential rotation curves independently. The dynamical centre was found to be stable across all fits and was therefore fixed for the purposes of the tilted-ring curve fitting. Optical data were used to fix the inclination angle which was taken from the Hyperleda database333See http://leda.univ-lyon1.fr/.
The H i rotation curve was fitted by breaking the galaxy into annuli in width (approximately the half-beam width) and fitting the velocity field in each annulus, keeping the dynamical centre and inclination angle fixed. Radii below in which the H i is seen predominately in absorption were excluded. A similar fit was performed on the molecular gas data, using the same fixed dynamical centre and inclination angle. For these higher resolution data annuli were used, and the data were fit from zero radius outwards. In Fig. 9 we plot the circular velocity , resulting from analysis. We fit a function to these data the differential of which was evaluated to allow computation of , the epicyclic frequency. In Fig. 10 we plot the angular velocity, and curves. The error bars on Figs 9 and 10 do not include any possible bias due to beam smearing.


4.2 The length of the bar and co-rotation
Science-grade images in , and were downloaded from the Two
Micron All Sky Survey (2MASS) archive444Available at
http://irsa.ipac.caltech.edu/applications/2MASS/LGA/. The , and
passbands are less sensitive to extinction by dust in the central
regions of the galaxies than shorter wavelengths, and offer a bar tracer that
is unlikely to be contaminated by recent star formation. We adopt the method of
Regan & Elmegreen (1997) – see also Martini et al. (2001); Sheth et al. (2002) and Sheth et al. (2003) for examples of this
technique – to estimate the length of the bar; this assumes the bar ends
correspond to the point of maximum ellipticity when fitting the galaxy
isophotes. The ellipticity of the 2MASS image isophotes, in the plane of the
sky, were fit using the IRAF STSDAS task ELLIPSE, which measures the surface
brightness, ellipticity and position angle of the semi-major axis.
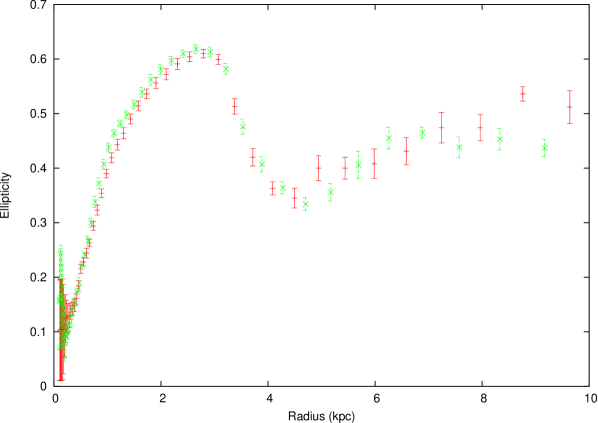
Figure 11 shows the ELLIPSE fitted ellipticities for both the
- and -band 2MASS images. Both images give very similar results; the
-band image indicates a maximum ellipticity of at a radius
of and the -band image a maximum ellipticity of at a radius of .
The bar’s de-projected length can then be obtained from the observed length using (Arnaboldi et al., 1995), where is the inclination angle of the galaxy () and is the angle the bar makes with galaxy’s major axis in the plane of the galaxy. To determine we take the position angle of the galaxy to be the average of position angles fitted to the H i data using the tilted-ring model in GAL and the position angle of the bar to be that obtained by the IRAF package ELLIPSE at maximum ellipticity. These angles are and respectively. Thus, the angle the bar makes with the major axis in the plane of the sky , and follows since , thus . These angles yield a very small correction factor in converting between the observed and de-projected bar length: , giving and . Assuming co-rotation is at (Athanassoula, 1992, 1994) yields a co-rotation radius of which corresponds to a physical radius of 3.4 kpc and gives and estimate of the pattern speed of the bar of 40 kpc-1, which is similar to that seen in other SB galaxies (e.g., Merrifield & Kuijken, 1995; Gerssen et al., 1999; Laine et al., 1998) and in our Galaxy (Dehnen, 1999). Examining the angular velocity obtained from the rotation curve fitting at a radius of 3.4 kpc we find the velocity is significantly larger than the peak value of the curve; this implies there is no inner Lindblad resonance in NGC 5218. We note that the calculated radius of co-rotation (3.4 kpc) is not dissimilar to the radius obtained by measuring distance between the molecular gas peaks toward the ends of the bar (3.9 kpc).
Constraints on the existence or not of an inner Lindblad resonance in NGC 5218 depend sensitively on and . As such they are subject to a large degree of uncertainty. In particular, the absence of an observed peak in the is symptomatic of a mass distribution which is not strongly centrally condensed; inner Lindblad resonances only develop if the mass distribution is sufficiently centrally peaked. It is well known that low resolution observations smooth out the steep central rise of rotation curves which results from the core and bulge of the galaxy (Sofue et al., 1999). It is possible that the limited resolution of our observations is making it difficult to detect the steeply rising rotation curve in the central region of NGC 5218 and as such yielding an artificially smooth curve.
4.3 Comparison of the H i and CO dynamics
Figure 9 shows the fitted circular velocities for both the H i and CO datasets. Around radii of approximately 3 kpc, where we have both atomic and molecular gas observations there is a clear deviation in the velocity structure of the two components. This is not unexpected. The fall in the angular velocity of the molecular gas around 3 kpc, in the region of the bar end may be a result of streaming motions within the bar. Gas on the elongated, so-called orbits in the bar (Athanassoula, 1994), has a rotational velocity at the apex of the ellipse, near the end of the bar, which is lower than that of gas on a circular orbits at the same radius, therefore its will be lower. By comparison, if the H i has a large scale height than the molecular gas, it is likely to have been less influenced by the bar in this region. We have also performed a more detailed comparison of the H i and CO dynamics by comparing the H i and 12CO () spectra at four locations across the disk. The spectra were extracted from data cubes at a common resolution of . In the central region the linewidths and lineshape of the spectra were very similar. In the more extended regions the molecular gas displays a broader linewidth than the H i. In particular, at the eastern end of the bar, the molecular gas displays a two-peaked profile with the atomic gas indicating emission in only one of these peaks.
5 Discussion and Conclusions
5.1 Enhanced central molecular gas
In Section 3.4 we showed that NGC 5218 has a large molecular gas mass for an SBb galaxy. The molecular gas distribution is strongly centrally concentrated with a peak surface density greater than 2000 M⊙ pc-2 (Section 3.3). Numerous numerical simulations predict that bars, whether spontaneously or externally triggered, can induce large scale gas inflow toward the central regions of galaxies (e.g., MH96; Noguchi, 1988; Barnes & Hernquist, 1991). Two recent observational studies have found strong evidence for this process; both Sakamoto et al. (1999a) and Sheth et al. (2005) have demonstrated that barred galaxies have a larger concentration of molecular gas in their central kiloparsec than unbarred systems. Sakamoto et al. (1999a) used the NRO–OVRO survey of 20 nearby spiral galaxies (see Sakamoto et al., 1999b) to show that the degree of concentration of molecular gas in the central kiloparsec of barred spiral galaxies is greater than in their unbarred counterparts. They quantify this effect using the ratio of the molecular gas surface density in the central kiloparsec to that over the entire optical disk (), finding this ratio is on average four times larger in barred than in unbarred systems. Sheth et al. (2005) studied a sample of 50 nearby spirals – including both late type barred and unbarred spirals, and CO-bright and CO-faint galaxies – and found the effect of the bar equally pronounced in late and early Hubble type spirals. Atomic gas observations also indicate higher gas column densities in barred galaxies. Risaliti, Maiolino & Salvati (1999) examined the atomic gas column density in front of Seyfert nuclei using X-ray measurements and found significantly higher column densities in Seyferts with barred hosts than those in the unbarred sample. To estimate for NGC 5218 we remade the channel maps at the highest possible spatial resolution (, kpc). Although beam smearing introduces uncertainty into our analysis, we find a 12CO () flux over the central kiloparsec in NGC 5218 which corresponds to a gas mass of M⊙. This is equivalent to a molecular hydrogen surface density of M⊙ pc-2 and a gas surface density of M⊙ pc-2. This is approximately six times the mean of the barred sample of Sheth et al. (2005) ( M⊙ pc-2). In addition, the data for NGC 5218 indicate an value of 113, almost twice the average of the BIMA sample () and slightly larger than the average of the NRO–OVRO sample (). The discrepancy between the two literature values can be attributed to the NRO–OVRO sample consisting mainly of CO-luminous galaxies. In contrast, the BIMA sample was selected on the basis of -band magnitude and thus represents, at least from the perspective of CO flux comparison, a less biased sample. The existence of the bar in NGC 5218 has led to a very large central molecular gas surface density, even within the context of barred galaxies. For comparison we note that typical mean densities of the largest molecular cloud complexes in M31, M33 and M51 are in the range M⊙ pc-2, whilst the gas surface density of a typical giant molecular cloud in the outer disk of the Milky Way is 200 M⊙ pc-2 (Scoville & Sanders, 1987).
The impact of the bar potential on the gas distribution in NGC 5218 is consistent with the bar’s ellipticity, which implies it is a strong bar. The ellipticity of a bar is thought to provide a good measure of the bar strength. Martin (1995) identify strong bars as those with an ellipticity greater than 0.4; the 2MASS -band data for NGC 5218 give a deprojected ellipticity for NGC 5218 of the bar of at least 0.4. Simulations by Regan & Teuben (2004) find that weak bars have almost no effect on the radial distribution of the ISM. In contrast, strong extended bars are likely to be more effective at driving gas toward the centre of the galaxy. Their simulations also indicate that bars are only able to drive gas inwards to a radius at which a ring forms; for bars containing inner rings, little net inflow takes place inside this radius. Nuclear rings are likely to form when so-called orbits exist; such orbits require the presence of two inner Lindblad resonances. Our very high central gas densities are consistent with no inner ring and no inner Lindblad resonances as our analysis of the bar dynamics suggests.
5.2 CO-to-H2 conversion factor
The molecular gas mass in NGC 5218 and the resulting gas column densities are calculated using the CO-to-H2 conversion factor, cm-2 K km s-1 (Bloemen et al., 1986), which is appropriate for molecular gas clouds in the Milky Way (Sanders et al., 1984). In adopting this conversion factor we assume that the conditions of the molecular gas clouds in NGC 5218 are similar to the molecular gas clouds in the Milky Way. This is an assumption, and it is possible that the CO emissivity in this system is enhanced due to high pressures and/or velocity dispersion in the bulge region (Regan et al., 2001). However, the observation of a 13CO ()/12CO () line ratio of (Aalto et al., 1991) in NGC 5218, which is comparable to the value observed in the Milky Way when averaged over 300 pc, lends weight to the adoption of the Milky Way conversion factor.
Although the molecular gas distribution in NGC 5218 is centrally concentrated, there is also evidence of more extended emission (see Fig. 5). In particular, the 12CO () integrated emission indicates two molecular gas condensations slightly offset from the bar ends. The radius of these gas peaks (3.9 kpc) is similar to the calculated radius of co-rotation (3.4 kpc), see Section 4.2. The presence of these gas complexes, like that of the large central peak, can be attributed to the existence of a barred potential. Gas concentrations at bar ends have been observed in a number of galaxies (e.g., Kenney & Lord, 1991; Downes et al., 1996; Sheth et al., 2000, 2002). These concentrations may be stagnation points in the gas flow; gas on orbits at the bar ends will have a smaller angular velocity than more central gas due to its larger radius. Their presence may also be due to the convergence of gas on elliptical orbits in the bar with gas on more circular orbits in the region just beyond the bar (Kenney & Lord, 1991); these gas complexes are located in a transition region between the spiral arms and bar ends. Although the bar in NGC 5218 appears to have contributed to a central concentration of gas, this process appears to be ongoing.
We now consider the origin of NGC 5218’s high molecular gas mass. In Section 3.4 we showed that NGC 5218 has a comparatively low H i mass. The bar may have led predominately to the transport of existing molecular material from the disk to the centre of NGC 5218, or this transport could have involved both atomic and molecular gas with subsequent conversion of atomic to molecular gas in the central region. Davoust & Contini (2004) studied the effects of bars on the neutral hydrogen content of starburst and Seyfert galaxies and found that the barred galaxies had a lower total H i mass than unbarred galaxies. They suggest that atomic gas is funnelled toward the centre of barred galaxies where it is then converted to molecular gas. In Section 3.2 we used H i absorption observations to estimate the atomic gas column density in the centre of NGC 5218 to be cm-2. Various studies indicate a ‘transition’ column density at which H i is sufficiently dense for self-shielding to allow the formation of H2 of cm-2, increasing to cm-2 for large molecular clouds (Savage et al., 1977; Federman, Glassgold & Kwan, 1979; Franco & Cox, 1986; Reach, Koo & Heiles, 1994). The H i column density observed at the centre of NGC 5218 lies above these values so H i to H2 conversion may be taking place at the centre of NGC 5218. The high H2 to H i ratio in the centre of NGC 5218 and the dynamical consistency of the two components in the central region (see Section 4.3) is certainly consistent with inflow of both components and efficient H i to H2 conversion.
5.3 Star formation
In Section 3.1 we estimated the SFR of NGC 5218 using both radio and FIR data; these data yield SFRs of 3.4 and 5.3 M⊙ yr-1 respectively. A large proportion of the star formation is taking place in the dusty central region of NGC 5218 (see below) where we observe a very large molecular gas density. However, both the radio and FIR provide largely extinction-free probes of the star formation and as such should yield robust estimates of the SFR. Comparison of the NVSS () flux density ( mJy) and the FIRST (Becker, White & Helfand, 1994) () flux density ( mJy) suggests at least 75% of the galaxy’s star formation is coming from the central kiloparsec region.
Before discussing the star-formation properties of NGC 5218 we note a potential caveat with the estimation of the SFR of this system. A number of authors have examined the optical spectroscopy of NGC 5218 for AGN activity. On the basis of their investigation Ashby, Houck & Matthews (1995) conclude the emission line properties of NGC 5218 are ambiguous, and Veilleux et al. (1995) classify it as a LINER. NGC 5218 sits comfortably on the radio-FIR correlation (Yun, Reddy & Condon, 2001) with no obvious radio or FIR excess; the two SFR estimators yield very similar results (Section 3.1). In addition, recent work by Dudik et al. (2005) suggests that in their sample of IR-bright LINERS the low X-ray luminosities and Eddington ratios imply the contribution from the AGN to the FIR luminosity is likely to be small. However, we cannot exclude the possibility that nuclear activity in this system leads to an overestimated FIR SFR.
5.3.1 Is the level of star formation large?
NGC 5218 appears to have a substantial star formation rate. The 60-m luminosity of NGC 5218, L⊙, is more than three times the median for Sb–Sbc galaxies found by Devereux & Hameed (1997), although it does not qualify it as Luminous Infrared Galaxy (LIRG). NGC 5218’s -band normalised SFR, an approximation of star formation per unit mass, implies a slightly enhanced value (Devereux & Hameed, 1997). The mean value of obtained by Devereux & Hameed (1997) for Sb–Sbc galaxies was , whereas the value for NGC 5218 is , consistent with a high current SFR in relation to its recent star formation history (although it may also reflect, to some extent, increased gas and therefore dust in its centre).
The star-formation efficiency (SFE) is the ratio of the current star-formation rate to the mass of molecular gas: for NGC 5218 the SFE derived from the FIR star formation rate and total molecular gas mass is yr-1. This value, whilst larger than the average for Sb galaxies (Murgia et al., 2002), is still significantly below the over yr found in starburst systems (Kennicutt, 1998). Despite NGC 5218’s relatively high star-formation rate, its global star-formation efficiency appears to be more in keeping with that of a normal Sb galaxy than a starburst system. The star formation efficiency of the central kpc is approximately three times the global value, falling toward the lower end of those systems classified as nuclear starbursts Planesas, Colina & Perez-Olea (1997)
Sakamoto et al. (1999a) have investigated the gas-to-dynamical mass ratio in the central kiloparsec of a sample of 20 nearby spiral galaxies. They observe a larger ratio in galaxies with an H ii spectral classification, and interpret this as evidence for more active star formation and nuclear spectra dominated by H ii regions in galaxies which have large amounts of gas given their size. They suggest that the effect may be related to the stability of the nuclear molecular gas disk, relating to the Toomre parameter (Toomre, 1964). For comparison with these data we use the highest resolution CO data set for NGC 5218 to examine the gas-to-dynamical mass ratio in central kiloparsec. We integrate the flux obtained in the central molecular gas peak and compare the mass obtained with an estimate of the dynamical mass in this region. We select a physical region with a radius of kpc, larger than the region ( pc) examined by Sakamoto et al. (1999a) because we can make a more robust estimate of on this scale given our available data. The region examined lies well within the physical extent of the bar; the molecular gas dynamics in this region are dominated by circular motion (Fig. 6). Assuming Keplerian rotation and a spherical mass distribution, the dynamical mass is
where is the rotational velocity in the plane of the disk at a radius . The 20% linewidth over the 1.1 kpc radius region is 280 . Correcting for the inclination of the galaxy yields a rotational velocity in the plane of the disk of 184 , corresponding to a dynamical mass of M⊙. Integrating the CO flux observed over this area yields a molecular hydrogen mass of M⊙ and a molecular gas mass of M⊙. The molecular gas mass fraction over the central 1.1 kpc radius region in NGC 5218 is 26%, above the value obtained by Sakamoto et al. (1999a) for H ii dominated systems ( over the central kiloparsec). If we reduce the physical scale over which we undertake the comparison, the mass fraction increases dramatically. Our data imply that the gas-to-dynamical mass ratio over the central region of NGC 5218 is large when compared with actively star forming H ii systems in the Sakamoto et al. sample.
We note that the derived is only related to the Toomre parameter and the central gas stability if the gas is in the form of a nuclear disk. Bar-streaming motions introduce inherent uncertainty into the use of the ratio as a probe of the stability. In addition, many theorists are sceptical about using the Toomre parameter as a measure of instability toward star formation, arguing that feedback from such star formation would lower the parameter on short timescales (e.g., Combes 2001, see also Koda et al. 2005). Nonetheless, the results of Sakamoto et al. (1999a) indicate that all except one of the H ii galaxies in their sample have an greater than 0.1 and we believe comparison with these observations is useful.
5.4 Bar formation in NGC 5218
Both simulation-based and observational evidence exists linking tidal perturbations with the triggering of bars. In particular, observations in the literature point to bars in early-type galaxies, of which NGC 5218 is an example, being produced in this way. This result is supported by simulations which indicate that a bulge component acts to stabilise the galaxy against spontaneous bar formation, an increasingly massive bulge offering increased stability (MH96). It may be that for galaxies with bulges an external trigger is a prerequisite for a bar to form. To investigate any link between the bar in NGC 5218 and its tidal interaction, we look in more detail at the nature of the bar, undertaking comparisons with both simulation-based and observational data.
Simulations suggest that interactions can affect bar formation in galaxies in a number of different ways: they can trigger bar formation in an otherwise stable galaxy; speed up the process of bar formation in a system which is already unstable (Gerin et al., 1990); regenerate a dissolved or weakened bar (Berentzen et al., 2004) and enhance or decrease the strength of an existing bar (Gerin et al., 1990). All such scenarios are possible in NGC 5218, although the strength of the bar, as measured from the axial ratio, would imply that the tidal encounter is unlikely to have significantly weakened the bar.
In an investigation of the blue and near-infrared surface photometry of 15 barred spirals, Elmegreen & Elmegreen (1985) observed two different types of major axis surface density profiles, exponential and flat. On the basis of their simulations, Noguchi (1996) argue that exponential profiles are found in spontaneously produced bars, whilst flatter profiles occur in bars produced by tidal instability. Unfortunately the photometric data available for NGC 5218 are not of sufficiently high resolution to confidently discern between the two profiles; the large central peak observed in all bars yields a profile that appears exponential when smoothed to lower resolution. Nonetheless, the SDSS -band light profile indicates some flattening and a flattened profile is certainly possible. In Noguchi’s interpretation, this implies the bar profile is consistent with a bar produced by tidal perturbation. Recent work by Berentzen et al. (2004) has questioned this interpretation, arguing that the results of Athanassoula & Misiriotis (2002) indicate that both profiles occur in isolated systems and that the different profiles are associated with varying bar strengths rather than the triggering mechanism, flatter profiles being produced in stronger bars.
Our analysis of NGC 5218 gave an estimated pattern speed for the bar of kpc-1. Studies by Miwa & Noguchi (1998) show that in weak tidal perturbations the properties of the bar depend largely on the internal structure of the host galaxy, rather than the speed of the perturber (see also simulations by Gerin et al. 1990). However, for stronger tidal perturbations the pattern speed is dependent on the perturber mass (see also Berentzen et al. 2004). Miwa & Noguchi argue that for the strongest perturbations tidally induced bars can rotate slowly with an inner Lindblad resonance near the bar ends, whereas bars produced by weaker perturbations have no inner-Lindblad resonances, rotate more rapidly, and end near co-rotation. In the case of NGC 5218 we inferred that there are no inner-Lindblad resonances, and that if the bar-ends are co-rotating its angular velocity is kpc-1. However, since the curve provides a relatively constant resonance throughout the galactic radii at a velocity of 10 kpc-1, we cannot exclude the possibility that the bar in NGC 5218 is rotating at this, much slower velocity, and ending before co-rotation.
A number of investigations of tidal triggering of bar formation have looked at the relationship between strength of interaction and bar formation (Miwa & Noguchi, 1998; Berentzen et al., 2004). Quantitative comparison between these simulations and our results is difficult since many of the results are sensitive to the mass concentration of the disk and the disk-to-halo mass fraction which are difficult to constrain observationally. Nonetheless, we can make some important observations about this system. Given the apparently low mass ratio of NGC 5216 to NGC 5218 ( using -band data, Section 3.5), the perigalactic separation required to produce a tidal perturbation of sufficient strength to induce bar formation is likely to be small. The necessity of a small perigalactic separation is consistent with the simulations, which indicate that production of the extended tidal features observed in the H i distribution require a small perigalactic separation.
The gas surface density in the central kiloparsec of NGC 5218 (1300 M⊙ pc-2) is significantly larger than the mean of both the unbarred ( M⊙ pc-2) and barred sample ( M⊙ pc-2) of Sheth (2001). The enhanced surface density observed in NGC 5218 can be accounted for by an additional molecular gas mass of the order of M⊙. Estimates of gas inflow rates in barred galaxies vary widely ( M⊙ yr-1, Friedli & Benz, 1993; Quillen et al., 1995; Laine et al., 1998; Regan et al., 1997; Sakamoto et al., 1999a; Iono et al., 2004); adopting the value inferred by Quillen et al. (1995) of M⊙ yr-1 via calculation of the torques on the molecular gas using near-IR images, we find the time taken to produce the observed enhanced central gas density in NGC 5218 is similar to the time since perigalacticon. However, it must be remembered the inflow rate is not certain, and may vary with time.
5.5 Conclusions
NGC 5218 is a barred interacting spiral galaxy which has undergone a prograde encounter with an elliptical, NGC 5216, sometime in the recent past. Both the H i velocity field and the simulations indicate the timescale since perigalacticon is of the order of yr. NGC 5218 has a very large central molecular gas surface density when compared to the molecular gas surface density in the central kiloparsec of the BIMA sample of unbarred galaxies (Sheth, 2001). The difference can be accounted for if we assume gas inflow to the central region over the time since perigalacticon and at a rate comparable to those inferred in other systems (e.g., Quillen et al., 1995). Our observations are consistent with the interaction of NGC 5218 with NGC 5216 triggering an instability in the galactic potential or enhancing an existing instability that has led to gas inflow yielding a central molecular gas density at the elevated level observed.
The nature of the bar, molecular gas and dynamical time scales we infer for NGC 5218 are very similar to those in UGC 2855, as discussed by Hüttemeister, Aalto & Wall (1999). This interacting galaxy also has a high central gas concentration with no evidence for any inner Lindblad resonance or shocking of the molecular gas. Hüttemeister et al. deduce that the bar is very young and the system is in a pre-starburst phase.
NGC 5218 has a relatively large SFR (Section 5.3) It has a normal disk-wide star-formation efficiency although the nuclear region has a star-formation efficiency toward the lower end of starburst nuclei. It is possible that NGC 5218 is in the early stages of bar-driven evolution and has not yet reached its period of most active star formation. Whilst the bar in NGC 5218 appears to have contributed to large central molecular gas density there is still a significant fraction of the molecular material found in the more extended regions of this system. The process of gas transfer toward the central region of NGC 5218 is clearly ongoing. The molecular gas density in the centre of NGC 5218 may not yet be sufficiently large to have triggered a starburst phase. We suggest that NGC 5218 is likely to undergo a period of more enhanced star formation in the near future. This proposition is supported by the following evidence.
-
•
The large concentration of molecular gas and very high surface density in the central region of NGC 5218.
-
•
A sizable, extended molecular gas component which indicates that the process of gas transfer to the central region is ongoing.
-
•
NGC 5218’s large FIR-luminosity and SFR when compared with other galaxies of the same Hubble type.
-
•
The large ratio, indicating that the current-to-recent star formation in NGC 5218 is larger than an average early-type spiral.
-
•
The large ratio in the centre of NGC 5218 implying a large quantity of gas in this region given its size. This may be indicative of instability toward star formation.
Acknowledgements
The James Clerk Maxwell Telescope is operated by The Joint Astronomy Centre on behalf of the Particle Physics and Astronomy Research Council of the United Kingdom, the Netherlands Organisation for Scientific Research, and the National Research Council of Canada. We thank the staff of the GMRT that made these observations possible. The GMRT is run by the National Centre for Radio Astrophysics of the Tata Institute of Fundamental Research. The National Radio Astronomy Observatory is a facility of the National Science Foundation operated under cooperative agreement by Associated Universities, Inc. We thank the staff of the OVRO interferometer. This research has made use of the NASA/IPAC Extragalactic Database (NED) which is operated by the Jet Propulsion Laboratory, California Institute of Technology, under contract with the National Aeronautics and Space Administration. Funding for the SDSS and SDSS-II has been provided by the Alfred P. Sloan Foundation, the Participating Institutions, the National Science Foundation, the U.S. Department of Energy, the National Aeronautics and Space Administration, the Japanese Monbukagakusho, the Max Planck Society, and the Higher Education Funding Council for England. The SDSS Web Site is http://www.sdss.org/. The SDSS is managed by the Astrophysical Research Consortium for the Participating Institutions. The Participating Institutions are the American Museum of Natural History, Astrophysical Institute Potsdam, University of Basel, Cambridge University, Case Western Reserve University, University of Chicago, Drexel University, Fermilab, the Institute for Advanced Study, the Japan Participation Group, Johns Hopkins University, the Joint Institute for Nuclear Astrophysics, the Kavli Institute for Particle Astrophysics and Cosmology, the Korean Scientist Group, the Chinese Academy of Sciences (LAMOST), Los Alamos National Laboratory, the Max-Planck-Institute for Astronomy (MPIA), the Max-Planck-Institute for Astrophysics (MPA), New Mexico State University, Ohio State University, University of Pittsburgh, University of Portsmouth, Princeton University, the United States Naval Observatory, and the University of Washington. The Digitized Sky Surveys were produced at the Space Telescope Science Institute under U.S. Government grant NAG W-2166. The images of these surveys are based on photographic data obtained using the Oschin Schmidt Telescope on Palomar Mountain and the UK Schmidt Telescope. The plates were processed into the present compressed digital form with the permission of these institutions. The Second Palomar Observatory Sky Survey (POSS-II) was made by the California Institute of Technology with funds from the National Science Foundation, the National Geographic Society, the Sloan Foundation, the Samuel Oschin Foundation, and the Eastman Kodak Corporation. This publication makes use of data products from the Two Micron All Sky Survey, which is a joint project of the University of Massachusetts and the Infrared Processing and Analysis Center/California Institute of Technology, funded by the National Aeronautics and Space Administration and the National Science Foundation. HC acknowledges receipt of a PPARC studentship.
References
- Aalto et al. (1991) Aalto S., Johansson L. E. B., Booth R. S., Black J. H., 1991, A&A, 249, 323
- Allen (1973) Allen C. W., 1973, Astrophysical Quantities, Athlone Press
- Arnaboldi et al. (1995) Arnaboldi M., Capaccioli M., Cappellaro E., Held E. V., Koribalski B., 1995, AJ, 110, 199
- Ashby et al. (1995) Ashby M. L. N., Houck J. R., Matthews K., 1995, ApJ, 447, 545
- Athanassoula (1992) Athanassoula E., 1992, MNRAS, 259, 345
- Athanassoula (1994) Athanassoula E., 1994, in Shlosman I., ed., Mass-Transfer Induced Activity in Galaxies, Cambridge University Press, p. 143
- Athanassoula & Misiriotis (2002) Athanassoula E., Misiriotis A., 2002, MNRAS, 330, 35
- Athanassoula & Sellwood (1986) Athanassoula E., Sellwood J. A., 1986, MNRAS, 221, 213
- Barnes & Hernquist (1991) Barnes J. E., Hernquist L. E., 1991, ApJ, 370, L65
- Becker et al. (1994) Becker R. H., White R. L., Helfand D. J., 1994, in Crabtree D. R., Hanisch R. J., Barnes J., eds, ASP Conf. Series 61, Astronomical Data Analysis Software and Systems III, p. 165
- Bell (2003) Bell E. F., 2003, ApJ, 586, 794
- Bell et al. (2003) Bell E. F., McIntosh D. H., Katz N., Weinberg M. D., 2003, ApJS, 149, 289
- Berentzen et al. (2004) Berentzen I., Athanassoula E., Heller C. H., Fricke K. J., 2004, MNRAS, 347, 220
- Bettoni et al. (2003) Bettoni D., Galletta G., García-Burillo S., 2003, A&A, 405, 5
- Bloemen et al. (1986) Bloemen J. B. G. M., Strong A. W., Mayer-Hasselwander H. A., Blitz L., Cohen R. S., Dame T. M., Grabelsky D. A., Thaddeus P., Hermsen W., Lebrun F., 1986, A&A, 154, 25
- Braine & Combes (1992) Braine J., Combes F., 1992, A&A, 264, 433
- Cao et al. (1997) Cao Y., Terebey S., Prince T. A., Beichman C. A., 1997, ApJS, 111, 387
- Casasola, Bettoni & Galletta (2004) Casasola V., Bettoni D., Galletta G., 2004, A&A, 422, 941
- Casoli et al. (1990) Casoli F., Clausset F., Combes F., Viallefond F., Boulanger F., 1990, A&A, 233, 357
- Clemens et al. (1999) Clemens M. S., Baxter K. M., Alexander P., Green D. A., 1999, MNRAS, 308, 364
- Combes (2001) Combes F., 2001, in Knapen J. H., Beckman J. E., Shlosman I., Mahoney T. J., eds, ASP Conf. Series 249, The Central Kiloparsec of Starbursts and AGN: The La Palma Connection, p. 475
- Condon (1992) Condon J. J., 1992, ARA&A, 30, 575
- Condon et al. (1998) Condon J. J., Cotton W. D., Greisen E. W., Yin Q. F., Perley R. A., Taylor G. B., Broderick J. J., 1998, AJ, 115, 1693
- Cullen & Alexander (2005) Cullen H., Alexander P., 2005, in Wilson, A., ed., ESA SP-577, The Dusty and Molecular Universe: A Prelude to Herschel and ALMA, p. 353
- Cullen, Alexander & Clemens (2003) Cullen H., Alexander P., Clemens M., 2003, Ap&SS, 284, 503
- Cullen, Alexander & Clemens (2006) Cullen H., Alexander P., Clemens M., 2006, MNRAS, 366, 49
- Davoust & Contini (2004) Davoust E., Contini T., 2004, A&A, 416, 515
- Dehnen (1999) Dehnen W., 1999, ApJ, 524, L35
- Devereux & Hameed (1997) Devereux N. A., Hameed S., 1997, AJ, 113, 599
- Downes et al. (1996) Downes D., Reynaud D., Solomon P. M., Radford S. J. E., 1996, ApJ, 461, 186
- Dudik et al. (2005) Dudik R. P., Satyapal S., Gliozzi M., Sambruna R. M., 2005, ApJ, 620, 113
- Elmegreen & Elmegreen (1985) Elmegreen B. G., Elmegreen D. M., 1985, ApJ, 288, 438
- Elmegreen et al. (1990) Elmegreen D. M., Elmegreen B. G., Bellin A. D., 1990, ApJ, 364, 415
- Eskridge et al. (2000) Eskridge P. B., Frogel J. A., Pogge R. W., Quillen A. C., Davies R. L., DePoy D. L., Houdashelt M. L., Kuchinski L. E., Ramírez S. V., Sellgren K., Terndrup D. M., Tiede G. P., 2000, AJ, 119, 536
- Faber & Gallagher (1979) Faber S. M., Gallagher J. S., 1979, ARA&A, 17, 135
- Federman, Glassgold & Kwan (1979) Federman S. R., Glassgold A. E., Kwan J., 1979, ApJ, 227, 466
- Franco & Cox (1986) Franco J., Cox D. P., 1986, PASP, 98, 1076
- Friedli & Benz (1993) Friedli D., Benz W., 1993, A&A, 268, 65
- Gerin et al. (1990) Gerin M., Combes F., Athanassoula E., 1990, A&A, 230, 37
- Gerssen et al. (1999) Gerssen J., Kuijken K., Merrifield M. R., 1999, MNRAS, 306, 926
- Hawarden et al. (1986) Hawarden T. G., Mountain C. M., Leggett S. K., Puxley P. J., 1986, MNRAS, 221, 41P
- Helou et al. (1988) Helou G., Khan I. R., Malek L., Boehmer L., 1988, ApJS, 68, 151
- Hernquist (1993) Hernquist L., 1993, ApJS, 86, 389
- Hibbard & van Gorkom (1996) Hibbard J. E., van Gorkom J. H., 1996, AJ, 111, 655
- Ho et al. (1997) Ho L. C., Filippenko A. V., Sargent W. L. W., 1997, ApJ, 487, 591
- Huang et al. (1996) Huang J. H., Gu Q. S., Su H. J., Hawarden T. G., Liao X. H., Wu G. X., 1996, A&A, 313, 13
- Hunt & Malkan (1999) Hunt L. K., Malkan M. A., 1999, ApJ, 516, 660
- Hüttemeister, Aalto & Wall (1999) Hüttemeister S., Aalto S., Wall W. F., 1999, A&A, 346, 45
- Iono et al. (2004) Iono D., Yun M. S., Mihos J. C., 2004, ApJ, 616, 199
- Keel et al. (1996) Keel W. C., Byrd C. C., Klaric M., 1996, in Buta R., Crocker D. A., Elmegreen B. G., eds, ASP Conf. Series 91, Barred Galaxies, p. 360
- Kenney & Lord (1991) Kenney J. D. P., Lord S. D., 1991, ApJ, 381, 118
- Kennicutt (1994) Kennicutt R. C., 1994, in Shlosman I., ed., Mass-Transfer Induced Activity in Galaxies, Cambridge University Press, p. 131
- Kennicutt (1998) Kennicutt R. C., 1998, ARA&A, 36, 189
- Koda et al. (2005) Koda J., Okuda T., Nakanishi K., Kohno K., Ishizuki S., Kuno N., Okumura S. K., 2005, A&A, 431, 887
- Laine et al. (1998) Laine S., Shlosman I., Heller C. H., 1998, MNRAS, 297, 1052
- Martin (1995) Martin P., 1995, AJ, 109, 2428
- Martini et al. (2001) Martini P., Pogge R. W., Ravindranath S., An J. H., 2001, ApJ, 562, 139
- Menendez-Delmestre et al. (2004) Menendez-Delmestre K., Sheth K., Scoville N. Z., Jarrett T., Schinnerer E., Regan M., 2004, American Astronomical Society Meeting Abstracts 205, #61.02
- Merrifield & Kuijken (1995) Merrifield M. R., Kuijken K., 1995, MNRAS, 274, 933
- Mihos (1994) Mihos J. C., 1994, in Shlosman I., ed., Mass-Transfer Induced Activity in Galaxies, Cambridge University Press, p. 372
- Mihos & Hernquist (1996) Mihos J. C., Hernquist L., 1996, ApJ, 464, 641
- Miwa & Noguchi (1998) Miwa T., Noguchi M., 1998, ApJ, 499, 149
- Murgia et al. (2002) Murgia M., Crapsi A., Moscadelli L., Gregorini L., 2002, A&A, 385, 412
- Noguchi (1987) Noguchi M., 1987, MNRAS, 228, 635
- Noguchi (1988) Noguchi M., 1988, A&A, 203, 259
- Noguchi (1996) Noguchi M., 1996, ApJ, 469, 605
- Olsson et al. (2004) Olsson E., Aalto S., Thommasson M., Hüttemeister S., 2004, in Aalto S., Hüttemeister S., Pedlar A., eds, ASP Conf. Series 320, The Neutral ISM in Starburst Galaxies, p. 162
- Perault (1987) Perault M., 1987, Ph.D. Thesis, University of Paris
- Phillips (1996) Phillips A. C., 1996, in Buta, R., Crocker, D. A., Elmegreen, B. G., eds, ASP Conf. Series 91, Barred Galaxies, p. 44
- Planesas et al. (1997) Planesas P., Colina L., Perez-Olea D., 1997, A&A, 325, 81
- Quillen et al. (1995) Quillen A. C., Frogel J. A., Kenney J. D. P., Pogge R. W., Depoy D. L., 1995, ApJ, 441, 549
- Rao (2002) Rao A. P., 2002, in Pramesh Rao A., Swarup G., Gopal-Krishna, eds, IAU Symposium 199, The Universe at Low Radio Frequencies, ASP, San Francisco, p. 439
- Reach, Koo & Heiles (1994) Reach W. T., Koo B., Heiles C., 1994, ApJ, 429, 672
- Regan & Elmegreen (1997) Regan M. W., Elmegreen D. M., 1997, AJ, 114, 965
- Regan & Teuben (2004) Regan M. W., Teuben P. J., 2004, ApJ, 600, 595
- Regan et al. (2001) Regan M. W., Thornley M. D., Helfer T. T., Sheth K., Wong T., Vogel S. N., Blitz L., Bock D. C.-J., 2001, ApJ, 561, 218
- Regan et al. (1997) Regan M. W., Vogel S. N., Teuben P. J., 1997, ApJ, 482, L143
- Risaliti et al. (1999) Risaliti G., Maiolino R., Salvati M., 1999, ApJ, 522, 157
- Roberts & Haynes (1994) Roberts M. S., Haynes M. P., 1994, ARA&A, 32, 115
- Sakamoto et al. (1999a) Sakamoto K., Okumura S. K., Ishizuki S., Scoville N. Z., 1999a, ApJ, 525, 691
- Sakamoto et al. (1999b) Sakamoto K., Okumura S. K., Ishizuki S., Scoville N. Z., 1999b, ApJS, 124, 403
- Sakamoto et al. (1994) Sakamoto S., Hayashi M., Hasegawa T., Handa T., Oka T., 1994, ApJ, 425, 641
- Sanders et al. (1984) Sanders D. B., Solomon P. M., Scoville N. Z., 1984, ApJ, 276, 182
- Sault et al. (1995) Sault R. J., Teuben P. J., Wright M. C. H., 1995, in Shaw R. A., Payne H. E, Hayes J. J. E., eds, ASP Conf. Series 77, Astronomical Data Analysis Software and Systems IV, p. 433
- Savage et al. (1977) Savage B. D., Drake J. F., Budich W., Bohlin R. C., 1977, ApJ, 216, 291
- Schombert et al. (1990) Schombert J. M., Wallin J. F., Struck-Marcell C., 1990, AJ, 99, 497
- Scoville & Sanders (1987) Scoville N. Z., Sanders D. B., 1987, in Interstellar Processes, D. Reidel, Dordrecht. p. 21
- Sheth et al. (2000) Sheth K., Regan M. W., Vogel S. N., Teuben P. J., 2000, ApJ, 532, 221
- Sheth (2001) Sheth K., 2001, in Knapen J. H., Beckman J. E., Shlosman I., Mahoney T. J., eds, ASP Conf. Series 249, The Central Kiloparsec of Starbursts and AGN: The La Palma Connection, p. 605
- Sheth et al. (2002) Sheth K., Vogel S. N., Regan M. W., Teuben P. J., Harris A. I., Thornley M. D., 2002, AJ, 124, 2581
- Sheth et al. (2003) Sheth K., Regan M. W., Scoville N. Z., Strubbe L. E., 2003, ApJ, 592, L13
- Sheth et al. (2005) Sheth K., Vogel S. N., Regan M. W., Thornley M. D., Teuben P. J., 2005, ApJ, 632, 217
- Shibatsuka et al. (2003) Shibatsuka T., Matsushita S., Kohno K., Kawabe R., 2003, PASJ, 55, 87
- Sofue et al. (1999) Sofue Y., Tutui Y., Honma M., Tomita A., Takamiya T., Koda J., Takeda Y., 1999, ApJ, 523, 136
- Teuben (1995) Teuben P., 1995, in Shaw R. A., Payne H. E., Hayes J. J. E., eds, ASP Conf. Series 77, Astronomical Data Analysis Software and Systems IV, p. 398
- Theureau et al. (1998) Theureau G., Bottinelli L., Coudreau-Durand N., Gouguenheim L., Hallet N., Loulergue M., Paturel G., Teerikorpi P., 1998, A&AS, 130, 333
- Toomre (1964) Toomre A., 1964, ApJ, 139, 1217
- van den Bergh (2002) van den Bergh S., 2002, AJ, 124, 782
- van der Marel (1991) van der Marel R. P., 1991, MNRAS, 253, 710
- Veilleux et al. (1995) Veilleux S., Kim D.-C., Sanders D. B., Mazzarella J. M., Soifer B. T., 1995, ApJS, 98, 171
- Warner et al. (1973) Warner P. J., Wright M. C. H., Baldwin J. E., 1973, MNRAS, 163, 163
- White et al. (1997) White R. L., Becker R. H., Helfand D. J., Gregg M. D., 1997, ApJ, 475, 479
- Yun et al. (2001) Yun M. S., Reddy N. A., Condon J. J., 2001, ApJ, 554, 803
- Zhu et al. (1999) Zhu M., Seaquist E. R., Davoust E., Frayer D. T., Bushouse H. A., 1999, AJ, 118, 145