The nuclear to host galaxy relation of high redshift quasars
Abstract
We present near-infrared imaging obtained with ESO VLT+ISAAC of the host galaxies of a sample of low luminosity quasars in the redshift range 1 2, aimed at investigating the relationship between the nuclear and host galaxy luminosities at high redshift. This work complements our previous systematic study to trace the cosmological evolution of the host galaxies of high luminosity quasars (Falomo et al. 2004). The new sample includes 15 low luminosity quasars, of which nine are radio–loud (RLQ) and six are radio–quiet (RQQ). They have similar distribution of redshift and optical luminosity, and together with the high luminosity quasars they cover a large range (4 mag) of the quasar luminosity function. For all the observed objects, except one RQQ and one RLQ, we have been able to derive the global properties of the surrounding nebulosity. The host galaxies of both types of quasars are in the range of massive inactive ellipticals between and 10. RLQ hosts are systematically more luminous than RQQ hosts by a factor of 2. This difference is similar to that found for the high luminosity quasars. This luminosity gap appears to be independent of the rest-frame -band luminosity but clearly correlated with the rest-frame -band luminosity. The color difference between the RQQs and the RLQs is likely a combination of an intrinsic difference in the strength of the thermal and nonthermal components in the SEDs of RLQs and RQQs, and a selection effect due to internal dust extinction. For the combined set of quasars, we find a reasonable correlation between the nuclear and the host luminosities. This correlation is less apparent for RQQs than for RLQs. If the -band luminosity is representative of the bolometric luminosity, and assuming that the host luminosity is proportional to the black hole mass, as observed in nearby massive spheroids, quasars emit with a relatively narrow range of power with respect to their Eddington luminosity and with the same distribution for RLQs and RQQs.
1 Introduction
Low redshift (z 0.5) quasars are predominantly hosted by luminous, massive, bulge-dominated galaxies (e.g. McLeod & Rieke 1994; Taylor et al. 1996; Bahcall et al. 1997; Percival et al. 2000; Hamilton, Casertano & Turnshek 2002; Dunlop et al. 2003; Pagani, Falomo & Treves 2003; Floyd et al. 2004). More specifically, the nature of the host depends on nuclear luminosity in the sense that high luminosity quasars are exclusively hosted in elliptical galaxies, while fainter radio quiet quasars can also be found in early-type spirals (Hamilton et al. 2002; Dunlop et al. 2003). This trend is consistent with the fact that low luminosity type 1 AGN (e.g. Seyfert 1s) are only found in spiral galaxies (e.g. Kotilainen & Ward 1994; Hunt et al. 1997).
This scenario is consistent with the fact that practically all nearby massive spheroids (ellipticals and bulges of early-type spirals) have an inactive supermassive black hole (BH) in their centers (see e.g. Barth 2004; Ferrarese 2006 for recent reviews) and that more massive bulges host the most massive BHs. This suggests that episodic quasar activity (with a varying duty cycle) may be very common in massive galaxies and that the nuclear power depends on the mass of the galaxy. Powerful quasar activity is in fact only found in the most luminous (massive) galaxies (Hamilton et al. 2002; Falomo, Carangelo & Treves 2003; Kauffmann et al. 2003). At low redshift, the mass of the BH is correlated to the luminosity and the velocity dispersion of the bulge (e.g. Magorrian et al. 1998, Ferrarese & Merritt 2000, Gebhardt et al. 2000, McLure & Dunlop 2002, Marconi & Hunt 2003, Bettoni et al. 2003, Häring & Rix 2004). Furthermore, the strong cosmological evolution of the quasar population, with a co-moving space density peak at z 2–3 before rapidly declining to its low present value (Dunlop & Peacock 1990; Warren, Hewett, & Osmer 1994; Boyle 2001) is similar to the BH mass accretion rate and the evolution of the cosmic star formation history (Madau, Pozzetti, & Dickinson 1998; Franceschini et al. 1999; Steidel et al. 1999; Chary & Elbaz 2001, Barger et al. 2001, Yu & Tremaine 2002, Marconi et al. 2004). Therefore, determining how the properties of the galaxies hosting quasars evolve with the cosmic time may be crucial to investigate the fundamental link between the formation and evolution of massive galaxy bulges and their nuclear activity, and to reveal whether BHs and spheroids really grow synchronously.
The detection of the host galaxies for high redshift objects and the characterization of their properties is rather challenging because the host galaxy becomes rapidly very faint compared to the nucleus. In order to cope with this, imaging with high spatial resolution and S/N together with a well defined point spread function (PSF) for modeling the images are of crucial importance.
In a previous work (Falomo et al. 2004), with the 8m Very Large Telescope (VLT) and ISAAC, we have carried out a systematic imaging study under excellent seeing conditions (median 04 FWHM) of 17 quasars (10 radio-loud quasars [RLQ] and seven radio-quiet quasars [RQQ]) in the redshift range 1 z 2 to characterize their host galaxies. We found that the luminosity evolution of both RLQ and RQQ hosts until z 2 is consistent with that of massive ellipticals undergoing passive evolution. There is no significant decrease in the host mass until z 2 as would be expected in the models of hierarchical formation of massive ellipticals (Kauffmann & Haehnelt 2000). Note, however, that more recent hierarchical models including e.g. feedback due to AGN and supernovae (e.g. Granato et al. 2004; Bower et al. 2006) are in agreement with the existence of a substantial population of massive ellipticals out to at least z 2. We also found evidence that RLQ hosts are systematically more luminous (massive) by a factor 2 than RQQ hosts at all redshifts. A similar result was obtained by Kukula et al. (2001) using a smaller sample of quasars at z 0.9 and z 1.9. Little correlation was found between the nuclear and the host luminosities. Note that at low redshift some claims of a correlation between the two quantities have been reported in the literature (e.g. McLeod & Rieke 1994; Bahcall et al. 1997; Hooper, Impey & Foltz 1997), whereas some other studies of low redshift quasars (e.g. Dunlop et al. 2003) have not found a correlation for high luminosity quasars. Obviously, selection effects due to the difficulty of detecting faint galaxies hosting bright quasars, or vice versa, of detecting weak quasars located in bright host galaxies, may combine to form a spurious correlation (e.g. Hooper et al. 1997).
The majority of quasars studied at high redshift, including those in Falomo et al. (2004), belong to the bright end of quasar luminosity function, due to the selection effects in flux-limited samples, e.g. the redshift - luminosity degeneracy. In this paper, we present an imaging study of a sample of lower luminosity quasars (by 2 mag on average with respect to that of Falomo et al. 2004), to study the dependence of host properties on nuclear luminosity at high redshift. We have therefore a well matched sample of quasars and we are in a good position to study the significance of any correlation between the nuclear and the host luminosities. In section 2 we describe our sample, in section 3 we report the observations and in section 4 we describe the data analysis. Our results for the observed quasars and their comparison with the host luminosities of quasars derived from other samples, the relationship between host and nuclear luminosities, and the cosmic evolution of RLQ and RQQ host galaxies are discussed in section 5. Summary of our results and directions for future work are given in Section 6. We adopt the concordance cosmology with H0 = 70 km s-1 Mpc-1, = 0.3 and = 0.7
2 The sample
The sample of low luminosity (hereafter LL) quasars was defined to be matched in redshift with the sample of high luminosity (hereafter HL) quasars of Falomo et al. (2004). It was extracted from the quasar catalogue of Veron-Cetty & Veron (2003) requiring: 1.0 z 2.0, -25.0 at z = 1.0, increasing to -26.3 at z = 2.0, –60∘ -8∘, and having sufficiently bright stars within 1 arcmin of the quasar in order to allow a reliable characterization of the PSF. Our choice of a slightly redshift dependent magnitude limit guarantees an optimal matching in redshift between the HL and LL subsamples, while roughly corresponding to a simple magnitude limit at . We included both RLQs and RQQs in order to investigate the difference between the host galaxies of the two types of quasars. Importantly, the LL and HL RLQ and RQQ subsamples are well matched in both their redshift and optical/blue luminosity distribution. This selection yielded in total 20 LL quasars, of which 15 quasars were imaged, nine RLQs and six RQQs (Table 1). There is no statistically significant difference in the properties of the original and the observed samples. Fig. 1 shows the distribution of the observed quasars in the redshift–optical luminosity plane compared with those for HL quasars in Falomo et al. (2004) and with all the quasars in Veron-Cetty & Veron (2003).
3 Observations
Deep images of the quasars in the - or -band were obtained using the near-infrared (NIR) ISAAC camera (Cuby et al. 2000), mounted on UT1 (Antu) of VLT at the European Southern Observatory (ESO) in Paranal, Chile. The Short Wavelength (SW) arm of ISAAC is equipped with a 1024 x 1024 px Hawaii Rockwell array, with a pixel scale of 0147 px-1, giving a field of view of 150 x 150 arcsec. The observations were performed in service mode in the period between 2004 October and 2005 January. A detailed journal of observations is given in Table 1. The seeing, as derived from the full width half maximum (FWHM) size of the image of stars in each frame, was consistently excellent during the observations, ranging from 03 to 05 (average and median FWHM = 04). The choice of observing in the - and -band, for objects at below and above z = 1.4, respectively, was motivated by observing the same rest-frame wavelengths as a function of redshift.
Total integration times were 36 minutes per target. The images were secured using individual exposures of 2 minutes per frame, and a jitter procedure (Cuby et al. 2000), which produces a set of frames at randomly offset telescope positions within a box of 10 x 10 arcsec centered on the first pointing. Data reduction was performed by the ESO pipeline for jitter imaging data (Devillard 1999). Each frame was flat-fielded by a normalized flat field obtained by subtracting ON and OFF images of the illuminated dome, after interpolating over bad pixels. Sky subtraction was derived by median averaging sky frames from the 10 frames nearest in time. The reduced frames were aligned to sub-pixel accuracy using a fast object detection algorithm, and co-added after removing spurious pixel values. Photometric calibration was performed using standard stars observed during the same night. The estimated internal photometric accuracy is 0.03 mag.
4 Two-dimensional data analysis
Two-dimensional data analysis has been carried out using AIDA, Astronomical Image Decomposition and Analysis (Uslenghi & Falomo, in prep.), a software package specifically designed to perform two-dimensional model fitting of quasar images, providing simultaneous decomposition into nuclear and host components. The analysis consists of two main parts: a) PSF modeling and b) quasar decomposition.
4.1 PSF modeling
To detect the host galaxies of quasars and to characterize their properties, the key factors are the nucleus-to-host magnitude ratio and the seeing (the shape of the PSF). The most critical part of the analysis is thus to perform a detailed PSF modeling for each frame. This is based on fitting a parameterized bidimensional model to the field stars, that are selected based on FWHM, roundness and signal-to-noise ratio. A sufficiently bright, saturated star was included in the list of reference stars in order to model the shape of the faint wing of the PSF, against which most of the signal from the surrounding nebulosity will be detected. The relatively large field of view of ISAAC (25) and the constraint on the quasar selection to have at least one bright star within 1 arcmin from the quasar, allowed us to reach this goal and thus to perform a reliable characterization of the PSF. Images with a large number of stars distributed over the field of view have been checked to account for any possible positional dependence of the PSF. No significant variations were found and in this analysis the PSF is assumed to be spatially invariant, i.e., the same model has been fitted simultaneously to all the reference stars of the image.
For each source, a mask was built to exclude contamination from nearby sources, bad pixels and other defects affecting the image. The local background was computed in a circular annulus centered on the source, and its uncertainty was estimated from the standard deviation of the values computed in sectors of concentric sub-annuli included in this area. The region to be used in the fit was selected by defining an internal and an external radius of a circular area. Setting the internal radius to a non-zero value allows excluding the core of bright, saturated stars.
4.2 Quasar host characterization
Once a suitable model of the PSF was determined, the quasar images were first fitted with only the PSF model in order to provide a first indication of a deviation from the PSF shape. Then the object was fitted with a point source plus a galaxy modeled as a de Vaucouleurs r1/4 or a disk model convolved with the PSF for the host galaxy, adding a scaled PSF to represent the nucleus. If the residuals did not reveal any significant deviation, based on the comparison of the values between PSF-only and PSF+host models, the object was considered unresolved.
With this procedure we can derive the luminosity and the scale-length of the host galaxies and the luminosity of the nuclei. An estimate of the errors associated with the computed parameters was obtained by simulating the process with synthetic data. Simulated quasar images were generated adding noise to the best fit model, then the fit procedure was applied to these images, producing a ”best fit” combination of parameter values for each image. For each parameter, the standard deviation of the best-fit values gives an estimate of the uncertainty on the parameters. Obviously, this procedure does not take into account systematic errors generated by non-perfect modeling of the PSF, which can be roughly estimated by comparing results obtained with different PSF models, statistically consistent with the available data. In our worst case, Q 0335-3546, for example, this effect produces an uncertainty of 0.3 mag on the brightness of the host galaxy. Instead, in cases with a large number of suitable reference stars, the uncertainty is dominated by the noise. Upper limits to host magnitudes of unresolved objects were computed by adding a galaxy component to the PSF and varying its surface brightness until the model profile was no longer consistent with the observed profile.
While the total magnitude of the host galaxy can be derived with a typical internal error of 0.2 - 0.7 mag (0.4 mag on average), the scale-length is often poorly constrained. This depends on the degeneracy that occurs between the effective radius and the surface brightness (see Taylor et al. 1996).
At high redshifts, it becomes difficult to distinguish between exponential disk and bulge models from the luminosity distributions. In this work, we have assumed that the host galaxies can be represented as elliptical galaxies following a de Vaucouleurs model. This is supported by the strong evidence at low redshift for the predominance of bulge dominated hosts of quasars (e.g. Hamilton et al. 2002; Dunlop et al. 2003; Pagani et al. 2003 and references therein). Table 2 shows that for practically all the RLQs in our sample, we formally find a better fit (a lower value) using a de Vaucouleurs model. For the RQQs, the situation is reverse, with 4/5 objects formally having a better fit with a disk model. In most of these cases, however, the difference in the value between the models is negligible. Note that adopting a disk model would result in fainter host galaxies, by 0.5 mag on average, but this would not introduce systematic differences that would affect our conclusions.
5 Results
In Fig. 2, we report for each observed quasar the image of the quasar, the best-fitting host galaxy model after subtracting a scaled PSF, the residuals after fitting the model, the radial brightness profile and the best fit using the procedure described above. The parameters of the best fit, together with their estimated uncertainty, are given in Table 2. All quasars except two (RQQ Q 1045+056 and RLQ PKS 0805-07) are resolved. This is quantified in Table 2 by comparing the reduced value of the best fit including a host galaxy model with that obtained from the best fit performed only with the PSF model.
In Table 3, we report the absolute magnitudes and the effective radii for each quasar host. As our observations in the redshift range were obtained in the and filters, the detections of the host galaxies roughly correspond to rest-frame Å. This is also the case for the HL sample of Falomo et al. (2004). On the other hand, Kukula et al. (2001) and Ridgway et al. (2001) observed quasars with the HST filter F165M, which corresponds to rest-frame Å. Therefore, in order to refer all these observations to the same band (and to minimize the color and K-corrections), we transformed observed magnitudes into absolute magnitudes in the -band. Moreover, the use of -band magnitudes offers the possibility of a relatively easy comparison with the majority of the published low redshift quasar host studies. To perform the color and K-correction transformations, we assumed an elliptical galaxy template (Mannucci et al. 2001) for the host galaxy magnitudes, and a composite quasar spectrum (Francis et al. 1991) for the nuclear magnitudes, Note that the K-correction in the observed K-band is almost independent of galaxy type up to z 2, whereas in the observed H-band at 1 z 1.5, the K-correction depends on the assumed host galaxy template, being 0.1 - 0.25 mag larger for elliptical galaxies than for spiral (Sc) galaxies (Mannucci et al. 2001).
5.1 Properties of the host galaxies of quasars at 1 z 2
In Fig. 3 we compare the absolute -band magnitudes of the quasar host galaxies versus redshift in this work, with the HL quasar hosts (Falomo et al. 2004) and with quasar hosts from Kukula et al. (2001) and Ridgway et al. (2001). Note that the z 2 sample of Kukula et al. (2001) has on average similar nuclear luminosity ( = –24.9 0.9) to our LL sample ( = –24.9 1.0), whereas the RQQs in Ridgway et al. (2001) at z 1.8 are significantly fainter ( = –23.3 1.2). In order to treat these literature data homogeneously, we have considered the published apparent magnitudes in the and -bands and transformed them to following our procedure (K-correction, cosmology and color correction). The average absolute -band magnitudes of the host galaxies of the samples of LL RLQs and RQQs (this work) and HL RLQs and RQQs (Falomo et al. 2004) are given in Table 4, column 6.
Almost all the observed quasars have host galaxies with luminosity ranging between and , where (R) (Gardner et al. 1997; Nakamura et al. 2003) is the characteristic luminosity of the Schechter luminosity function for elliptical galaxies.
For the LL quasars, there is a systematic difference in the luminosity between RLQ and RQQ host galaxies of 0.9 mag. Similar difference has been found in many previous studies for quasars at low redshift (Bahcall et al. 1997; Hamilton et al. 2002; Dunlop et al. 2003) and high redshift (Kukula et al. 2001). Floyd et al. (2004) found no difference between the RLQ and RQQ host luminosities at z 0.4 ((RQQ)=–23.35, (RLQ)=–23.07 for elliptical host galaxies), but we note that their subsamples are not well matched in nuclear luminosity. The difference found in this work is also similar to that found for HL quasars (0.7 mag; Falomo et al. 2004). and our new results thus confirm this offset, based on a larger statistical sample and a larger luminosity interval.
5.2 The relation between nuclear and host luminosities
If the mass of the central BH is proportional to the mass and thus to the luminosity of the spheroid of the host galaxy, as it is observed for nearby inactive early-type galaxies (Kormendy & Richstone 1995; Magorrian et al. 1998), and if the quasar emits at a roughly fixed fraction of the Eddington luminosity, one would expect a correlation between the luminosity of the nucleus and that of the host galaxy. However, nuclear obscuration, beaming, and/or an intrinsic spread in the accretion rate and accretion-to-luminosity conversion efficiency, could destroy this correlation.
Our combined sample of LL and HL quasars in this work and in Falomo et al. (2004) is designed to explore a large range of nuclear luminosity (-23.5 -28; H0 = 50 km s-1 Mpc-1, q0 = 0, corresponding to -22.8 -27.1 in our adopted cosmology) and can therefore be used to investigate this issue. In Table 4 we report the average values of the rest frame -band absolute magnitudes for the four subsamples (HL RLQ, LL RLQ, HL RQQ and LL RQQ). These values are derived from the -band apparent magnitudes reported in Veron–Cetty & Veron (2003), K-corrected and color corrected following the procedure described above. A correction for the Galactic extinction was applied following Schlegel, Finkbeiner & Davis (1998).
Both in the LL and HL samples, the nuclear -band luminosities of the RLQs and RQQs are matched within 0.1 mag. On the other hand, considering the rest-frame -band nuclear luminosities, RLQs appear more luminous than RQQs by mag. Note that also in the sample of Kukula et al. (2001), the quasars are well matched in the -band, but not in the -band, where again the RLQs appear more luminous than the RQQs. These results, therefore, suggest that (at least in the redshift range considered here) there is a systematic color difference between the nuclei of RLQs and those of RQQs, in the sense that RLQs are redder than RQQs by mag in the rest-frame color. Indeed, there is no apparent difference between the UV-to-NIR spectral properties of RLQs and RQQs in the well known average quasar spectral energy distribution (SED) of Elvis et al. (1994), but the considered sample is biased toward X-ray and optically bright (i.e. bluer) quasars. Some hint of a possible difference between the SED of RLQs and RQQs was reported by Barkhouse & Hall (2001), who observed a greater NIR-to-optical luminosity ratio of RLQs with respect to RQQs in a large sample of quasars detected by 2MASS. Furthermore, Francis et al. (2000) found that the optical–NIR continuum is significantly redder in radio selected RLQs from the PKS Half-Jansky Flat-Spectrum survey than in optically selected RQQs from the Large Bright Quasar Survey.
This effect may be interpreted as due to a differential extinction by dust or to an intrinsic difference of the strength of thermal and non thermal emission components in the SEDs of RQQs and RLQs. For instance, in the case of flat spectrum quasars, one could expect to observe an enhanced non-thermal (synchrotron) component which contaminates the SED more in the near-IR than in the . Of course, this would suggest that the near-IR luminosity is not a good tracer of the bolometric emission. However, Francis et al. (2000) find that this effect is not sufficient to describe the spectral shape of all the sources in their radio-selected sample: about the 50 per cent of their PKS QSOs are more likely to be reddened by dust. We believe that, with present data, both explanations (synchrotron contamination and dust extinction) are viable; however, in the specific case of our sample of RLQs, the hypothesis of synchrotron contamination is weakened because one third of the objects are steep spectrum radio sources (viewed further away from the jet axis than flat spectrum radio quasars), and there is no correlation between the radio spectral index and the (observed ) color. If indeed extinction by dust is the dominant effect, then the -band would be a better tracer of the bolometric luminosity than the -band. Moreover, we note that in the rest-frame , region, the SED of a QSO is contaminated by the variable thermal emission in the accretion disk (the big blue bump), suggesting again that the -band luminosity is a better indicator of the total nuclear emission.
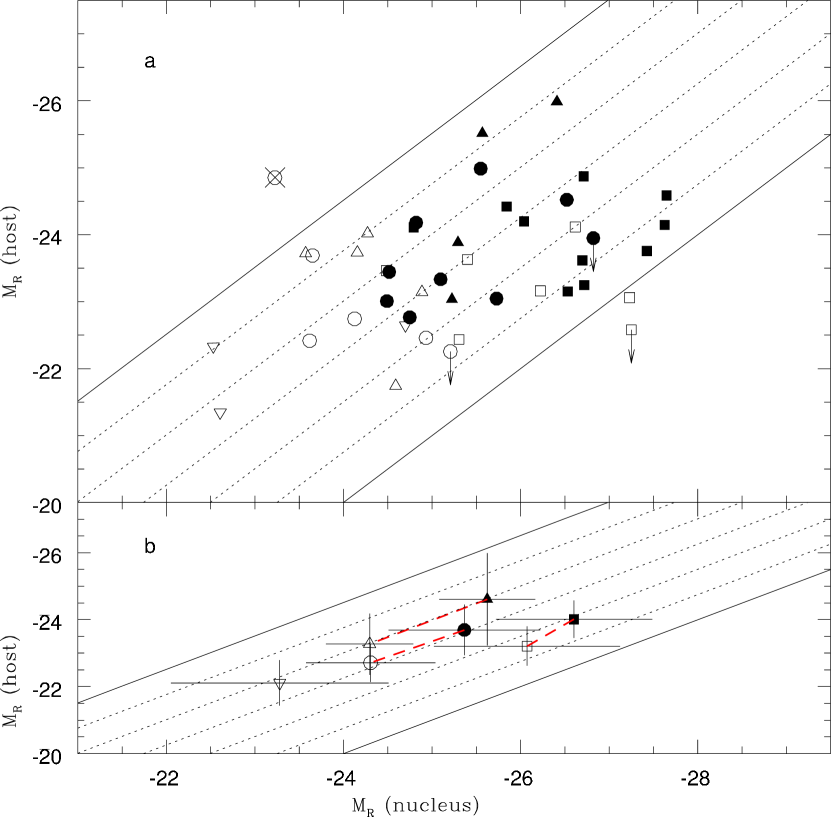
In Fig. 4, we compare the rest-frame -band host and nuclear luminosities of the HL and LL quasars, together with quasars from Kukula et al. (2001) and Ridgway et al. (2001), both for individual quasars (upper panel) and for the samples (lower panel). The resulting Spearman rank correlation coefficients (RS), and the probabilities of obtaining the observed RS values if no correlation is present are given in Table 5. Although this comparison is based on non-complete samples and is subject to uncertainties due to small number statistics, we find some correlation for the full sample of RLQs and RQQs (RS=0.49, and the probability of no correlation, (nc) ). This correlation becomes modest for RLQs (RS=0.36, (nc)=0.1) and disappears altogether for RQQs (RS=0.25, (nc)=0.3). Generally, no such correlation has been found at low redshift (e.g. Dunlop et al. 2003; Pagani et al. 2003). However, interestingly, a similar trend to that found in this work is apparent considering the data given in Hamilton et al. (2002), who studied a large sample of quasars. We derived luminosities from their reported nuclear and host galaxy apparent magnitudes, following our procedure, and we found a clear correlation for their full sample of quasars (RS=0.56, (nc)=) and for their RLQs (RS=0.51, (nc)=), while only a modest correlation is evident for their RQQs (RS=0.38, (nc)=0.1). This is an indication that the different trends of the nucleus–host luminosity relation displayed by RLQs and RQQs may be independent of redshift.
Assuming that the correlation between the central BH mass and the host galaxy luminosity holds up to and that the observed nuclear power is proportional to the bolometric luminosity, the observed nucleus – host luminosity correlation can be interpreted as the result of an intrinsically narrow distribution of the Eddington ratio. The observed scatter is then enhanced by the dispersion in the bulge luminosity – BH mass correlation and by intrinsic differences in the accretion rates. This is consistent with the relationship between the host galaxy and maximum nuclear luminosity observed at lower redshift (e.g. Floyd et al. 2004).
6 Summary and conclusions
We have presented homogeneous high resolution NIR images for a sample of 15 low luminosity quasars in the redshift range 1 z 2, to characterize the properties and the cosmological evolution of their host galaxies, and to make a reliable comparison between RLQ and RQQ hosts. Together with the high luminosity quasars previously studied by us, they cover a large range (4 mag) of the quasar luminosity function.
The quasar host galaxies follow the trend in luminosity of massive inactive ellipticals (between and 10) undergoing simple passive evolution. However, RLQ hosts appear systematically more luminous (massive) than RQQ hosts by a factor of 2. This difference is similar to that found for the high luminosity quasars and our new observations indicate that this gap is apparently independent of the nuclear luminosity in the observed -band (rest frame -band) in the sense that at a fixed observed -band luminosity, the host galaxies of RLQs are a factor of 2 brighter in the observed -band (rest frame -band) than those of RQQs.
However, if the -band nuclear luminosity is considered, the gap in the host luminosity could be ascribed to a difference in the total nuclear power. In fact (see Fig. 4), the magnitude gap of the host luminosity corresponds to a similar gap in the nuclear -band luminosity, suggesting that at a fixed host mass (and BH mass), the same bolometric power is emitted.
For the combined sample of RQQs and RLQs, we find some correlation between the nuclear and the host luminosities, albeit with a large scatter, possibly due to a varying accretion efficiency. If the host luminosity is proportional to the black hole mass, quasars emit in a narrow range of power with respect to their Eddington luminosity. This range does not depend on redshift or on the radio properties of the quasars.
Determining the quasar host properties at even higher redshift, around the peak epoch of quasar activity (z 2.5) and beyond, requires very high S/N observations with a very narrow reliable PSF. We have an ongoing program to tackle this problem using NIR adaptive optics imaging with NACO on VLT for high luminosity quasars (Falomo et al. 2005,2007), and NIR non-adaptive optics with ISAAC on VLT for low luminosity quasars (Kotilainen et al., in prep.). Color information for the hosts (e.g. deep -band imaging to target rest-frame UV emission), spectroscopy to estimate the BH masses of high redshift quasars, and the study of environments as a function of redshift and radio power, will also be addressed in future work.
References
- Bahcall et al. (1997) Bahcall, J.N., Kirhakos S., Saxe D.H., Schneider D.P. 1997, ApJ 479, 642
- Barger et al. (2001) Barger,A.J., Cowie,L.L., Bautz,M.W., et al., 2001, AJ 122, 2177
- (3) Barkhouse,W.A., Hall,P.B., 2001, AJ 121, 2843
- Barth (2004) Barth,A.J., 2004, The Interplay among Black Holes, Stars and ISM in Galactic Nuclei, Proc. IAU Symp. No. 222 (Ed. T. Storchi-Bergmann, L.C. Ho, and H.R. Schmitt), Cambridge University Press, p.3
- Bettoni et al. (2003) Bettoni,D., Falomo,R., Fasano,G., Govoni,F., 2003, A&A 399, 869
- (6) Bower,R.G., Benson,A.J., Malbon,R., et al., 2006, MNRAS 370, 645
- Boyle (2001) Boyle, B.J. 2001, Advanced Lectures on the Starburst-AGN Connection, (ed. I.Aretxaga, D.Kunth, R.Mujica), Singapore: World Scientific, p.325
- Bressan et al. (1994) Bressan, A., Chiosi, C., Fagotto, F., 1994, ApJS, 94, 63.
- Chary & Elbaz (2001) Chary,R., Elbaz,D., 2001, ApJ 556, 562
- Cuby et al. (2000) Cuby, J.G., Lidman, C., Moutou, C., Petr, M. 2000, Proc. SPIE, 4008, 1036
- Devillard (1999) Devillard, N., 1999, Astronomical Data Analysis Software and Systems VIII, ASP Conference Series, Vol. 172 (ed. D.M. Mehringer, R.L. Plante, D.A. Roberts), p. 333
- Dunlop & Peacock (1990) Dunlop, J. S., Peacock, J. A. 1990 MNRAS, 247, 19
- Dunlop et al. (2003) Dunlop, J.S., McLure, R.J., Kukula, M.J., et al., 2003, MNRAS, 340, 1095
- Elvis et al. (1994) Elvis, M., Wilkes, B.J., McDowell, J.C., et al., 1994, ApJS, 95, 1
- Falomo et al. (2003) Falomo, R. Carangelo,N., Treves, A. 2003, MNRAS 343, 505
- Falomo et al. (2004) Falomo, R. Kotilainen, J.K., Pagani, C., Scarpa, R., Treves, A. 2004, ApJ 604, 495
- Falomo et al. (2005) Falomo, R. Kotilainen, J.K., Scarpa, R., Treves, A. 2005, A&A 434, 469
- Falomo et al. (2007) Falomo, R. Kotilainen, J.K., Scarpa, R., Treves, A. 2007, A&A, submitted
- Ferrarese & Merritt (2000) Ferrarese,L., Merritt,D., 2000, ApJ 539, L9
- Ferrarese (2006) Ferrarese,L., 2006, Joint Evolution of Black Holes and Galaxies, eds. M. Colpi et al. (Taylor & Francis Group), p. 1
- Floyd et al. (2004) Floyd,D.J.E., Kukula,M.J., Dunlop,J.S., et al., 2004, MNRAS 355, 196
- Franceschini et al. (1999) Franceschini, A., Hasinger G., Miyaji T., Malquori D. 1999, MNRAS, 310, L5
- (23) Francis, P.J., Hewett, P.C., Foltz, C.B., et al., 1991, ApJ, 373, 465
- (24) Francis,P.J., Whiting,M.T., Webster,R.L., 2000, PASA 17, 56
- (25) Gardner,J.P., Sharples,R.M., Frenk,C.S., Carrasco,B.E., 1997, ApJ, 480, L99
- Gebhardt et al. (2000) Gebhardt,K., Bender,R., Bower,G., et al., 2000, ApJ 539, L13
- (27) Granato,G.L., De Zotti,G., Silva,L., Bressan,A., Danese,L., 2004, ApJ 600, 580
- Hamilton et al. (2002) Hamilton,T.S., Casertano,S., Turnshek,D.A., 2002, ApJ 576, 61
- Hooper et al. (1997) Hooper, E.J., Impey C.D. & Foltz C.B., 1997, ApJ, 480, L95
- Hunt et al. (1997) Hunt, L.K., Malkan,M.A., Salvati,M., et al., 1997, ApJS, 108, 229
- Haring & Rix (2004) Häring,N., Rix,H.W., 2004, ApJ 604, L89
- Kauffmann & Haehnelt (2000) Kauffmann, G., Haehnelt, M., 2000, MNRAS, 311, 576
- Kauffmann et al. (2003) Kauffmann,G., Heckman,T.M., Tremonti,C., et al. 2003, MNRAS 346, 1055
- Kormendy & Richstone (1995) Kormendy, J., Richstone, D., 1995, ARA&A, 33, 581
- Kotilainen & Ward (1994) Kotilainen, J.K., Ward, M.J., 1994, MNRAS, 266, 953
- Kukula et al. (2001) Kukula, M.J., Dunlop, J.S., McLure, R.J., et al., 2001, MNRAS, 326, 1533
- Madau et al. (1998) Madau, P., Pozzetti, L., Dickinson, M. 1998 ApJ, 498, 106
- Magorrian et al. (1998) Magorrian, J.,Tremaine, S., Richstone, D., et al., 1998, AJ, 115, 2285
- (39) Mannucci, F., Basile, F., Poggianti, B.M., et al. 2001, MNRAS, 326, 745
- Marconi & Hunt (2003) Marconi,A., Hunt,L.K. 2003, ApJ 589, L21
- Marconi et al. (2004) Marconi,A., Risaliti,G., Gilli,R., et al., 2004, MNRAS 351, 169
- McLeod & Rieke (1994) McLeod, K.K., Rieke, G.H., 1994, ApJ, 431, 137
- McLure & Dunlop (2002) McLure,R.J., Dunlop,J.S., 2002, MNRAS 331, 795
- (44) Nakamura,O., Fukugita,M., Yasuda,N., et al., 2003, AJ 125, 1682
- Pagani et al. (2003) Pagani, C., Falomo, R., Treves, A., 2003, ApJ 596, 830
- Percival et al. (2000) Percival, W.J., Miller, L., McLure, R.J., Dunlop, J.S. 2000, MNRAS 322, 843
- Ridgway et al. (2001) Ridgway, S., Heckman, T., Calzetti, D., Lehnert, M. 2001, ApJ, 550, 122
- Schlegel et al. (1998) Schlegel D.J., Finkbeiner D.P., Davis M., 1998, ApJ, 500, 525
- Steidel et al. (1999) Steidel, C.C., Adelberger, K.L., Giavalisco, M., Dickinson, M., Pettini, M., 1999, ApJ 519, 1
- Taylor et al. (1996) Taylor, G.L., Dunlop, J.S., Hughes, D.H., Robson, E.I. 1996, MNRAS, 283, 930
- Veron-Cetty & Veron (2003) Veron-Cetty, M.P., Veron, P. 2003, A&A 412, 399
- Warren et al. (1994) Warren, S.J., Hewett, P.C., Osmer, P.S. 1994, ApJ, 421, 412
- Yu & Tremaine (2002) Yu,Q., Tremaine,S., 2002, MNRAS 335, 965


| Quasar | z | VaaQuasar -band apparent magnitudes from Veron-Cetty & Veron (2003). | Date | Filter | bbFrame exposure time in minutes | SeeingccThe average FWHM in arcsec of all stars in the frame. | NddNumber of stars used for the PSF modelling of each field. |
|---|---|---|---|---|---|---|---|
| (min) | (arcsec) | ||||||
| Radio Quiet Quasars | |||||||
| Q 0335-3546 | 1.841 | 19.8 | 01/Nov/04 | K | 36 | 0.34 | 4 |
| MS 0824.2+0327 | 1.431 | 20.2 | 24/Dec/04 | K | 36 | 0.33 | 5 |
| 2QZ J101733-0049 | 1.342 | 20.4 | 25/Dec/04 | H | 36 | 0.47 | 4 |
| 2QZ J101733-0203 | 1.895**The 2QZ catalogue contains two different redshift determinations for this object: , . We adopt here because the 2QZ spectrum from which this value is inferred shows stronger emission lines. | 20.8 | 26/Dec/04 | K | 36 | 0.32 | 6 |
| TOL 1033.1-27.3 | 1.610 | 21.8 | 26/Dec/04 | K | 36 | 0.32 | 4 |
| Q 1045+056 | 1.230 | 20.3 | 26/Jan/05 | H | 36 | 0.52 | 3 |
| Radio Loud Quasars | |||||||
| PKS 0258+011 | 1.221 | 20.5 | 01/Nov/04 | H | 36 | 0.51 | 3 |
| PKS 0432-148 | 1.899 | 21.2 | 31/Oct/04 | K | 36 | 0.47 | 6 |
| PKS 0442+02 | 1.430 | 20.5 | 01/Nov/04 | K | 36 | 0.37 | 7 |
| PKS 0511-220 | 1.296 | 19.5 | 27/Nov/04 | H | 36 | 0.44 | 5 |
| PKS 0805-07 | 1.837 | 19.8 | 25/Dec/04 | K | 36 | 0.37 | 7 |
| PKS 0837+035 | 1.570 | 20.7 | 24/Dec/04 | K | 36 | 0.37 | 4 |
| PKS 0845-051 | 1.242 | 19.4 | 21/Dec/04 | H | 36 | 0.38 | 5 |
| PKS 1015-31 | 1.346 | 20.4 | 26/Dec/04 | H | 36 | 0.27 | 5 |
| PKS 1046-222 | 1.609 | 21.7 | 25/Jan/05 | K | 36 | 0.37 | 3 |
| Quasar | z | Filter | aaApparent magnitudes correspond to the indicated filter. | aaApparent magnitudes correspond to the indicated filter. | re | bbThe reduced value of the fit with PSF and an elliptical host galaxy model. | ccThe reduced value of the fit with PSF and an exponential disk host galaxy model. | ddThe reduced value of the fit with only the PSF model. In the cases of Q 1045+056 and PKS 0805-07 the does not significantly improve when adding the galaxy component, therefore these objects are indicated as unresolved. | DFeeNumber of degrees of freedom. |
|---|---|---|---|---|---|---|---|---|---|
| (arcsec) | |||||||||
| Radio Quiet Quasars | |||||||||
| Q 0335-3546 | 1.841 | K | 17.9 | 20.10.4 | 1.10.5 | 0.6 | 0.4 | 1.4 | 8 |
| MS 0824.2+0327 | 1.431 | K | 18.4 | 18.10.1 | 0.50.1 | 1.0 | 1.1 | 19.0 | 15 |
| 2QZ J101733-0049 | 1.342 | H | 19.0 | 20.20.3 | 0.90.2 | 1.3 | 1.2 | 4.2 | 12 |
| 2QZ J101733-0203 | 1.895 | K | 18.8 | 19.90.2 | 1.00.6 | 1.6 | 1.3 | 4.0 | 13 |
| TOL 1033.1-27.3 | 1.610 | K | 19.2 | 17.30.1 | 0.60.1 | 3.6 | 1.5 | 67.1 | 35 |
| Q 1045+056 | 1.230 | H | 17.4 | 20.1 | … | - | - | 0.9 | 11 |
| Radio Loud Quasars | |||||||||
| PKS 0258+011 | 1.221 | H | 17.5 | 19.00.2 | 0.70.2 | 0.8 | 1.0 | 6.6 | 23 |
| PKS 0432-148 | 1.899 | K | 17.2 | 19.60.3 | 1.20.2 | 1.2 | 1.5 | 2.0 | 17 |
| -PKS 0442+02 | 1.430 | K | 16.5 | 16.80.1 | 0.80.2 | 1.1 | 3.5 | 33.5 | 39 |
| PKS 0511-220 | 1.296 | H | 18.1 | 19.50.3 | 0.70.2 | 1.5 | 1.6 | 3.5 | 13 |
| PKS 0805-07 | 1.837 | K | 16.0 | 18.6 | … | - | - | 1.6 | 16 |
| PKS 0837+035 | 1.570 | K | 17.6 | 19.30.3 | 0.90.3 | 1.0 | 2.4 | 4.1 | 10 |
| PKS 0845-051 | 1.242 | H | 17.8 | 18.20.1 | 0.60.2 | 0.5 | 7.9 | 38.7 | 9 |
| PKS 1015-31 | 1.346 | H | 16.1 | 18.10.1 | 0.90.2 | 1.0 | 2.3 | 17.7 | 26 |
| PKS 1046-222 | 1.609 | K | 17.9 | 18.70.2 | 0.70.2 | 1.2 | 1.2 | 10.3 | 15 |
| Quasar | z | aaSurface brightness (in mag/arcsec2) at the effective radius, derived from the best fit model. | bbK-corrected absolute magnitudes of the nuclei and the host galaxies are reported in the -band; no correction for galactic extinction is applied. | bbK-corrected absolute magnitudes of the nuclei and the host galaxies are reported in the -band; no correction for galactic extinction is applied. | N/HccThe N/H ratio refers to the absolute magnitudes. | Re | ddThe total -band absolute magnitudes were calculated from the apparent V magnitudes in Veron-Cetty & Veron (2003) into our adopted cosmology and K-correction. The Galactic extinction was evaluated following Schlegel, Finkbeiner & Davis (1998). |
|---|---|---|---|---|---|---|---|
| (kpc) | |||||||
| Radio-quiet quasars | |||||||
| Q 0335-3546 | 1.841 | 15.5 | -24.9 | -22.5 | 9.12 | 9.5 | -26.0 |
| MS 0824.2+0327 | 1.431 | 11.8 | -23.7 | -23.7 | 1.00 | 4.4 | -25.1 |
| 2QZ J101733-0049 | 1.342 | 15.0 | -23.6 | -22.4 | 3.02 | 7.0 | -24.7 |
| 2QZ J101733-0203 | 1.895 | 14.9 | -24.1 | -22.7 | 3.63 | 8.1 | -25.2 |
| TOL 1033.1-27.3 | 1.610 | 11.2 | -23.2 | -24.9 | 0.21 | 4.9 | -23.9 |
| Q 1045+056 | 1.230 | - | -25.2 | -22.3 | 14.4 | - | -24.5 |
| Radio-loud quasars | |||||||
| PKS 0258+011 | 1.221 | 13.1 | -25.1 | -23.3 | 5.25 | 5.3 | -24.5 |
| PKS 0432-148 | 1.899 | 15.0 | -25.7 | -23.1 | 11.0 | 9.7 | -26.3 |
| PKS 0442+02 | 1.430 | 11.5 | -25.6 | -25.0 | 1.74 | 6.9 | -25.2 |
| PKS 0511-220 | 1.296 | 13.7 | -24.5 | -23.0 | 3.98 | 5.5 | -25.5 |
| PKS 0805-07 | 1.837 | - | -26.8 | -24.0 | 13.2 | - | -26.5 |
| PKS 0837+035 | 1.570 | 14.3 | -24.8 | -22.8 | 6.31 | 7.8 | -24.8 |
| PKS 0845-051 | 1.242 | 12.2 | -24.8 | -24.2 | 1.74 | 5.0 | -25.4 |
| PKS 1015-31 | 1.346 | 12.8 | -26.5 | -24.5 | 6.31 | 7.2 | -24.9 |
| PKS 1046-222 | 1.609 | 13.1 | -24.5 | -23.5 | 2.51 | 6.2 | -23.9 |
| sample | N | z | aa The calculated U-band luminosities have been K-corrected using the composite quasar SED, under the assumption that the underlying host galaxies make negligible contribution to the observed V-band magnitudes. | refbb References: F04 = Falomo et al. (2004); K01 = Kukula et al. (2001); R01 = Ridgway et al. (2001). | |||
|---|---|---|---|---|---|---|---|
| HL RQQ | 7 | 1.520.16 | -26.90.9 | -25.91.0 | -23.30.6 | 0.800.24 | F04 |
| HL RLQ | 10 | 1.510.16 | -27.00.7 | -26.60.9 | -24.00.6 | 0.370.88 | F04 |
| LL RQQ | 5cc The RQQ TOL 1033.1-27.3 (see the caption of Fig. 3) was excluded from the average. | 1.550.30 | -25.10.6 | -24.10.6 | -22.80.6 | 0.810.86 | this work |
| LL RLQ | 9 | 1.490.25 | -25.20.8 | -25.20.7 | -23.70.8 | -0.160.81 | this work |
| RQQ | 5 | 1.860.12 | -26.20.2 | -24.30.5 | -23.30.9 | 1.940.49 | K01 |
| RLQ | 4 | 1.840.14 | -26.60.2 | -25.60.5 | -24.61.4 | 0.930.49 | K01 |
| RQQ | 3 | 1.810.07 | -24.00.3 | -23.31.2 | -22.10.7 | 0.681.04 | R01 |
| RQQ | RLQ | (RQQ | + | RLQ) | |||||
|---|---|---|---|---|---|---|---|---|---|
| NaaNumber of objects in the considered subsample. | RS | P(nc)bbProbability of no correlation, i.e. probability of obtaining the observed RS values if no correlation is present. | NaaNumber of objects in the considered subsample. | RS | P(nc)bbProbability of no correlation, i.e. probability of obtaining the observed RS values if no correlation is present. | NaaNumber of objects in the considered subsample. | RS | P(nc)bbProbability of no correlation, i.e. probability of obtaining the observed RS values if no correlation is present. | |
| HL + LL | 12 | 0.33 | 0.3 | 19 | 0.38 | 0.1 | 31 | 0.44 | |
| All samples | 20 | 0.25 | 0.3 | 23 | 0.36 | 0.1 | 43 | 0.49 |