On the circum(sub)stellar environment of brown dwarfs in Taurus ††thanks: Based on observations made at ESO, CFHT, 2MASS, & Spitzer.
Abstract
Aims. We want to investigate whether brown dwarfs (BDs) form like stars or are ejected embryos. We study the presence of disks around BDs in the Taurus cloud, and discuss implications for substellar formation models.
Methods. We use photometric measurements from the visible to the far infrared to determine the spectral energy distributions (SEDs) of Taurus BDs.
Results. We use Spitzer color indices, H as an accretion indicator, and models fit to the SEDs in order to estimate physical parameters of the disks around these BDs. We study the spatial distribution of BDs with and without disks across the Taurus aggregates, and we find that BDs with and without disks are not distributed regularly across the Taurus cloud.
Conclusions. We find that of Taurus BDs have a circumstellar disk signature, a ratio similar to recent results from previous authors in other regions. We fit the SEDs and find that none of the disks around BDs in Taurus can be fitted convincingly with a flaring index , indicating that heating by the central object is efficient and that the disks we observe retain a significant amount of gas. We find that BDs with disks are proportionally more numerous in the northern Taurus filament, possibly the youngest filament. We do not find such a clear segregation for classical T Tauri stars (CTTS) and weak-lined T Tauri stars (WTTS), suggesting that, in addition to the effects of evolution, any segregation effects could be related to the mass of the object. A by-product of our study is to propose a recalibration of the Barrado y Navascués & Martín (2003) accretion limit in the substellar domain. The global shape of the limit fits our data points if it is raised by a factor 1.25-1.30.
Key Words.:
Stars: formation - Stars: low mass, brown dwarfs - Stars: pre-main sequence - Accretion disks1 Introduction
In recent years, a large number of brown dwarfs (BDs) have been detected in star forming regions, opening the opportunity to study the stellar formation process and the corresponding IMF deep into the substellar domain, even down to the planetary mass regime (Chauvin et al. 2005; Luhman et al. 2005). Two main classes of models have been proposed for the formation of substellar objects. In the standard formation scenario, BDs form like stars, through (turbulent) gravitational collapse and fragmentation of very low mass cores, followed by subsequent disk accretion. In the ejection model, BDs are stellar embryos ejected from their parent core either early in their evolution from dynamically unstable multiple protostellar systems (Reipurth & Clarke 2001), or through secular dynamical decay in dense embedded clusters (Sterzik & Durisen 2003; Kroupa & Bouvier 2003a). These two models are not mutually exclusive; other mechanisms are also discussed in the literature (e.g., Whitworth & Goodwin 2005, Whitworth et al. 2006).
The Taurus region has been extensively studied for star formation. It is young (1-5 Myr), so the dynamical effects remain limited. It extends over a large region, so it can be studied for large spatial distribution effects; there are no bright stars to irradiate and disturb the stellar surroundings. Our study is based on a sample of 33 BDs in the Taurus cloud as presented in Guieu et al. (2006) and references therein. With such a number of objects at hand, we can now begin statistical studies. With the aim of studying the proportion of Taurus BDs that harbor an accretion disk, we have combined Guieu et al. (2006) optical photometry with 2MASS data and recent Spitzer 3.6 to m data to determine the spectral energy distributions (SEDs) of BDs in the Taurus cloud.
Numerous studies have attempted to distinguish between the two principal models of BD formation by examining the circumstellar disks of young brown dwarfs. For instance, there is now ample evidence that, like their more massive counterparts, Taurus BDs experience a T Tauri phase. Broad asymmetric H emission profiles characteristic of accretion have been found; see, e.g., Jayawardhana et al. (2003) and Muzerolle et al. (2005). band excesses have been detected in Taurus substellar sources, indicating a disk frequency % (Liu et al. 2003). Recently, Whelan et al. (2005) have detected an outflow from a BD by spectroastrometry. It has often been argued that the presence of accretion and/or outflow activity in BDs is evidence that brown dwarfs form like stars (i.e., are not ejected). However, current star formation models (see e.g., Bate et al. 2003) show that the majority of remnant disks in brown dwarfs have radii less than 20 AU; these calculations do not possess a resolution sufficient to follow the fate of these disks after ejection. Hence the possibility remains that BDs can retain a disk even when they are ejected. With an accretion rate of (Muzerolle et al. 2005), even a disk would survive a few Myr, a lifetime consistent with the age of Taurus.
In this paper, we present complete photometry available on those 23 BDs in Taurus for which Spitzer data are available, from the visible to m (Section 2). We combine this large range of photometry with other observations such as spectral types to further aid in interpretation. We sort these SEDs depending on the presence of an infrared excess and we fit these excess-bearing sources with a disk model (Section 3). We discuss the implications of our results for BD formation models in Section 4.2.
2 Observations and results
2.1 Observations
Table 1 lists the names, spectral types, temperatures, and the photometric measurements described in this section for the 23 BDs for which Spitzer photometry is available. The observations reported here have been collected with various instruments from the visible to the infrared range. Not all objects have been measured in every photometric band available.
Mid-infrared photometry has been obtained with the IRAC (at effective wavelengths of 3.6, 4.5, 5.8, and m; Fazio et al. 2004) and MIPS (24, 70, and m, Rieke et al. 2004) instruments on board the Spitzer Space Telescope (Werner et al. 2004). The Spitzer fluxes were extracted from the mosaic images obtained as part of General Observer program 3584 (PI: D. Padgett) for wide area () mapping of the Taurus cloud (Guedel et al. 2006). The observations were carried out in February and March 2005, with exposures at two epochs several hours apart to provide for asteroid rejection in this low-ecliptic-latitude region. Photometry was performed using the APPHOT and PHOTCAL packages in IRAF. We measured fluxes within an aperture radius of 3 pixels (3.′′6) and applied aperture corrections to 8 pixels (9.′′6) for IRAC bands. At 24 microns, we used 3 pixel (7.′′4) apertures and corrected the flux to 11 pixels (27.′′0); at 70 microns, we also used 3 pixel (29.′′5) apertures and corrected the flux to 8 pixels (78.′′7). The aperture corrections from 3 pixels to 8 or 11 pixels were derived based on the photometry of bright isolated point sources in the mosaic images. The fluxes were measured at each individual epoch, then averaged to obtain the final values. We have computed the corresponding magnitudes adopting IRAC zero magnitude flux densities of 280.9, 179.7, 115.0, and 64.13 Jy in the 3.6, 4.5, 5.8 and 8 micron bands, respectively (Reach et al. 2005); for MIPS, we used zero points of 7.14 Jy for the 24 micron band and 0.775 Jy for the 70 micron band, based on the MIPS Data Handbook. The uncertainty on the absolute calibration is 10% for the IRAC bands and 24 m, and 20% for 70 m measurements.
The IRAC fluxes for 23 Taurus BDs are shown in Table 1. CFHT-Tau_12 and KPNO-Tau_9 were not observed at all IRAC bands. Eleven sources were detected at m, and just one source (J04442713+2512164) was detected at m, with an uncertainty of 0.2 mag. The upper limits of undetected sources are 0.9 mJy at m, and mJy at m, depending on the background level due to the cloud emission. The error bars are within the size of the symbol in Figure 2, except for the 70 m measurement. Note that IRAC photometry for objects KPNO-Tau 4 to 7 and GM Tau has already been published in Hartmann et al. (2005).
We have also used the 2MASS catalog to obtain , and band photometry for the whole sample of Taurus BDs. The transformation between 2MASS photometry and absolute flux has been performed using the zero-point fluxes from Cohen (2003), specifically 1594, 1024, and 666.7 Jy for , and bands, respectively.
The optical data come from several telescopes. We have obtained photometry using CFHT12k and Megacam cameras on the Canada-France-Hawaii telescope for 16 BDs. In addition, 8 BDs possess photometry obtained with the same instruments. The main characteristics of this photometric observations are presented in Guieu et al. (2006). Additional visible photometric data have been obtained from Briceno et al. (2002), Luhman et al. (2003), and Luhman (2004).
| Name | SpT | Av | R | I | J | H | K | [3.6] | [4.5] | [5.8] | [8.0] | 24 | 70 |
|---|---|---|---|---|---|---|---|---|---|---|---|---|---|
| mJy | |||||||||||||
| CFHT-Tau_9∗ | M6.25 | 0.91 | … | 15.35 | 12.88 | 12.19 | 11.76 | 11.14 | 10.86 | 10.45 | 9.80 | 12.00 | 57.20 |
| KPNO-Tau_4 | M9.50 | 2.45 | 20.54 | 18.75 | 15.00 | 14.02 | 13.28 | 12.52 | 12.34 | 12.14 | 12.10 | 0.89 | 57.20 |
| CFHT-Tau_15 | M8.25 | 1.30 | … | 17.94 | 14.93 | 14.24 | 13.69 | 13.19 | 13.16 | 13.04 | 13.04 | 0.89 | 57.20 |
| KPNO-Tau_5 | M7.50 | 0.00 | 19.10 | 15.08 | 12.64 | 11.92 | 11.54 | 11.03 | 10.99 | 10.90 | 10.84 | 0.89 | 57.20 |
| KPNO-Tau_6∗ | M9.00 | 0.88 | 20.56 | 17.90 | 14.99 | 14.20 | 13.69 | 13.08 | 12.79 | 12.47 | 11.68 | 1.65 | 75.80 |
| CFHT-Tau_16 | M8.50 | 1.51 | … | 17.91 | 14.96 | 14.24 | 13.70 | 13.26 | 13.16 | 13.01 | 12.97 | 0.89 | 57.20 |
| KPNO-Tau_7∗ | M8.25 | 0.00 | … | 17.16 | 14.52 | 13.83 | 13.27 | 12.59 | 12.27 | 11.90 | 11.22 | 2.29 | 57.20 |
| CFHT-Tau_13 | M7.25 | 3.49 | … | 17.90 | 14.83 | 13.97 | 13.45 | 12.74 | 12.73 | 12.84 | 12.60 | 1.20 | 72.20 |
| CFHT-Tau_7 | M6.50 | 0.00 | 16.63 | 14.12 | 11.52 | 10.79 | 10.40 | 9.83 | 9.91 | 9.70 | 9.69 | 1.41 | 134.00 |
| CFHT-Tau_5 | M7.50 | 9.22 | … | 18.79 | 13.96 | 12.22 | 11.28 | 10.48 | 10.25 | 10.03 | 10.01 | 0.94 | 57.20 |
| CFHT-Tau_12∗ | M6.50 | 3.44 | … | 16.26 | 13.15 | 12.14 | 11.55 | … | … | … | … | 3.38 | … |
| CFHT-Tau_11 | M6.75 | 0.00 | … | 14.88 | 12.53 | 11.94 | 11.59 | 11.13 | 11.09 | 10.96 | 10.96 | 0.89 | … |
| KPNO-Tau_9 | M8.50 | 0.00 | … | 18.76 | 15.48 | 14.66 | 14.19 | 13.51 | … | … | … | 0.89 | … |
| CFHT-Tau_2 | M7.50 | 0.00 | … | 16.81 | 13.75 | 12.76 | 12.17 | 11.54 | 11.41 | 11.32 | 11.33 | 0.89 | 65.90 |
| CFHT-Tau_3 | M7.75 | 0.00 | … | 16.88 | 13.72 | 12.86 | 12.37 | 11.78 | 11.69 | 11.61 | 11.59 | 0.89 | … |
| J04380083+2558572 | M7.25 | 0.64 | 20.21 | 14.71 | 11.54 | 10.62 | 10.10 | 9.56 | 9.45 | 9.31 | 9.28 | 1.22 | 79.00 |
| J04381486+2611399∗ | M7.25 | 0.00 | 20.33 | 17.84 | 15.18 | 14.13 | 12.98 | 10.77 | 10.19 | 9.66 | 8.91 | 62.80 | 70.70 |
| GM_Tau∗ | M6.50 | 4.34 | … | 15.04 | 12.80 | 11.59 | 10.63 | 9.25 | 8.76 | 8.38 | 7.80 | 46.30 | 103.00 |
| CFHT-Tau_6∗ | M7.25 | 0.41 | 18.40 | 15.40 | 12.64 | 11.84 | 11.37 | 10.72 | 10.44 | 10.00 | 9.11 | 15.90 | 81.50 |
| CFHT-Tau_4∗ | M7.00 | 3.00 | … | 15.78 | 12.17 | 11.01 | 10.33 | 9.48 | 9.06 | 8.58 | 7.79 | 66.00 | 77.80 |
| CFHT-Tau_8∗ | M6.50 | 1.77 | 19.28 | 16.43 | 13.17 | 12.12 | 11.45 | 10.83 | 10.31 | 9.86 | 9.18 | 16.80 | 57.20 |
| J04414825+2534304∗ | M7.75 | 1.06 | … | 17.03 | 13.73 | 12.80 | 12.22 | 11.37 | 10.88 | 10.43 | 9.53 | 18.40 | 57.20 |
| J04442713+2512164∗ | M7.25 | 0.00 | … | … | 12.20 | 11.36 | 10.76 | 9.51 | 8.99 | 8.33 | 7.40 | 124.00 | 157.00 |
2.2 SEDs and infrared excesses
We have plotted the SEDs in Figures 1 and 2 for all Taurus BDs with available IRAC photometry. The SEDs are sorted depending on the presence of an IR excess determined as explained below. On the same plots, we have superimposed a photospheric fit using the DUSTY models from Allard et al. (2000). Each model has been fit using the BD’s temperature and visual absorption previously published in the literature combined with the Draine (2003a, 2003b, 2003c) extinction law. Following Natta and Testi (2001), who show that BD disk excess emission becomes clearly detectable only longward of m, we have fit the DUSTY models to the available data points just in the , , , and bands. We decide that a given source has an IR excess when the IRAC photometry exceeds the photospheric SED by more than one sigma. For some sources (e.g., CFHT-Tau 2), the IRAC measurements fall somewhat above the SED but the slope of the points is the same as the underlying photosphere. In such cases, we conclude that it is more likely that the shift comes from a small fit mismatch rather than from a real IR excess. The only exception to this rule is CFHT-Tau 12, which was not observed with IRAC, but shows a confirmed detection at m. We have thus placed this BD in the IR excess list.
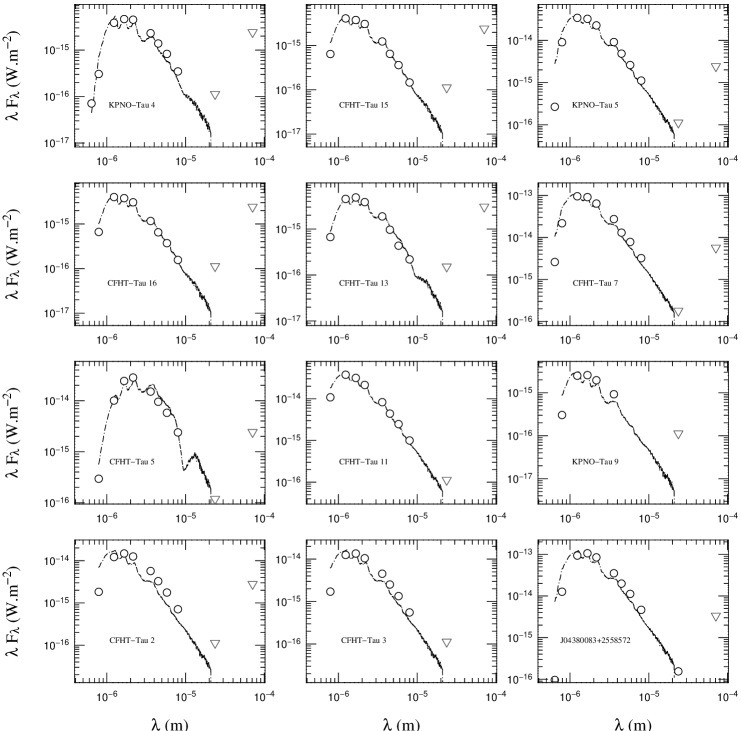
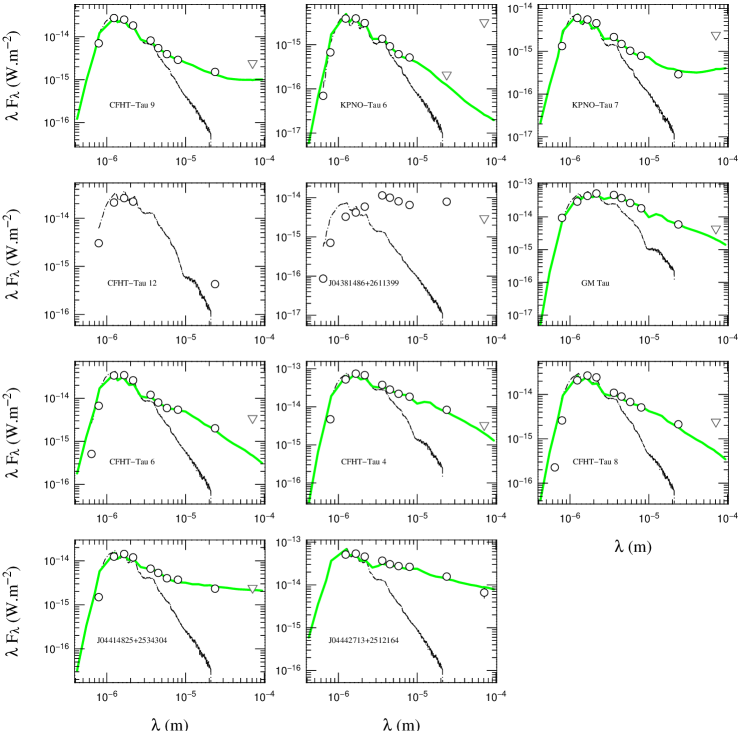
As a preliminary conclusion, we find that 11 objects out of 23 have a significant IR excess, suggesting that of Taurus BDs possess disks. We computed the uncertainty on this percentage using simple Poisson statistics on the number of BDs with disks. This proportion is very similar to the one of classical T Tauris (CTTs) among T Tauri stars in Taurus (Hartmann et al. 2005), and is fully consistent with the proportion of BDs with disks found by Luhman et al. (2005) in IC 348 and Cha I. In section 3, we will present the models used to fit the SEDs with infrared excesses. These fits are superimposed on the objects’ SEDs plotted in Figure 2. We could only fit 9 out of 11 SEDs for reasons explained in Section 3. In the following paragraphs, we explore other physical parameters to study the presence of disks around our objects.
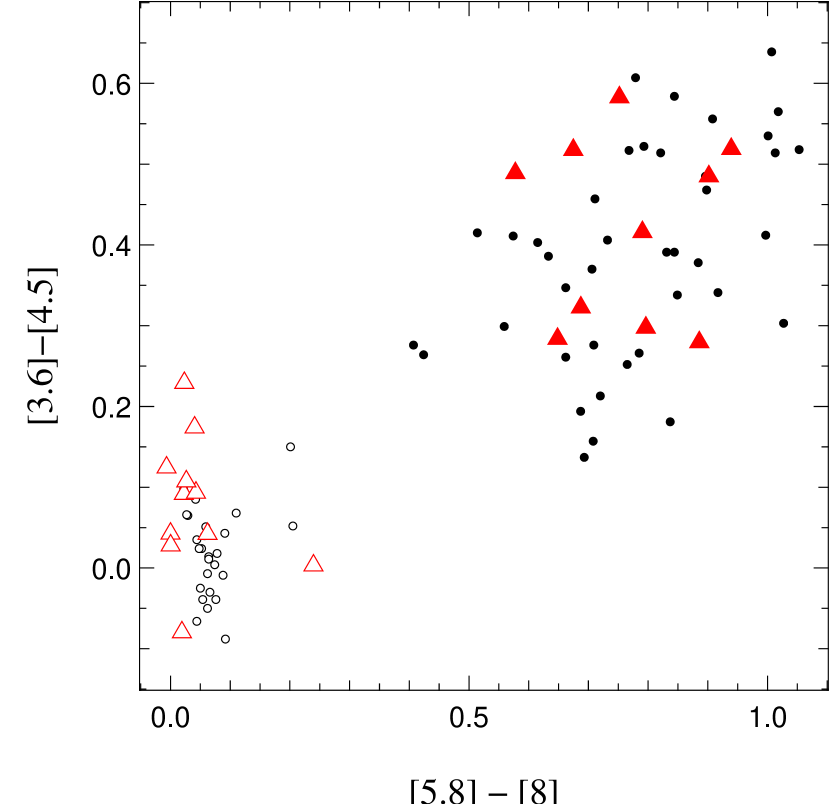
2.3 Spitzer color-color diagrams
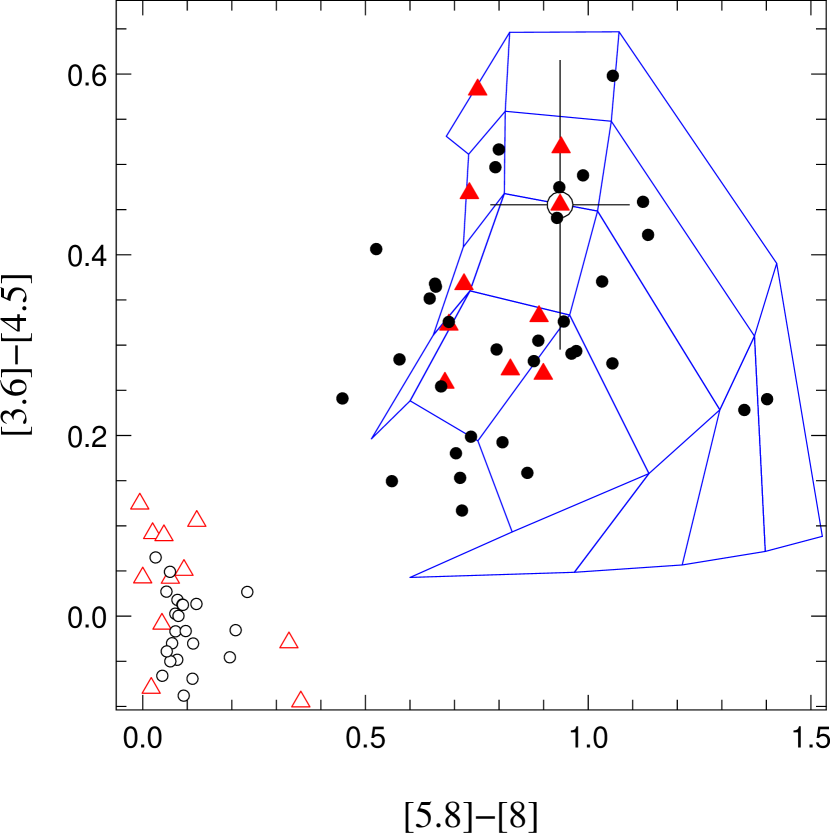
In the previous section, the presence or absence of a disk around a BD is inferred more from the slope of the IRAC data than from the actual value of the IRAC data compared to the photospheric fit. To confirm our results, we have plotted in Figure 3 the Spitzer [3.6][4.5] vs. [5.8][8] color-color indices for all the BDs where the photometry is available. The data are plotted as full / empty triangles depending on the presence / absence of an IR excess in the SED. We find that the Taurus BDs are essentially plotted in two distinct regions, identical to the ones found for T Tauri stars (TTS) by Hartmann et al. (2005). We interpret the distinction between these two regions as due to the presence or absence of circumstellar dust, in a way consistent with the classification adopted to sort the SEDs in Figures 1 and 2. On the same figure, we have superimposed the data points from Hartmann et al. (2005) as open / filled circles for Taurus class II/III stars. There appears to be no clear segregation between BDs and TTS colors when they have a disk. In contrast, in the lower left corner of the plot, BDs without disks tend to be redder on the average than their WTTS equivalents as measured by the [3.6][4.5] index. Figure 3 shows that CTTs and BDs with infrared excesses appear indistinguishable, consistent with their emission being dominated by their disks in both cases, while the WTTs and BDs without disks can be distinguished by their photospheric colors.
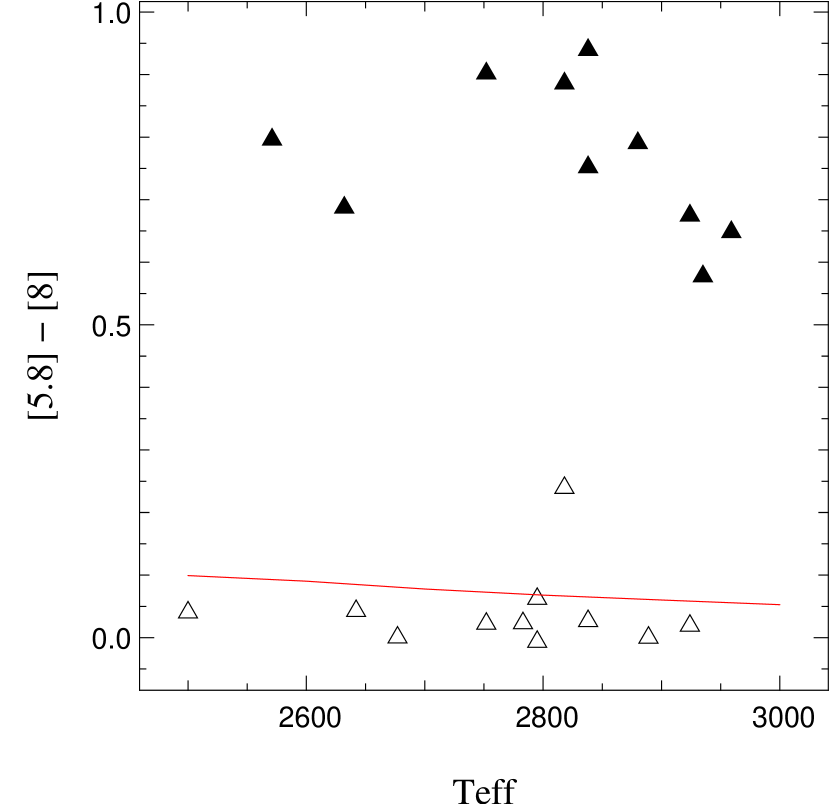
In Figure 4 we have plotted the IRAC [5.8][8] color index versus the underlying effective temperature of the corresponding photosphere. Again, there is a clear gap of about 0.7 mag between the BDs with and without disks, with no clear dependence of the color index on the central object effective temperature, hence its mass, at a given age.
2.4 Accretion signatures
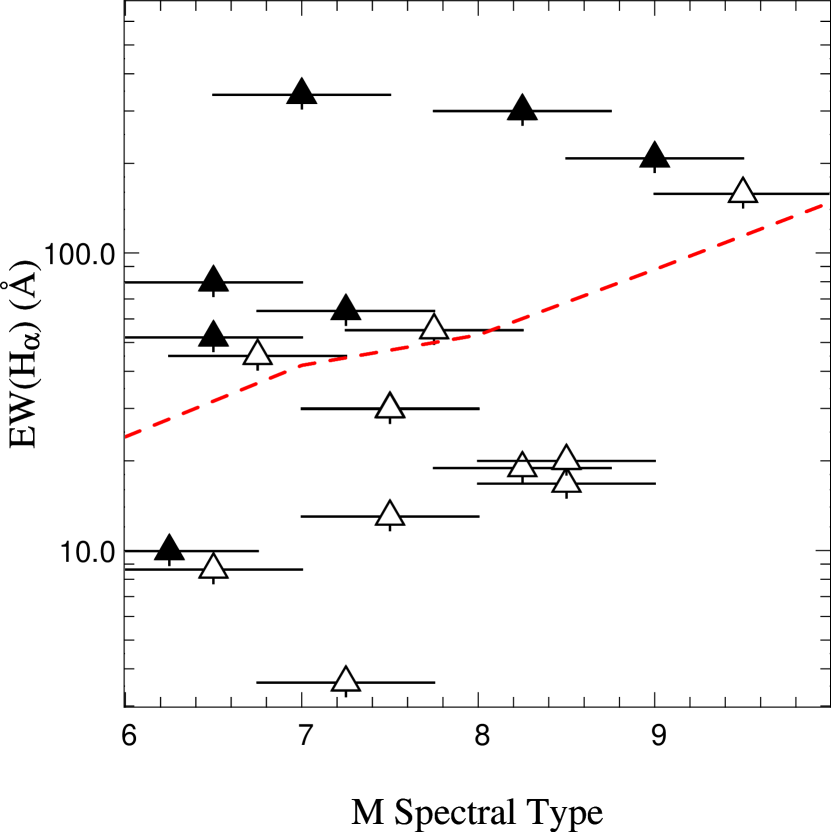
In Figure 5, we have plotted the H equivalent width (EW; Guieu et al. 2006; Briceño et al. 2002) from spectra obtained with moderate resolution () versus spectral type for all BDs where Spitzer photometry and EW(H) are available (filled triangles: BDs with disks; empty triangles: BDs without disks). The empirical CTTS/WTTS boundary extended to substellar analogs, defined by Barrado y Navascués and Martín (2003), is delineated by the dashed line. This boundary is defined by the saturation limit for chromospheric activity ().
There is a general agreement between the accretion / non accretion limit from Barrado y Navascués and Martín (2003) and our disk / no disk criterion. All but one of the BDs with disks have an H emission level in excess of that expected from chromospheric activity, suggesting that most BDs with disks are experiencing an accretion phase, or a jet. Moreover, although we are dealing with small numbers, there appears to be two groups of accreting BDs in our data: BDs with EWÅ are strong accretors, while objects with EWÅ may have stopped significant accretion and be surrounded by more passive disks, analogs to the one described in McCabe et al. (2006).
As the H EW might not provide an unambiguous accretion status of a given object, we have compared our results with those from Mohanty et al. (2005). They study the accretion in BDs using the H 10% width. Among the 23 sources studied in this paper, 9 were observed by Mohanty et al. (2005). We find that among our 11 sources classified as BDs with disks, 3 are found to be accreting by Mohanty et al., and one is found to be a possible accretor with an H 10% width = 150 km s-1 (their accretion limit is at 200 km s-1). Moreover, this latter object is CFHT-Tau 4, which was found by Pascucci et al. (2003) to harbor a disk, as shown by its mm emission. In our H measurements, we find that CFHT-Tau 4 has an H equivalent width of 300 km s-1. Additionally, among the 12 sources we classify as BDs without disks, 4 are found to be non-accretors by Mohanty et al. (2005), and one is a possible accretor (KPNO-Tau 4). Using this limited overlap between the Mohanty et al. (2005) data and ours, we can conclude that there is a correlation between our accretion classification and theirs. If we ignore the objects that appear as intermediate, or passive, the presence of a disk inferred from the IR excess is thus highly correlated to the presence of accretion.
As a word of speculation, it could be noted that there is a small mismatch between the accretion limit and our three low EW(H) objects; the difference falls within the error bars, although the shift is in the same direction for all three objects. Rather than speculating about possible remnant accretion in BDs without strong disks, it could be possible that the extension in the BD domain of the boundary drawn by Barrado y Navascués and Martín (2003) has to be offset by to fit our new data points. Indeed, if we raise their limit by this amount, it nicely follows our BDs without disks (open triangles) leaving all the low-accreting BDs with disks below the chromospheric activity limit.
2.5 Brown dwarfs spatial distribution
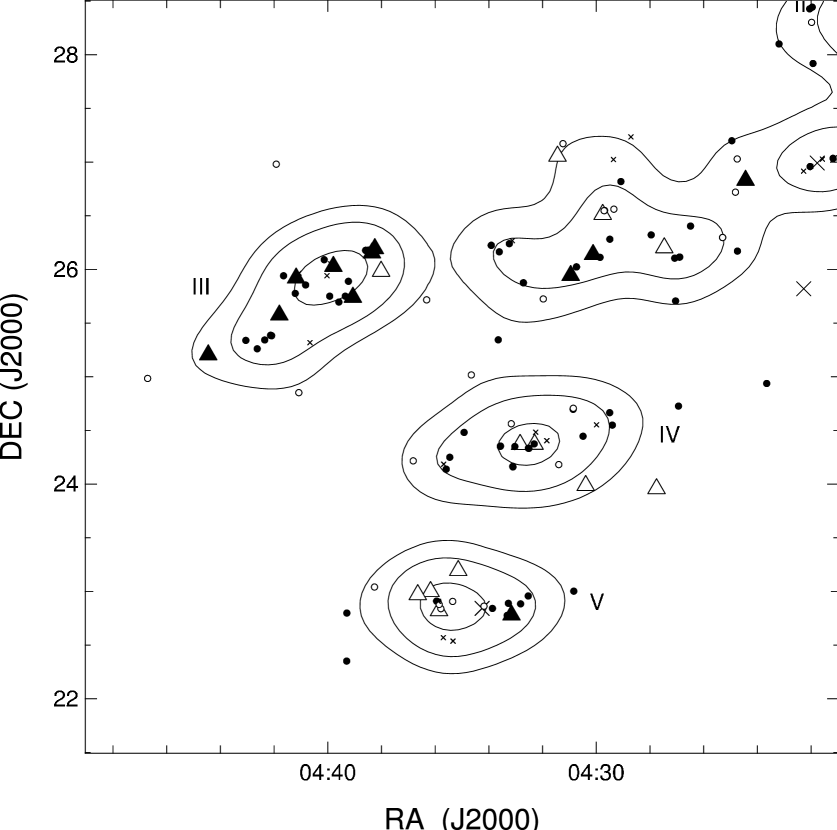
Figure 6 shows the spatial distribution of our objects, superimposed on the aggregates defined by Gomez et al. (1993) plotted as stellar isodensity peaks; we label them from III to V accordingly (the aggregate in the upper right part of the figure was not labeled by Gomez et al. 1993). We plot isodensity contours at 3, 6 and 12 stars per square degree. BDs with disks are plotted as filled triangles and BDs without disks are plotted as open triangles. We also show the positions of the class I+II and III (C/W) T Tauri stars of the Taurus population, as compiled from Kenyon and Hartmann (1995), White and Ghez (2001), Hartmann et al. (2005), and Andrews and William (2005). We find that, although globally, the fraction of BDs with disks is about 50%, BDs with and without disks are not distributed regularly. For instance, aggregate III has 7 out of 8 BDs with disks, while aggregate V has 4 out of 5 BDs without disks, the remaining one being BD CFHT-Tau 12, which has the lowest IR excess from all the sample at m. We have also counted the proportions of class I+II and III (C/W)TTs in the aggregates, inside the 3 star/deg2 contour. The proportions of CTTs and BDs with disks in the various aggregates where this information is available are listed in Table 2. We have also listed the (binomial) probability to get the aggregate BD disk proportion if a given BD has a 48% probability to get a disk. Given the uncertainty on the proportion of BDs with disks, the numbers listed in Table 2 are not absolutely inconsistent with an overall 50% disk frequency, although with rather low probability. Indeed, if the probability for a BD to have a disk falls down to its lowest value (34%), there is a 20% chance to find the repartition (0/4) in aggregate IV. However, this ensemble of results could be evidence of different physical conditions in the various aggregates. We come back to this point in Section 4.2.
In order to check if there is a difference of spatial position of the BDs with and without disks relative to the stellar aggregates, we have checked a series of estimators: i) We have computed the average distance to the nearest star for BDs with and without disks, and found no significant difference between the two. ii) The average distance from a BD with and without disk to its nearest aggregate center are similar. iii) We have also computed the weighted stellar density where each BD stands, using the Kernel method (Silverman 1986), and we find no significant difference between BDs with and without disks.
| Aggregate | III | IV | V |
| CTTS | 15/18 | 15/19 | 8/13 |
| BD disks | 7/8 | 0/4 | 0-1/5 |
| Probability | 2.4% | 7% | 3.8-17 % |
3 Disk models
In order to estimate the distribution and the amount of material present in the disks around the BDs showing an IR excess, we have used a 3D Monte-Carlo continuum radiative transfer code (MCFOST, see Pinte et al. 2006), to model the SEDs of the BDs with IR excess. Our model includes multiple scattering with passive dust heating, assuming radiative equilibrium and continuum thermal re-emission.
3.1 Dust distribution in the disk
We use a density distribution with a Gaussian vertical profile , assuming a vertically isothermal, hydrostatic, non self-gravitating disk. We use power-law distributions for the surface density and the scale height where is the radial coordinate in the equatorial plane, the scale height at the radius . The disk extends from an inner radius to an outer limit radius . The central star is represented by a sphere radiating uniformly with photosphere parameters extracted from the literature (Guieu et al. 2006 and references therein) and the corresponding synthetic brown dwarf spectra of Allard et al. (2000) shown in Figure 1 and 2.
3.2 Dust properties
We consider homogeneous spherical grains and we use the dielectric constants described by Mathis & Whiffen (1989) in their model A, with typical interstellar medium values. The differential grain size distribution is given by with grain sizes between m and m. The mean grain density is g cm-3 to account for fluffiness. Extinction and scattering opacities, scattering phase functions and Mueller matrices are calculated using Mie theory. Dust and gas are assumed to be perfectly mixed and grain properties are taken to be independent of position within the disk. The total disk mass (gas+dust) is fixed at , assuming a gas to dust mass ratio of 100.
3.3 Model fitting
The fits were performed using a grid of SED models built by variation of 5 free parameters whose values are listed in Table 3.
| Parameter | range values | ||||
|---|---|---|---|---|---|
| 0.015 | 0.032 | 0.067 | 0.14 | 0.3 | |
| 0.0 | 1.0 | 1.125 | 1.25 | ||
| -0.5 | -1 | -1.5 | |||
| 0.02 | 0.04 | 0.06 | 0.08 | 0.1 | |
| from 0.05 to 0.95 by steps of 0.1 | |||||
For each object, the models are sorted following a pseudo- minimisation. We decide that a parameter value is acceptable when the corresponding value is less than twice the of the best model. For each model SED, we compute its Spitzer colors in the 3.6, 4.5, 5.8 and 8 m bands and we plot them in the [3.6][4.5] vs. [5.8][8] color color diagram. Using this diagram as a diagnostic tool, we find that when we vary , , and , the corresponding color points are spread randomly across the diagram. In contrast, the variation of and define a coherent grid across the diagram. Figure 7 shows the deredened TTS and BD color points superimposed on such a model grid obtained for varying in the range listed in Table 3 ( values). Each point is computed for a given couple, with all the results due to other parameters variations averaged. Of course, the result of a given model depends on the central object used to compute the surrounding disk parameters. In Figure 7, we show all the objects’ color-color points but only one model grid, computed using the central object with corresponding color-color point encircled.
In regard to the flaring exponent, we find that none of our sources can be fitted convincingly by a flat disk model () or by a highly flaring model (). In Table 4 we list the values obtained by our fitting procedure described above.
. Object (AU) CFHT-Tau 9 0.02 0.032-0.067 1.125 KPNO-Tau 6 0.02 0.032 1.0-1.125 KPNO-Tau 7 0.04 0.015 1.0-1.125 GM Tau 0.06-0.1 0.015-0.067 1.0 CFHT-Tau 6 0.04 0.067-0.14 1.0-1.125 CFHT-Tau 4 0.04-0.06 0.14-0.3 1.0 CFHT-Tau 8 0.04-0.06 0.015-0.067 1.0-1.125 J04414825+2534304 0.06 0.015-0.032 1.125 J04442713+2512164 0.1 0.032-0.067 1.125
Our disk fitting procedure does not address the entire disk parameter space. Indeed, even the m Spitzer photometry only probes the inner part of the disk on a scale AU, so that most of the disk mass remains hidden in the outer parts of the disk. In our disk model, 75% of the disk energy comes from the inner 1 AU and 90% comes from the inner 3 AU. We stress that our model is able to compute the SED up to mm, where the disk is optically thin, so future mm measurements of the disks around our BD sample will be very valuable to estimate their mass. However, our results show that for all the sources that we have fitted, we can rule out a disk structure without flaring, showing that in all the BD disks sampled in this study, the disk retains a significant amount of gas. This is consistent with the level of accretion observed in almost all BDs with infrared excess.
In our modeling, the disk structure is described by parametric laws. Nevertheless, the dust scale height inferred from the best models was compared with the hydrostatic scale height (computed from the disk temperature and corresponding to the gas scale height). The dust scale height is marginally smaller than, but compatible with, the hydrostatic scale height.
The fitted SEDs are superimposed on the objects’ SEDs in Figure 2. Only 9 fits are displayed there because we could not find a satisfactory fit result either for CFHT-Tau 12 or for J0438+2611. For the former object, this is because of the lack of Spitzer photometry. For the latter, the SED of this object is the only one in the sample to show such a rise toward longer wavelengths. We interpret this behavior as being due to the peculiar orientation of the disk around the BD, close to edge-on (Luhman 2004). Moreover, if it were not for the higher emission in the m domain, this source is the weakest one of the sample, consistent with a thick disk occulting the central object.
3.4 Comparison with other models
Strictly speaking, our study concerns the proportion of BDs with inner disks only. Here, we compare our results with the ones of Scholz et al. (2006) who have surveyed the 1.3 mm emission of Taurus BDs to study the properties of their colder (hence farther) disks. Out of 12 objects in common between their study and ours, only two show NIR IRAC excess emission without outer cold mm emission. All the BD with cold outer mm emission have IRAC emission in excess over the photosphere model, hence were classified as ”BD with disk” in our study. We have compared our disk parameters with the ones derived by Scholz et al. (2006) from their model of the objects CFHT-Tau 4, CFHT-Tau 6, and J044427+2512. When Scholz et al. (2006) detect a disk, they measure a disk mass between 0.4 and 1.2 , i.e., a range of values consistent with our choice to fix the disk mass at (see section 3). Similarly, they use an index when we find values ranging from to . They use an external radius AU when we use AU, again a consistent value. If we compute the disk scale height at the stellar radius, the relative difference with theirs is less than 25%. Finally, if we add the Scholz et al. mm point to our SED when it is available, we find that our model SED matches this new measurement to within a factor of 2. Given the remaining uncertainties, we estimate that our models are consistent with Scholz et al. results.
4 discussion
4.1 BD distribution relative to stars
In section 2.5, we found that there is no significant difference between BDs with and without disks relative to the stars. If BDs without disks are actually ejected objects, our data suggest that they have not had the time to travel away from their parent aggregate, or the aggregate stars have also been ejected with a similar velocity dispersion, as described in Bate & Bonnel (2005). It is also possible that for low density agregates such as the one found in Taurus, the comparison of the BD spatial distribution relative to the surrounding stellar population is not always a discriminant diagnostic. Goodwin et al. (2005) have modeled the evolution of low density cores and find that in some cases, the differences between the two distributions (stars and BDs) can disappear.
4.2 Spatial distribution of BD with and without disk
We find that the global proportion of BDs with and without disks in Taurus is similar to the C/W TTS global proportion in the same region. If disks are a robust tracer of the main star formation route, this shows that the BD formation process has a lot in common with that of the stars, and thus ejection by itself cannot be invoked to explain a possible difference between BD and stellar formation. The fact that this global proportion is also very similar to the one found by Luhman et al. (2005) in IC348 and Cha I star forming regions with different stellar density and physical parameters but similar ages, shows that the resulting proportion of BD with disks in a given region does not depend directly on the local stellar density, hence on the local physical parameters, or on the outcome of possible ejections.
One of the most intriguing result of our study is the strong variation of the proportion of BD with disks among the Taurus aggregates, with a global proportion very close to 50% at large scale. If on average there is a 50% probability for a BD to harbor a disk, then the fact that the aggregate number III harbors 7 out of 8 BDs with disks is quite improbable (3%). On the other hand, in aggregate V, 4 out of 5 BDs are found without disks. Moreover the remaining BD in this latter aggregate is CFHT-Tau_12, which possesses the lowest IR excess of all the sample with disks.
In order to check if this difference could be an age effect, we have used an HR diagram to compute the age of the objects present in all the aggregates. The ages are spread between 1 and 10 Myr, but on the average, the objects in aggregate III do not appear significantly younger than the ones in aggregate IV. Thus the higher proportion of BDs with disks in aggregate III can not be explained by an time evolution effect alone.
On the other hand, aggregates III and IV have similar stellar densities and have opposite BDs repartitions with respect to the presence of a disk. This is another clue that similar stellar densities can result in different outcomes with respect to the proportion of BDs with disks. Either there can be large fluctations in the ejection rate with such low stellar densities, or the ejection process itself can have large efficiency variations in removing BD disks.
Goodwin et al. (2005) have modeled the evolution of cores containing small numbers of stars and BDs, as they eject their lowest-mass members. Two of their findings appear to be relevant here: i) the spatial distribution differences between stars and BDs can disappear depending on the initial clustering conditions; ii) for clusters of young age such as Taurus, a significant difference in the spatial distributions of stars and BDs is seen in only 1 out of 5 simulations. Then we can speculate that numerical simulations of low density aggregates with a few tens of stars can produce situations where BDs may lose their disks in short times, but also can retain their disk for long times. In order to be compared to our results, such simulations should be able to follow the fate of very small disks.
4.3 Brown dwarfs and the molecular gas in Taurus
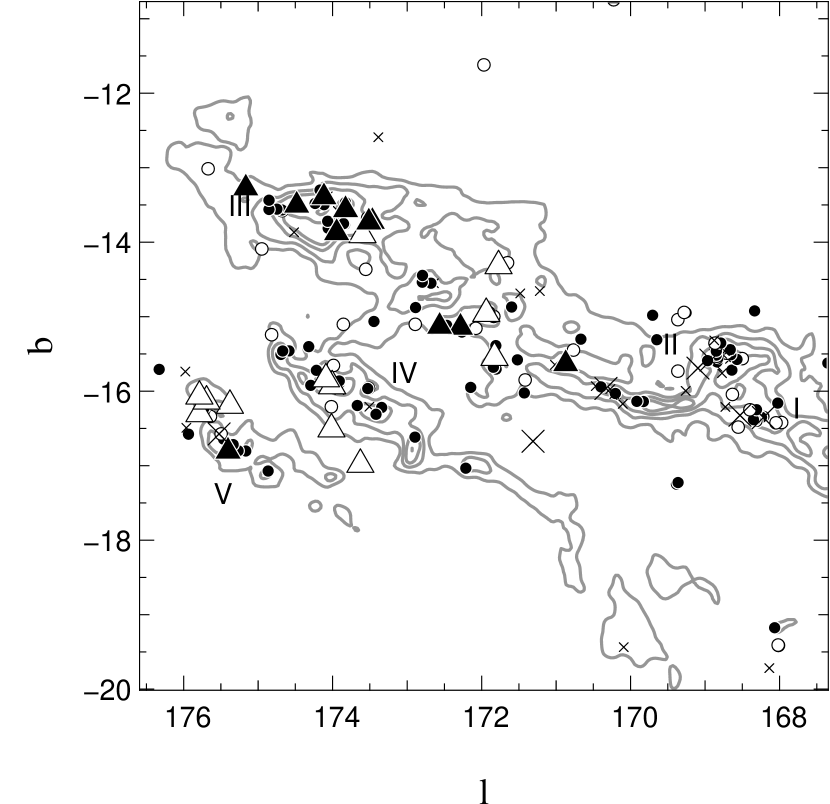
In order to study a possibly more discriminant diagnostic than the nearest neighbour distance for stars and BDs, we have considered the spatial distribution of BDs (with and without disks) relative to the underlying cluster gas. In Figure 8, we have plotted the 13CO map adapted from Mizuno et al. (1995) superimposed on the BD and C/W-TTS populations in galactic coordinates. Three main filaments appear on this figure, showing that the odd BD repartition might in fact be related to their position relative to the filaments. Lepine & Duvert (1994) have proposed that the Taurus filaments result from a collision between a high velocity cloud and the galactic plane. If the corresponding wave proceeds from , then the leading southern filaments are somewhat older than the northern denser, trailing one where stellar formation would be more recent, consistent with a higher proportion of CTTs and BDs with infrared excess in this filament. Note that all the BDs found to have a mm disk by Scholtz et al. (2006) are also found in the northern filament, with a concentration of such BDs in aggregate III. However, the projected distance between the filaments corresponds to less than yr for a wave traveling at a few km/s, a time difference possibly too short for significant evolution effects to take place. This evolution problem is even more crucial if one considers that the unnamed aggregate between II and III has a BD disk frequency of 50%. Once again, a time evolution effect by itself cannot be invoked to explain the repartition of BDs with and without disks in the Taurus filaments. We have compared the level of 13CO emission at the position of the BDs with and without disks and we find that BDs with disks are placed at positions where the average 13CO emission () is almost two times larger than for the BDs without disks (), although with large uncertainties. This result mainly comes from the fact that the BDs with disks are almost all found in the northern filament where the 13CO emission is the strongest. As 13CO emission is optically thin, this could suggest that aggregates where the gas is denser have produced objects with larger disks.
Finally, if the three filaments yet correspond to a time evolution series from the supposedly youngest III to the oldest V, there is a possibility that we are witnessing a time evolution difference between BDs with disks and T Tauri stars with disks. The C/W-TTS proportion is high in filaments III and IV (consistent with them being younger) and similar to the one over the Taurus cloud () in filament V. However, the BDs in filament IV have already lost all their disks when TTS retain a significant amount of disks there. If this effect is real, this could be an evidence of a central object mass effect on its disk lifetime. A similar effect has been reported by Lada et al. (2006) in IC 348 where the disk fraction appears to be a function of spectral type and stellar mass. Although appealing, strong issues remain: i) we could not clearly find a significant age difference between the objects found in the three filament; ii) this result is in contradiction with a disk lifetime (e.g., Alexander & Armitage 2006). Clearly more observational and theoretical work is needed to conclude about the question of a different lifetime in BD disks relative to TTS disks.
5 Conclusions
Using 0.6-70 m photometry, we have studied the disk properties around 23 young BDs in Taurus. Using optical to 2 m data, we fit a photosphere model from Allard et al. (2000) to all our objects. From their SEDs, we distinguish BDs with IR excesses (strongly suspected to have a disk) from BDs with no excess (BDs without disks). For the BDs showing an IR excess longward of 3 m, we have fit a disk model (Pinte et al. 2006) and derived the main disk parameters.
We find that of Taurus BDs show a circumstellar disk signature. This ratio is similar to the one observed among CTTS/WTTS in Taurus (Hartmann et al. 2005), and to recent results on BDs from Luhman et al. (2005) who derived a disk fraction of and around BDs in IC 348 and Chamaeleon I respectively. With our model, we find that disks around BDs in Taurus are all significantly flaring, indicating that heating by the central object is efficient and that the disks we observe retain a significant amount of gas. Using H EW measurements, we find that 6 out of 7 BD with disks (85%) are still significantly accreting.
We find that BDs with disks appear statistically more numerous in one of the Taurus filaments, specifically the northern one. As this filament also contains a very high proportion of CTTs relative to WTTs, this segregation could be due to a time evolution effect if the northern filament is the youngest one, a result pointing toward a similar formation & evolution process for stars and brown dwarfs + disks. However, the age difference between the different filaments appears too small to fully explain such a difference. Moreover, if the various aggregates are not exactly in the same evolutionary stage, our result could imply that the BDs belonging to an older aggregate have lost their circumstellar disk before the stars, implying that the disk lifetime depends on the mass of the central object, with BD disks having a shorter lifetime. This is in contradiction to a recent result from Alexander & Armitage (2006) who propose that BD disk lifetimes could be larger than the stellar ones. Alternatively, if all the Taurus aggregates have similar ages, and if ejection is the only process left to eliminate BD disks, then we are still to understand why ejection would result in so different outcomes in aggregates with similar stellar densities.
We also compared the underlying 13CO emission for BDs with and without disks and found that BDs with disks appear to be found with stronger molecular emission than BDs without disk, showing that the presence and/or the size of a disk around a BD could be linked to the underlying parent core gas density. There is no such effect when we compare the BD positions with the underlying stellar density, but Goodwin et al. (2005) concluded that a lack of difference between stars and brown dwarfs spatial distribution does not necessarily exclude the ejection scenario. Our current study of the spatial distribution of BDs and their disks does not allow us to distinguish between the two main BD formation models, although it provides another piece of evidence that ejection cannot be the only BD formation process (see e.g., Luhman et al. 2006). Clearly more numerical simulations using initial physical parameters closely matched to the Taurus aggregates and more observations to provide unambiguous constraints to these simulations, are needed to explain the stars and brown dwarfs spatial distribution as well as the evolution of their circumstellar environment with time, at a scale significantly smaller than 10 AU.
Last but not least, a possible by-product of our study is to recalibrate the Barrado y Navascués and Martín (2003) WTTS/CTTS limit in the substellar domain. The global shape of the limit fits our data points if it is raised by a factor 1.3.
Acknowledgements.
We thank Cathie Clarke and Anthony Whitworth for enlightening discussions about BD formation models, and an anonymous referee for a detailed report that helped clarify many points in our paper. This research has made use of the CDS database. F. M. thanks the “Center for long Wavelength Astrophysics” for supporting a visit at JPL. We thank the “Programme National de Physique Stellaire (PNPS, CNRS/INSU, France) for financial support.References
- (1) Allard, F., Hauschildt, P. H., Schweitzer, A. 2000, ApJ 539, 366
- (2) Alexander, R. D., & Armitage, P. J. 2006, ApJ Letter, 639, L83
- (3) Andrews, S.M., and Williams, J.P. 2006, ApJ 631, 1134
- (4) Baraffe, I., Chabrier, G., Allard, F., & Hauschildt, P. 1998, A&A 337, 403
- (5) Barrado y Navascués, D., Martín, E. 2003, AJ 126, 2997
- (6) Bate, M., Bonnell, I.A., & Bromm, V. 2002, MNRAS 336, 705
- (7) Bate, M., Bonnell, I.A., & Bromm, V. 2003, MNRAS 339, 577
- (8) Bate, M., and Bonnell, I.A., 2005, MNRAS 356, 1201
- (9) Beckwith, S.V.W., Sargent, A.I., Chini, R.S., & Guesten, R. 1990, AJ 99, 924
- (10) Briceño, C., Hartmann, L., Stauffer, J., & Martín, E. 1998, AJ 115, 2074
- (11) Briceño, C., Luhman, K.L., Hartmann, L., Stauffer, J., & Kirkpatrick, J.D. 2002, ApJ 580, 317
- (12) Chabrier, G., Baraffe, I., Allard, F., & Hauschildt, P. 2000, ApJ 542, 464
- (13) Chauvin, G., Lagrange, A.-M., Zuckerman, B., Dumas, C., Mouillet, D., Song, I., Beuzit, J.-L., Lowrance, P., and Bessell, M. S., 2005, A&A 438, L29
- (14) Cohen, M., Wheaton, W.A., & Megeath, S.T., 2003, AJ 126, 1090
- (15) Delgado-Donate, E.J., Clarke, C.J., & Bate, M.R. 2004, MNRAS 247, 759
- (16) Draine, B.T., 2003a, ARAA 41, 241
- (17) Draine, B.T., 2003b, ApJ 598, 1017
- (18) Draine, B.T., 2003c, ApJ 598, 1026
- (19) Duchêne, G. 1999, A&A 341, 547
- Fazio et al. (2004) Fazio, G. G., Hora, J. L., Allen, L. E., Ashby, M. L. N., Barmby, P. et al. 2004, ApJS, 154, 10
- (21) Gomez, M., Hartmann, L., Kenyon, S.J., & Hewett, R. 1993, AJ 105, 1927
- (22) Goodwin, S. P., Hubber, D. A., Moraux, E. and Whitworth, A. P. 2005, A.N. 326, 1040
- (23) Goodwin, S.P., Whitworth, A.P., & Ward-Thompson, D. 2004a, A&A 419, 543
- (24) Goodwin, S.P., Whitworth, A.P., & Ward-Thompson, D. 2004b, A&A 423, 169
- (25) Guedel et al. 2006, in Protostars and Planets V, in press.
- (26) Guieu, S., Dougados, C., Monin, J.-L., Martín, E., and Magnier, E. 2006, A&A, 446, 485.
- (27) Guieu, S., Monin, J.-L., Dougados, C., Magnier, E. and Martin E. 2006, AN, 326, 1068
- (28) Hartmann, L., Megeath, S. T., Allen, L., Luhman, K., Calvet, N., et al. 2005, ApJ 629, 881.
- (29) Jayawardhana, R., Mohanty, S., & Basri, G. 2002, ApJ 578, 141
- (30) Jayawardhana, R., Mohanty, S., & Basri, G. 2003, ApJ 592, 282
- (31) Kenyon, S.J., Hartmann, L. 1995, ApJS 101, 117
- (32) Klein, R., Apai, D., Pascucci, I., Henning, Th., & Waters, L.B.F.M. 2003, ApJ 593, L57.
- (33) Kroupa, P., Bouvier, J. 2003a, MNRAS 346, 369
- (34) Kroupa, P., Bouvier, J. 2003b, MNRAS 346, 343
- (35) Lada, C.J., Muench, A.A., Luhman, K.L., Allen, L., Hartmann, L., Megeath, T., Myers, P. and Fazio, G., 2006, AJ 131, 1574.
- (36) Lépin, J., & Duvert, G. 1994, A&A 286, 60
- (37) Liu, M.C., Najita, J., & Tokunaga, A.T. 2003, ApJ 585, 372
- (38) Luhman, K.L. 2000, ApJ 544, 1044
- (39) Luhman K.L. 2004, ApJ 617, 1216
- (40) Luhman, K. L., Adame, L., D’Alessio, P., Calvet, N., Hartmann, L., Megeath, S. T., and Fazio, G. G. 2005, ApJ 635, L93
- (41) Luhman, K. L., Joergens, V., Lada, C., Muzerolle, J., Pascucci, I., and White R., 2006, in Protostars and Planets V, in press.
- (42) McCabe, C., Ghez, A.M., Prato, L., Duchene, G., Fisher , R.S., & Telesco, C. 2006, ApJ, in press.
- (43) Martín, E.L., Dougados, C., Magnier, E., Menard, F., Magazzu, A., Cuillandre, J.C., & Delfosse, X. 2001, ApJ 561, 195
- (44) Meyer, M.R., Calvet, N., & Hillenbrand, L.A. 1997, AJ 94, 288
- (45) Mizuno, A., Onishi, T., Yonekura, Y., Nagahama, T., Ogawa, H., Fukui, Y. 1995, ApJ 445, L161
- (46) Mohanty, S., jayawardhana, R., & Basri, G. 2005, ApJ 626, 498
- (47) Monin, J.-L., Dougados, C. and Guieu , S. 2005, A.N. 326, 996
- (48) Muzerolle, J., Luhman, K.L., Briceno, C., Hartmann, L., & Calvet, N. 2005, ApJ 625, 906
- (49) Muzerolle, J., Adame, L., D’Alessio, P., et al. 2006, ApJ., in press (astro-ph 0603104).
- (50) Natta, A. and Testi, L. 2001, ApJ 376, L22
- (51) Padoan, P., & Nordlund, A. 2004, ApJ 617, 559
- (52) Pascucci, I., Apai, D., Henning, Th. & Dullemond, C.P. 2003, ApJ 590, L111
- (53) Pinte, C. Ménard, F., Duchêne, G. and Bastien, P. 2006, A&A in press (astro-ph 0606550)
- Reach et al. (2005) Reach, W. T., Megeath, S. T., Cohen, M., Hora, J., Carey, S. et al. 2005, PASP, 117, 978
- (55) Reipurth, B. and Clarke, C. J., 2001, A&A
- Rieke et al. (2004) Rieke, G. H., Young, E. T., Engelbracht, C. W., Kelly, D. M., Low, F. J. et al. 2004, ApJS, 154, 25
- (57) Silverman, B. W. 1986, Density Estimation for Statistics and Data Analysis (London: Chapman and Hall)
- (58) Scholz, A., Jayawardhana, R., and Wood, K. 2006, ApJ 645, 1498
- (59) Sterzik, M.F. and Durisen, R.H. 2003, A&A 400, 1031
- (60) Werner, M., et al., 2004, ApJS, 154, 1
- (61) Whelan, E.T., Ray, T.P., Bacciotti, F.,Natta, A., Testi, L., and Randich, S. 2005, Nature 435, 652
- (62) White, E.T., and Ghez, A.M. 2001, ApJ 556, 265
- (63) Whitworth, A. P., and Goodwin, S. P. 2005, A.N. 326, No 10, 899-904.
- (64) Whitworth, A. P., Bate, M. R., Nordlund, A., Reipurth, B. and Zinnecker, H. 2006, in Protostars and Planets V, in press.