Absolute Broadband Polarization Behaviour of PSR B0329+54: A Glimpse of the Core Emission Process
Abstract
In this paper we report multifrequency single pulse polarization observations of the PSR B0329+54 normal mode using the Giant Meterwave Radio Telescope at 325 and 610 MHz and the Effelsberg Observatory at 2695 MHz. Our observations show that towards the central part of the polarization position-angle traverse there is an unusual “arc”-like structure, which is comprised of a broadband “kink” and a frequency-dependent “spot.” The features are intimately connected with the intensity dependence of the core component: the stronger emission arrives earlier and its linear polarization is displaced farther along the “kink”. Moreover, at high intensities, the circular polarization is –/+ antisymmetric; the nearly complete positive circular is characteristic of the weaker, later core subpulses. We find that the “kink” emission is associated with the extraordinary (X) propagation mode, and hence propagation effects do not appear capable of producing the core component’s broadband, intensity-dependent emission. Rather, the overall evidence points to a largely geometric interpretation in which the “kink” provides a rare glimpse of the accelerating cascade or height-dependent amplifier responsible for the core radiation.
keywords:
miscellaneous – methods:MHD — plasmas — data analysis – s: general, individual (B0329+54) — radiation mechanism: nonthermal – polarization.I. Introduction
Radio pulsars are well known to emit highly polarized radiation. Radhakrishnan & Cooke (1969; hereafter R&C) observed the Vela pulsar and demonstrated that the linear polarization position angle (PA) across its average-pulse profile exhibits a characteristic ‘S-shaped’ traverse. This PA-longitude dependence was interpreted as reflecting the varying projected magnetic field direction within an overall dipolar configuration (R&C; Komesaroff 1970). According to this rotating-vector model (RVM), wherein the received emission is associated with those field lines (momentarily) having tangents along our sight-line direction, the linear polarisation will be oriented within this tangent plane, varying with the neutron star’s rotation. The PA as a function of pulse longitude can then be represented as
| (1) |
(Manchester & Taylor 1977), where is the magnetic latitude and the sightline impact angle such that .
The RVM strongly suggests that pulsar radiation is highly beamed and results from relativistic charged particles moving along the open dipolar magnetic field lines producing curvature radiation. This simple RVM model, however has had difficulty in explaining the wide diversity of average PA traverses (e.g., Gould & Lyne 1998; Hankins & Rankin 2006) observed in pulsar average profiles. Most pulsars, for instance, exhibit orthogonal polarization modes (OPMs) wherein the PAs are found to have two preferred values at a given pulse longitude differing by about 90° (Manchester et al 1975; Backer & Rankin 1980). The relative strengths of the modes vary with longitude causing the average PA traverse to exhibit “90° jumps.” Even when these modal effects are carefully considered, many pulsars show average PA behaviours that are inconsistent with the RVM (Everett & Weisberg 2001; Ramachandran et al 2004). Individual pulse studies, however, more clearly delineate OPM effects, and the behaviour of each mode is more usually found to be consistent with the RVM.
Pulsar B0329+54 provides a fascinating context for investigating detailed polarization behaviour. Discovered in 1968 and reported in the third and final Cambridge “batch” (Cole & Pilkington 1968), it is one of the brightest pulsars in the northern sky and has thus been studied both early and very extensively, often with the Effelsberg 100-m telescope at 1700 MHz. One such classic study by Bartel et al (1982; hereafter BMSH) carefully delineated the properties of its profile and polarisation modes. A more recent observation by Gil & Lyne (1995; hereafter GL95) using the Lovell instrument at 408 MHz exhibited the remarkable complexity of the object’s PA behaviour and stimulated Mitra (1999) to investigate the physical origins of its non-RVM effects. Referring to GL95’s fig. 1, we see that the pulsar’s average PA is distorted by the presence of the two OPMs over much of its duration. The individual pulse PAs are well enough confined to the two modal “tracks”, though, that consistent, reliable fits to eq.(1) could be made to them. These authors do also note, however, that the emission shows significant departures from the RVM within a region near the center of the profile associated with its core component—a fact noted earlier as well using modal profiles by Gil et al (1992).
Peculiar PA behaviour has been noted in a number of other pulsars within the longitude range of the central core component (e.g., Rankin 1983a, 1990; hereafter R83a, R90). In the core-cone emission model, the central core and outlying conal components are thought to be produced by a central “pencil” beam within a hollow radiation cone. In such configurations (of which B0329+54 is an excellent example), the RVM behaviour is most clearly associated with the conal components and is often interrupted or distorted in the core region. This apparent non-RVM emission has even prompted speculation that the core might be produced by a different emission mechanism than that of the cone (e.g., Radhakrishnan & Rankin 1990), but this conjecture has attracted no satisfactory theoretical grounding.
More recently, Malov & Suleymanova (1998: hereafter MS98) as well as Gangadhara & Gupta (2001; hereafter G&G) have attempted to interpret B0329+54’s emission configuration on the basis of aberration and retardation (hereafter A/R), taking its bright central feature as the core component—and therefore as the profile center—and then computing emission heights for its several cones. The latter authors also find evidence for several new emission components, and we will use their designations below (see their fig. 3). And in two other papers Suleymanova & Pugachev (1998, 2002; SP98/02) first analyse the linear polarisation distributions at 103 and 60 MHz and then study transitions between the pulsar’s “abnormal” and “normal” profile modes at 111 MHz. Karastergiou et al (2001) study how power and polarisation are correlated in simultaneous observations at 1.41 and 2.69 GHz.
Edwards & Stappers (2004; hereafter ES04) have published a major study of the pulsar’s OPM properties using new high quality 328-MHz polarimetric observations from the Westerbork Synthesis Radio Telescope (WSRT). Their novel analysis delineates the character of the pulsar’s OPM behaviour in detail, and on this basis they speculate about its physical origins. Their study underscores the importance of understanding the non-RVM, core-component properties in the full context of both current analyses and the rich published literature. We will make considerable use of ES04’s results in our work below.
Currently, a number of divergent ideas have arisen in the course of efforts to understand OPM anomalies: GL95 explained their results as an effect of finite beamwidth wherein radiation from nearby field lines was superposed within the sightline. Further, they argued that this effect is more severe near the polar cap from where the field lines diverge. (In general, however, radiation from nearby field lines should superpose symmetrically and should not affect the overall PA traverse; a very special circumstance is needed to produce the observed non-RVM behaviour.) Mitra et al (2000) attributed this effect to multipolar magnetic field contributions in the core-emission region. More recently Mitra & Sieradakis (2004) have speculated that A/R resulting from height-dependent emission can cause distorted PA traverses, and ES04 appeal to magnetospheric refraction to the same end. Srostlik & Rankin (2005) have shown that OPM’s associated with the core emission in B1237+25 can distort the average PA traverse. Ramachandran et al (2004) attributed PA anomalies in B2016+28 to return currents in the pulsar magnetosphere. Given the multitude of possible explanations available, it is clear that primary new observational and analytical work on the OPM phenomenon is needed, especially in the core-emission context. Some important constraints, for instance, can be obtained by studying the frequency dependence of the OPM phenomena responsible for the non-RVM PA behaviours.
Furthermore, B0329+54’s bright central component exhibits a clear intensity dependence: At low intensities its peak lies most of a degree later than at high intensities as shown by McKinnon & Hankins’ (1993; hereafter MH93) fig. 1. They also find that the overall profile width decreases with increasing intensity. Such behaviour is unusual, although the Vela pulsar B0833–45 is also known to exhibit a similar effect (Krishnamohan & Downs 1983; hereafter KD83). Such an overall shift in the central component position is also seen between the pulsar’s two profile modes, such that the abnormal lags the normal by some 0.5°. (see BMSH: fig. 3 or SP02: fig. 1). We will see below that B0329+54’s non-RVM effects—like those in Vela above—are closely associated with the intensity-dependent position of its central component—so we will take KD’s classic analysis and interpretation as a starting point for our work below.
![[Uncaptioned image]](/html/astro-ph/0701216/assets/x1.png)
![[Uncaptioned image]](/html/astro-ph/0701216/assets/x2.png)
| Telescope | BW | Resolution | Pulses | |
| Frequency | Date | (MHz) | (msec) | (#) |
| (MHz) | channels | (°) | Mode | |
| GMRT | 2004 | 16 | 0.512 | 2970 |
| 325 | 27 Aug | 256 | 0.26 | normal |
| GMRT | 2005 | 0.16 | 0.512 | 1650 |
| 610 | 1 Jun | 128 | 0.26 | normal |
| Effelsberg | 1997 | 80 | 0.697 | 2267 |
| 2650 | 19 Oct | 128 | 0.35 | normal |
In this paper we revisit the issues encountered in understanding the PA distributions of pulsar B0329+54 using high quality polarimetry spanning some three octaves. In §II we give details of the observations and their preparation for analysis. §III discusses the multifrequency PA distributions, and §IV considers means to segregate the RVM and non-RVM behaviours. In §V we discuss the several distinct contributions to core power, and §VI provides a discussion and review of the results. Two short appendices then review evidence pertaining to PSR B0329+54’s basic conal and core emission geometry as well as efforts to confirm and extend it.
II. Observations
Pulse-sequence (hereafter PS) polarisation observations of pulsar B0329+54’s ‘normal’ mode at 325, 610 and 2650 MHz are described in Table 1 and presented below. The 325- and 610-MHz PSs were acquired using the Giant Meterwave Radio Telescope (GMRT) near Pune, India and the 2695-MHz observations were made with the 100-m Effelsberg telescope, near Bonn, Germany. The GMRT is a multi-element aperture-synthesis telescope (Swarup et al 1991) consisting of 30 antennas distributed over a 25-km diameter area which can be configured as a single dish both in coherent and incoherent array modes of operation. The polarimetric observations discussed here used the coherent (or more commonly called ‘phased array’) mode (Gupta et al 2000; Sirothia 2000) in the upper of the two 16-MHz ‘sidebands’. At either frequency right- and left-hand circularly polarized complex voltages arrive at the sampler from each antenna. The voltage signals are subsequently sampled at the Nyquist rate and processed through a digital receiver system consisting of a correlator, the GMRT array combiner (GAC), and a pulsar back-end. In the GAC the signals selected by the user are added in phase and fed to the pulsar backend. The pulsar back-end computes both the auto- and cross-polarized power levels, which were then recorded at a sampling interval of 0.512 msec. A suitable calibration procedure as described in Mitra et al (2005) is applied to the recorded data to get the calibrated Stokes parameters , , and . The PS at 2695 MHz is an archival Effelsberg observation. The polarimetry there was carried out with a multiplying polarimeter and calibrated using the procedure described by von Hoensbroech & Xilouris (1997) and von Hoensbroech (1999). The calibrated Stokes PSs at all the frequencies were finally converted into European Pulsar Network (EPN, Lorimer et al 1998) format for offline analysis.
![[Uncaptioned image]](/html/astro-ph/0701216/assets/x6.png)
![[Uncaptioned image]](/html/astro-ph/0701216/assets/x7.png)
III. Frequency Dependence of Polarization Properties
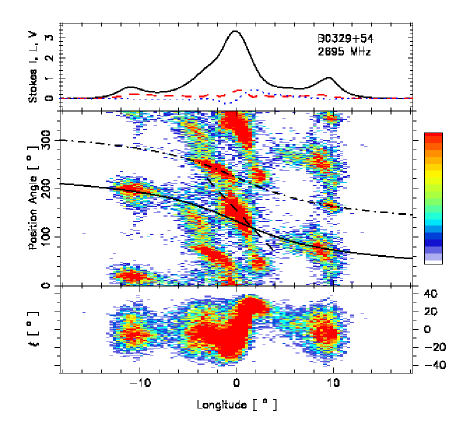
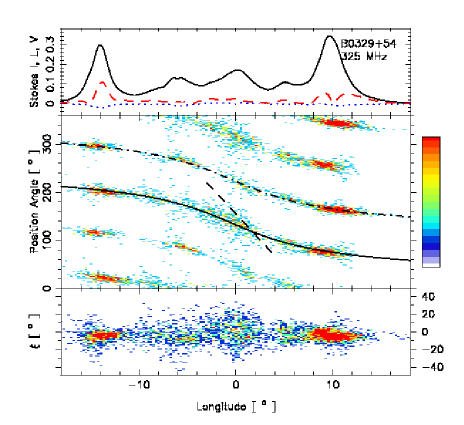
The three panels of Figure 1 give colour-intensity-coded displays of B0329+54’s (normal mode) PA occurrence frequency as a function of longitude at 325, 610 and 2695 MHz (upper left, bottom and right), respectively. The 180° PA range is given twice for clarity, and an RVM model (discussed below) is overplotted along both the stronger “primary” (solid) and weaker “secondary” (dash-dotted curve) OPM (hereafter, PPM and SPM) tracks. These displays are similar to GL95’s fig. 1 at 408 MHz but the GMRT observations are more sensitive, better resolved and plotted with more intensity levels.
It is the PPM track, however, which draws the eye: It too exhibits a clear RVM behaviour, but additionally we see a much steeper “kinky” area under the bright central feature. This region of conspicuously non-RVM dependence within the PA distribution, which has been noted in earlier studies as mentioned above, is one of the clearest such examples in any pulsar, and we therefore take it as the main subject of this investigation.
The contrasting RVM and non-RVM aspects of B0329+54’s PA distribution are also clearly seen in ES04’s fig. 1. Their sensitive, well resolved and calibrated 328-MHz observation is directly comparable with Fig. 1 (left) and shows almost identical non-RVM features. Both colour-coded PA distributions show the RVM behaviour of the SPM track with exceptional clarity. Many of the same features can also be seen in SP98’s 103-MHz PA histogram (their fig. 2). The signal-to-noise ratio (hereafter S/N) and resolution of the observation is inadequate to fully distinguish the non-RVM emission; the PPM PAs associated with the core component are conflated into an elongated and overexposed spot. However, its elongation on the trailing side to smaller PA values appears to be in just the position of the trailing “spot”.
Remarkably, the 610- (bottom) and 2695-MHz (right) polarisation displays show very similar features: The former is almost identical to the 325-MHz behaviour apart from the much weaker leading-component SPM feature. The characteristics of the PPM emission, both the RVM track and non-RVM “arc” are virtually indistinguishable. What subtle differences there are in the 610-MHz PA distribution are mostly the results of a somewhat reduced S/N. Even at 2.7-GHz the same features are easily recognizable: one model RVM curve passes through the leading PPM feature, just under the steep central “kink,” and then again through the trailing PPM conal “patch”; whereas, the SPM curve passes both through the central and trailing features. The 2.7-GHz PA distribution thus seems to differ from the others only in subtle aspects.
Focusing on the non-RVM “kink,” a thin dashed line (having a slope of -21.6 ) indicates its position consistently at each frequency for convenient comparison. Apart from a more limited extension at 2.7 GHz (which may reflect the poorer S/N), the feature exhibits an essentially identical PA-longitude dependence at each frequency. The same cannot be said for the trailing “spot”; its position appears to shift slightly between 325 and 610 MHz (from about 85 to 78) and then is seen at a dramatically smaller PA at 2.7 GHz (about 50).
Overall, we find that both the RVM and non-RVM “kink” emission features in B0329+54’s PA distribution have a broadband nature. We see that the position and slope of the linear “kink” relative to the PPM track is nearly identical at all three frequencies—so that no PA shift is discernible. Only the “kink”’s extension appears to decrease at the higher frequencies, and this may simply be due to decreased S/N. Note also that the trailing-edge circular polarization of the core is positive at all frequencies.
IV. Intensity Dependence of Polarization Properties
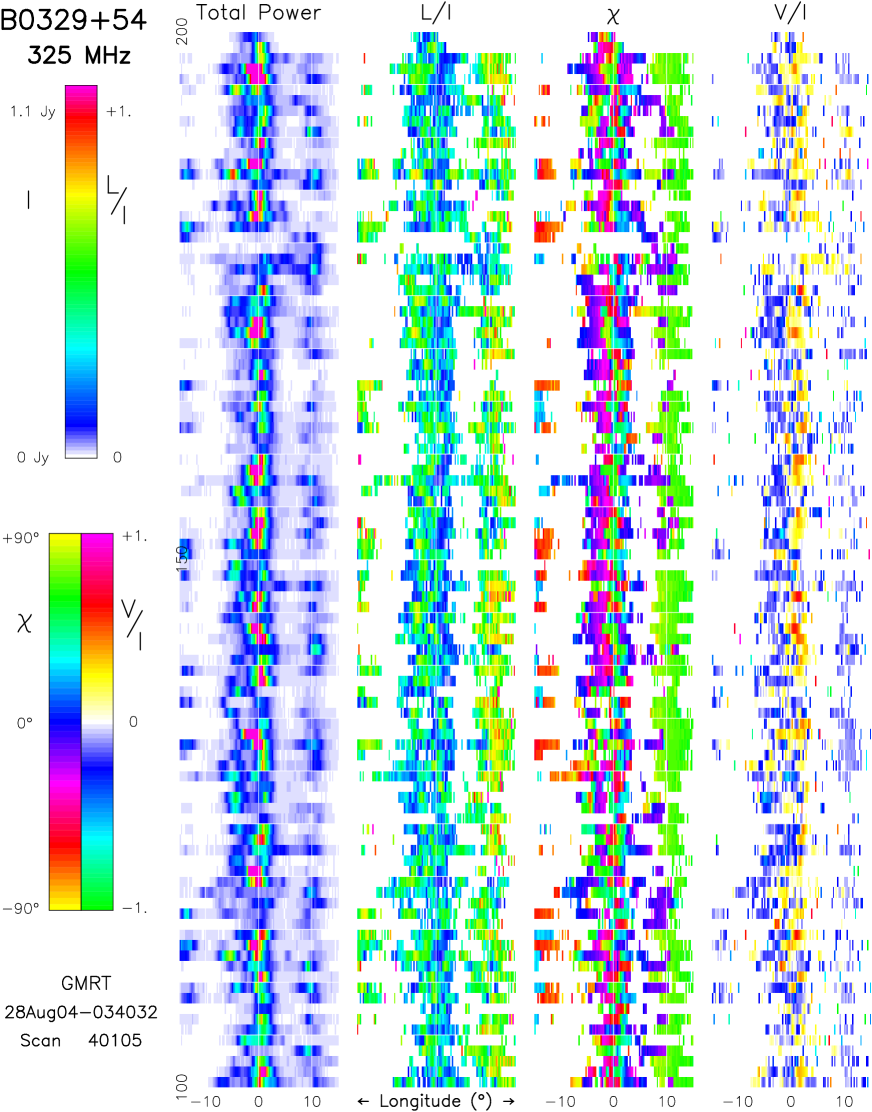
Figure 2 displays a 100-pulse section of the 325-MHz observation in Fig. 1 in full polarisation. Both the strong central feature and weak conal outriders are very apparent, and on closer inspection one can see that the former exhibits a surprising complexity. In certain intervals the central component is so weak that it seems to be undergoing “core nulls”; at other points (e.g., just before pulse 130) it appears double; and when it is emitting most strongly it has a single form that just precedes the longitude origin.111No significant part of these intensity fluctuations can be due to interstellar scintillation (ISS) as the decorrelation bandwidth of the diffractive ISS is only several 10s of kHz within our 16-MHz bandwidth, and the refractive ISS will have a time scale of a few thousand pulses. On this basis and of course MH93’s work, therefore, we began to wonder whether the non-RVM portion of the central emission participates in the systematic intensity dependence.
A ready means of exploring this question was that of segregating the individual pulses according to their overall intensity relative to the off-pulse noise level. For this we defined a longitude window (–4.13 to +6.19°) that encompassed the bright central component (III) under which the non-RVM structure is present. We used its total intensity to determine the mean signal-to-noise ratio (S/N) of each pulse within the window and so divide the pulses into respective S/N categories. Thereby, the 325-MHz observation was segregated into 15 S/N levels. The lowest level was comprised of 197 pulses and showed no discernible non-RVM effects, whereas the higher S/N levels exhibited increasingly obvious departures from RVM behaviour. A similar separation was possible for the 610-MHz GMRT observation, but at 2695 MHz the overall S/N of the Effelsberg PS was poorer so that the lower intensity effects could not be distinguished well enough to be useful; it was clear however even here that the stronger pulses at this frequency tended to exhibit the non-RVM properties—i.e. the “kink” and the “spot”.
We were consequently able to distinguish the 2970 325-MHz pulses by their S/N level over the above range, and each of these intensity “bins” was plotted in a manner similar to Fig. 1. Upon inspection of these PA distributions, we found that three distinct kinds of behaviour were seen at S/N levels of unity, up to and around 7, and then around 12—and we then constructed new displays in which the S/N range is so fractioned. Figure 3 (left, right top and bottom, respectively) then gives these PA distributions.
The S/N “binning” above segregates the PS entirely on the basis of central-component strength. Thus the three partial profiles show clearly that the amplitudes of the leading and trailing conal components (I & IV, as well as the core “pedestal”) are largely independent of its intensity variations. The very weakest section (left) exhibits a profile having five clear components, verifying by a new method the longstanding understanding (e.g., Hesse 1973, Kuz’min & Izvekova 1996) that a weak pair of components lies in between the usual four (VI & V, respectively). Here the core “pedestal” at about –4° is almost indistinguishable. More pertinent to our present concern, however, is the remarkably “clean” PA distribution, which clearly defines both the PPM and SPM “tracks” and shows no hint of non-RVM emission.
We see a very different configuration at intermediate intensity levels (Fig. 3, top right): Here the conal outriders have about the same amplitudes (as in the earlier low S/N display), but the bright central component is some 10 times stronger and is preceded by a somewhat weaker “pedestal” feature at about –4° longitude. The aggregate linear polarisation in the central profile region is slight, but Fig. 2 demonstrates that the fractional linear of the individual pulses here often reaches some 50%—thus the PA distributions are very well defined. It is then completely understandable that little aggregate linear survives. We can discern that the “pedestal” feature is characterized by strong SPM as well as PPM power that exhibits an RVM distribution—and its nearly complete depolarization shows that their levels must be about equal. The non-RVM “kink” is situated prominently just adjacent to the PPM track, occurring well on the trailing side of component III. Its steeper linear appearance is familiar from the distributions of Fig. 1, and we note that it just reaches the PPM track on its trailing end. It is also worth noting that the component III is labeled (here and in some other partial profiles) by weak anti-symmetric circular polarisation in a core-like manner—and also that the “kink” nearly coincides with the positive (lhc) peak.
Furthermore, the highest intensity pulses (Fig. 3, bottom right) show yet a different behaviour: Here the bright central component (III) is strongest by far—both the “pedestal” as well as the conal outriders retain nearly equal intensities to those seen at lower S/N levels. The SPM track is very similar to that seen at intermediate intensities, but with decreased prominence under both the leading conal component and the trailing half of the central component. The most striking effect here, however, is the shift of the non-RVM “kink” emission to earlier longitudes and the appearance of the trailing “spot.” This surely is very clear evidence of intensity-dependent behaviour.
With regard to the “kink”, the Fig. 3 diagrams do not fully exhibit what is seen in the full set of 15 intensity-segregated profiles (not shown). There, at higher levels, the non-RVM PPM emission consists of two “spots”, the later one whose position is fixed and the earlier one which shifts progressively earlier as the intensity increases. We see this motion of the leading “spot” conflated into the elongated “kink” in the mid- and high intensity panels of Fig. 3 (right top and bottom). The “kink” shifts are not linear (and the dashed line is not a fit, only a reference mark) and seem to curve slightly along the PPM track, displaced by perhaps some 1.5°; and the 325-MHz “spot” lies below the PPM track by a roughly similar amount. The “spot” is associated with the far trailing edge of the central component, which is almost fully left-hand circularly polarized (something also very clearly seen in ES04’s fig. 1). This easy to miss circumstance now prompts interest in the leading portion of the central component where right-handed circular power is often seen, but has disappeared in this average of very bright individual pulses. The dynamics of this averaging is very clearly shown in the bottom panel of ES04’s fig. 1, where the canted band shows how the circular polarization depends on longitude—and the leading “spot” motion above then links higher intensity levels with increasing RH circular polarization (see also Fig.4).
In summary, Figs. 1–3 show in different ways that both polarisation modes exhibit an RVM behaviour with almost continuous tracks at all longitudes—that is, the non-RVM power associated with the PPM is seen in addition to a clear RVM track. Only at the highest intensity levels do the PA distributions suggest that non-RVM emission may displace the RVM emission in certain longitude regions under the central component.
V. Intensity Dependence of the Bright Central Component (III) and its Neighbors
Returning now to a fuller study of Fig. 2, generally, power associated with the central component straddles or slightly trails the longitude origin—but the most intense subpulses just precede it (just like in MH93). Additionally, “pedestal” emission can be seen at about –4° longitude in many pulses, often giving the impression that the “core” is double. The fractional linear and circular polarisation in this central region is not small, the former typically some 50% (green) but reaching 70% (yellow). Right-hand circular predominates prior to the longitude origin and left-hand after it, both at typical levels of 40%. Given the slight polarisation of the total profile (see Fig. 1), it is clear that both OPMs are active throughout this central region. Nonetheless, the PA distribution in Fig. 2 indicates that SPM power (magenta) tends to predominate on the leading side of the origin and PPM power (cyan) just after it, but the pronounced stripes of low linear polarization (blue colour) in the second column give some indication of how the depolarisation occurs. Further, at pulse phases where the modal power is comparable (e.g., about 8.5° longitude in Fig. 1), the single pulse fractional linear is high in contrast to the low aggregate linear polarization in the profile. This strongly suggests that the OPM’s are disjoint (Mckinnon & Stinebring 2000).
We have segregated the modal power using the three-way method described in Deshpande & Rankin (2001; Appendix), which produces PPM, SPM and unpolarised (unPOL) PSs. Partial profiles corresponding to these fractions of the total PS (not shown) indicate that the peak intensity of the unPOL profile is about twice that of the PPM profile; moreover, the SPM peak is about 40% that of the PPM peak. They also show that the SPM spans a larger pulse-longitude range than the PPM (see also, GL95: fig. 1, SP98: fig.2; and ES: fig. 1). Overall, then, these results appear compatible with the premise that most of B0329+54’s depolarised power does stem from the incoherent superposition of disjoint PPM and SPM radiation.
Sets of 4 intensity-fractionated profiles are given in Figure 4 for the PPM, SPM and unPOL partial PSs, and their three panels depict the total power, total linear and circular polarisation. The PPM (left) central component is nearly unimodal, whereas that of the SPM (top right) is, as usual, accompanied prominently by the “pedestal” feature. In each of the displays the profiles corresponding to the four intensity fractions overlie each other, but can readily be identified by their increasing amplitudes. All three displays show the intensity-dependent character of component III: this effect is seen strongly in the PPM and unPOL (bottom) plots, but is also discernible in the SPM plot. The PPM total power peak shifts from about +0.5° in the least intense fraction to some –0.5° at the largest intensities, a larger effect by nearly twice than reported by MH93 for the total profile. The unPOL profiles also show a dramatic effect, but here we see a progressive motion on the leading side of the feature and near stasis on the trailing side—such that the high intensity features are broader. The weaker SPM with its “pedestal” feature generally peaks somewhat earlier and exhibits the least retardation with intensity. The most intense PPM power together with the more symmetric unPOL power, dominates the total profile form, especially on its leading edge, and tends to narrow its overall width. Indeed, measurement of the entire set of 15 intensity-fractionated profiles computed from the total PS shows that the trailing half-power point of the central component moves earlier by fully 1.5°.222Note that the intensity-dependent shift of the core peak is just barely discernible in Fig. 3, because too many intensity levels are conflated.

![[Uncaptioned image]](/html/astro-ph/0701216/assets/x9.png)
![[Uncaptioned image]](/html/astro-ph/0701216/assets/x10.png)
We must distinguish carefully between the various contributions to the power on the far leading side of the central component. In the total profiles of Fig. 1 this is the region of the “pedestal”, but in the colour display we can see that much of this power consists of a distinct component at some –4° longitude. Given that individual subpulses can be found at almost any longitude in the –5 to –2° range, one can justly question whether this power comprises an actual component, but note that we see the feature clearly at intermediate intensities (Fig. 3, top right) and in the SPM profile of Fig. 4 (top right). Moreover, the nearly complete depolarization at this longitude in the total profile indicates that PPM power accrues at a similar level and form.
Conversely, we emphasize that this feature at –4° longitude contributes most of the power to the “pedestal” seen in G&G’s fig. 1 as well as our Fig. 1 above. This component II, however, does not substantially contribute to the total profile “pedestal” (apart, perhaps, from extending its leading edge), and so again G&G’s component II and the “pedestal” component at –4° longitude are entirely distinct entities. We refer to this feature at –4° longitude as “component X.”
We have computed the auto–correlations (ACFs) and cross–correlations (CCFs) of both the natural 325-MHz PS as well as of the 2- and 3-way segregated PPM and SPM PSs. Generally, the ACFs at zero delay show a diagonal line of complete correlation as well as symmetrical off-diagonal “knots” of local correlation associated with distinct components—and a number are seen, confirming G&G’s finding that the pulsar’s emission is comprised of multiple components. These ACFs, however, indicate no zero-delay correlation between any of the components, and in particular complete independence between fluctuations of the –4°“pedestal” and central component, even in the SPM. This surely establishes that B0329+54’s leading “pedestal” is an independent emission feature, and we can question whether it is more core- or cone-like, or neither. Further, it indicates that the core’s leading “gouge” is a part of its structure, not a result of “absorption” (e.g., Bartel 1981). CCFs between the two OPM PSs at zero delay suggest possible propagation delays between the two contributions to core power—again of the order of ° longitude—and CCFs at -period delay show significant (typically 30%) asymmetric correlation between different parts of the core component.
VII. Synthetic Analysis & Discussion
In the foregoing sections we have reported on our detailed analysis of three exceptionally high quality observations of pulsar B0329+54, two made with the GMRT at 325 and 610 MHz, and a third from the Effelsberg Telescope at 2.7 GHz. Many studies of this pulsar are available in the literature—a number of which we have reviewed in the Introduction—but few attempt to delineate the properties of the star’s central core component. By contrast, we take this central component as our main interest. We discover that the pulsar’s polarisation properties are strongly dependent on the intensity of the core emission. At lower core intensities, the PA behaviour is largely consistent with the RVM, which allows us to pursue a model for the pulsar’s emission geometry (see Appendix A.1).
Absolute OPM Orientation
As was well established earlier by BMSH, GL95, Mitra (1999) and ES04, the two OPMs can be traced throughout most of B0329+54’s profile. Following current practice, we have taken the stronger mode as the PPM (e.g., Fig. 1, top left). However, this delineation of the OPMs is no longer adequate. We require a physical or fundamental geometrical basis for distinguishing between the two OPMs, and the well measured proper motion of Brisken et al (2002) together with the absolute polarimetry of Morris et al (1979) provides such a means.
Recently, Johnston et al (2006) have revisited the question of whether pulsar rotation axes are aligned with their proper-motion directions, making a good case that the natal supernova “kick” is either parallel or perpendicular to the rotation axis. Part of this latter uncertainty follows from our ignorance about the orientation of a specific OPM with respect to the projected magnetic field direction. One of us (Rankin 2007) has checked and extended the above work and confirms that the case for the star’s rotation axis to be fixed relative to the supernova-kick direction is indeed very strong. Further evidence for such alignment is seen from the x-ray observations of young pulsars (Helfand, Gotthelf & Helpern 2001; Ng & Romani 2004).
For B0329+54, Morris et al determined that the absolute PA (measured ccw from north on the sky) at the peak of the central profile component PAo was 194°. The value, based on the observations in Morris et al (1981) at both 1.72 and 2.69 GHz and a correct rotation measure, is as accurate as can be obtained with average polarization. We have checked these calculations carefully, and used our observations to confirm the relationship between the average and RVM “track” PAs. Brisken et al measure B0329+54’s proper-motion direction (again ccw from north on the sky) PAv as 119°1°. The difference angle (=PAv–PAo) is then 100°4°. The average PA at the fiducial longitude is distorted by the PPM “kink”, so Morris et al’s PAo value probably exceeds the RVM PPM by 5-10°. Nonetheless, we find that the pulsar’s PPM polarization is nearly orthogonal to the projected magnetic field direction.
We reemphasize that the above value applies to the PPM. If the star’s natal “kick” was delivered parallel to its rotation axis, then this identifies the PPM as the OPM orthogonal to the projected magnetic field direction. In their theory of magnetospheric wave propagation, Barnard & Arons (1986) identify the wave polarized perpendicular to the projected field direction as the extraordinary (X) mode; thus the PPM (solid curve) in Figs. 1 and 3 can be associated with the X mode and the SPM (dash-dotted) with the ordinary (O) mode.
This identification of the SPM with the O propagation mode apparently makes this mode subject to refraction; whereas, the X mode propagates in a manner independent of refraction. Furthermore, the refraction direction is expected to be outward, towards the conal edges (Barnard & Arons 1986; Lyubarskii & Petrova 1997; Weltevrede et al 2005)—that is, outward with respect to the magnetic axis—and the PPM/X is the inner of the two modes under the main conal components. Thus, if both conal OPMs arise in the same region,333Our observation seems to show good evidence that the two modes are indeed arising from the same height. We find that for the mode-segregated PPM and SPM, the centers of their outer conal outriders lead the steepest gradient point by about 2°. By applying the BCW model this gives an emission height of about 300 km for both the modes. However, even better S/N than what we have is needed to establish this fact with certainty. we should expect the O-mode emission to have been refracted outward relative to that of the X mode. This behaviour of the outer conal components is very usual as we had noted above (Rankin & Ramachandran 2003), and differences in the directions of X- and O-mode propagation may provide a direct measure of the magnetospheric refraction in peripheral regions of a pulsar’s polar flux tube. Finally, the circumstance that the identified O mode is the outer conal emission mode lends support to the premise that B0329+54’s supernova “kick” was indeed aligned with its rotation axis.
Much is yet to be learned about the conal structure of this pulsar and its causes. While two emission cones are well known in a number of pulsars, only for B0329+54 is there evidence for four (G&G, see also Appendix A.1). In addition to the bright third cone (comps. I & IV), we confirm the innermost cone comprised of G&G comps. II and V and also find that it is PPM (X-mode) dominated (i.e., Fig. 3, left). Regarding G&G’s second and fourth cones, our generally core-directed analyses resulted only in the detection of a few weak subpulses at the specified longitudes, so insufficient to serve as confirmation.
A Glimpse of the Polar-Cap Acceleration Process
Turning now to the perplexing PA “kink” in the pulsar’s PPM traverse, we recall that it a) extends across much of the pulsar’s core component; b) is associated with a strong intensity-dependent shift of the core’s position to earlier longitude; and c) is highly left-hand (positively) circularly polarised at low intensities, but gradually shifts to –/+ anti-symmetric circular at high intensities. Each of these properties is well demonstrated by our analyses above, and overall are reminiscent of KD’s model for the Vela pulsar. And we reemphasize that the “kink” is a frequency-independent feature: slightly different parts of it are revealed at the three frequencies (with their particular S/N levels)—and different parts of it clearly correspond to different intensity levels—but the feature as a whole exhibits a single consistent PA-longitude dependence.
Let us also recall the sightline geometry that the “kink” entails. On the extreme trailing edge of the core component, the “kink” reaches and joins the PPM curve, but it extends steeply across the longitude origin and departs ever more strongly from the RVM track. Moreover, we know from Appendix A.1 that the sightline impact angle is about –3.5°; whereas, the half-power edge of the core component may be at some (5.5°/2 =) 2.8°. Thus the sightline track is poleward of the magnetic axis and seemingly just outside the half-power intensity level of the magnetic-axis-centered core. Sightlines encountering the core then entail acute values of the magnetic azimuth relative to the pole. And although the O-mode radiation does suffer refraction, such refraction would be along radials from the magnetic axis and thus would not appreciably alter the longitude position of the core emission.
The identification of the PPM “kink” with the X mode, as demonstrated in the previous section, rules out propagation effects as its primary cause. Other possible grounds dismissing propagation effects hinge on the “kink”’s complete constancy over a three-octave frequency band. We can then understand the “kink” emission as reflecting A/R effects in an unusual viewing or emission geometry (cf., Blaskiewicz et al 1991). We also assume that B0329+54’s magnetic field is nearly dipolar. Consequently, the “kink” indicates emission at increasing altitude, mostly along the magnetic axis (with perhaps some small displacement to adjacent field lines) as a function of intensity. Were the emission occurring at a fixed altitude, we would see a different sort of “kink”, one with a fixed longitude displacement from the PPM track. But in fact, the steeper PA track of the “kink” indicates that its longitude displacement (from the RVM “track”) increases from zero to some 1.5° or so over precisely the same longitude interval in which the intensity-dependent shift of the PPM core emission is observed. This is just the A/R signature of a height-dependent amplification or cascade: the weaker core emission is emitted at low altitude and, as its intensity increases, so does its emission height, retarding the total intensity and displacing its PA along the “kink”. These various circumstances are clearly indicated in Figs. 1 & 2.
We then have two ways of using the combined effects of A/R to estimate the range of emission heights over which this cascade or amplification process occurs: we can measure the maximum longitude displacement of the “kink” from the PPM RVM, or we can directly estimate the time interval corresponding to the range of height-dependent retardation observed in the core emission. Neither is trivial to measure precisely,444In particular, we cannot simply measure the “kink” displacement relative to the PPM RVM along a particular PA, because these points represent different longitudes and thus different sections of the field above the polar cap. but both represent shifts of roughly 1.5° longitude. The displacements are both produced equally by the aberration and retardation, so only half of the shift is associated with the retardation and thus the emission-height difference. 1.5° then corresponds to 3 ms, and half of this to a height difference of some 450 km (Dyks et al 2004).
Finally, let us consider the circular polarization. Fig. 4 indicates that Stokes is –/+ (rh/lh) antisymmetric both in the SPM and in the PPM at high intensity; at low intensity the PPM peak falls after the longitude origin and is positively circularly polarized. So, we see that the intense PPM emission largely fills the polar cap region and exhibits the antisymmetric circular-polarization signature frequently seen in core features.
Emission associated with the “kink” then, appears to provide a rare glimpse of the core radiation process. It reveals —apparently as different pulses sample this process at different phases with different intensities and polarizations—what seems to be a height-dependent amplification or cascade that moves nearly along the magnetic axis, growing ever more intense with altitude. ES and several other authors (Petrova 2006a,b; Melrose et al 2006) have tended to interpret the non-RVM emission and prominent circular polarization in the B0329+54 core as evidence of propagation effects. But we now see that the geometrical interpretation can be favoured. Not only does the phenomenon share some of the features documented by KD for the Vela pulsar, but both the association of the PPM with the X mode and the broadband nature of the “kink” rules strongly against propagation. It would seem that ES04 and the others failed to appreciate the primary importance of the intensity dependence (MH93) in their interpretations of this pulsar’s “kink” radiation.
One can surely understand how ES04 concluded, from their elegant Poincaré-sphere analysis, that the non-RVM PPM “kink” and “spot” are propagation effects. Arguing that the OPM emission is initially linearly polarized, and then acquires some circular polarization (thus becoming elliptically polarized) in passing through a medium, they identify the annulus seen in their fig. 2 as evidence of this process. Such a process, however, requires that the OPMs superpose coherently (Mckinnon & Stinebring 2000), or what is the same, they cannot be disjoint—and in B0329+54 there is strong evidence that the OPMs are disjoint: a) The polarization is higher in individual pulses than in their aggregate especially within the core region. b) No strong zero-lag, in-phase correlation was found between the PPM and SPM power of the core component (except on its far trailing edge). And c) if O-mode refraction operates as we have suggested above, displacing the modal subcones of the principal conal components and bending O-mode “kink” radiation toward the magnetic axis and out of our sightline, then the OPMs are differently directed and thus cannot superpose. In our view, then, the annulus is produced by the emission geometry of the intensity-height dependence, wherein both the linear and circular polarization exhibit large variations (with the circular fully changing sense).
The Perplexing Moving “Spot”
In contrast to the “kink,” the spot appears to show a strong movement with frequency. Its behaviour can be traced through the three panels of Fig. 1, where we see it centred at about 2.2° longitude, but appearing at 80-90° PA at 325-610 MHz and then some 50° at 2.7 GHz. The “spot” is very clearly associated only with the most intense pulses as is clear from Fig. 3. A less sensitive 21-cm observation (not shown) shows a “track” of PAs something like that seen in the 2.7-GHz panel of Fig. 1 but without the “spot,” so it is important to further explore this possibly very important detailed behaviour. If a systematic motion of the “spot”’s PA and its dependence with frequency can be verified then it could serve as a diagnostic for studying propagation effects in the pulsar magnetosphere.
The Mysterious Component X
A very important question, which the foregoing analyses have pointed strongly (see also Appendix A.2), is the nature of component X. It is the major part of the “core pedestal” and peaks very close to –4° longitude (whereas G&G’s component II is at –5.5°). We see in the figures above (especially Fig. 4, top right) that component X is prominent in the weaker SPM, but its nearly complete aggregate depolarisation (see Fig. 1) clearly indicates that it must be comprised of a comparable amount of PPM power. Component X appears as companion to the core component, but we find no evidence for any correlated power between it and the core. Its intensity behaves more like the conal components; if it participates at all in the core’s intensity dependence (e.g., Fig. 4), it does so in a much weaker manner.
The importance of understanding component X is not confined to B0329+54 as a number of other pulsars have similar features. An excellent example is that of B1859+03 at 21 cms (see Radhakrishnan & Rankin 1990: fig. 1), where we see a fully depolarised component prior to the star’s core that is prominently marked by an antisymmetric circularly polarised signature. This leading feature as well as component X appears to be almost fully depolarised over its entire width, and this is unlike what is seen in outer conal components were the PPM and SPM contributions are characteristically displaced somewhat in radius and thus in longitude (Rankin & Ramachandran 2003). Petrova (2000) and Weltevrede et al (2005), argue that conal emission can be refracted inward due to assumed lower plasma densities near the magnetic axis, perhaps explaining such a feature; apparently, however, only the O mode would be so refracted, so it is difficult to see how this could be squared with the prominent depolarization of component X.
Concluding Comments
In the foregoing sections of the paper we focussed on the nature of B0329+54’s core component and in particular its non-RVM PA “kink” feature. We find that this feature, which is prominently associated with the PPM, is comprised primarily of X-mode radiation—that is, emission whose electric vector is oriented perpendicular to the projected magnetic field direction. Furthermore the constancy of the“kink” over a wide frequency band rules out the possibility that the effect is due to magnetospheric refraction. Rather, we find that the “kink” must be interpreted in a manner reflecting the geometrical exigencies of the emission processes—primarily aberration and retardation. On the other hand, we see what appears to be strong evidence for magnetospheric refraction in the outer conal components. The association of the O mode with the SPM suggests that this mode should be refracted outward, and its broader longitude extent appears to bear this out. The moving “spot” and the X component could also be effects of magnetospheric propagation.
Three key circumstances must be considered in interpreting this “kink” emission: a) its prominent intensity dependence first noted by MH93, and the manner in which the linear polarization of the core emission, increasingly retarded with intensity, produces the “kink”; b) the broadband nature of the “kink” radiation and c) the character of its circular polarization, which is both broadband in character and apparently geometrical in origin. When considered together, the “kink”’s properties appear to provide a rare glimpse of the core emission process, perhaps a cascade or height-dependent amplification.
Core emission has heretofore been inadequately understood, and we hope that these analyses will provide some insights which can assist in giving it an improved physical foundation. Given, we now know, that ions can be pulled off the surface, it is possible that the “kink cascade” can be interpreted in terms of Cheng & Ruderman’s (1980) ion-outflow model. We note that MH93 followed KD’s suggestion in interpreting the intensity dependence in terms of this model, where the higher intensity of the core could result from increased ionic discharge from the neutron star’s surface. The retardation could then be explained, they argue, as a) an A/R effect due to changes of the emission height or b) due to lateral movement of the core-emission region as a function of intensity.
While the ion-discharge might be the origin of the non-linearity behind the intensity dependence, these models provide no further insight into how it is linked to the non-RVM linear or circular polarisation. We have considered the possibility that height dependent A/R effects can give rise to the observed “kink.” However, other possibilities like the ion flow within the polar flux tube might conceivably produce currents which would in turn distort the local magnetic field direction and hence the character of the emitted linear and circular polarisation. Overall, it is difficult to understand why the non-RVM effects are associated only with a single (PPM/X) mode. If the OPMs were produced by two different charged species as proposed by Gangadhara (1995)—then only that one responsible for the PPM might vary significantly in order to distort the PA traverse. However, these and some other suggestions, which were reviewed in the Introduction (Gil & Lyne 1995; Mitra et al 2000; Mitra & Seiradakis 2004), all ostensibly fail to provide as full an explanation as is needed.
Acknowledgments
We thank J. Dyks, R.T. Gangadhara, R. Nityananda, S.A. Suleymanova, G.A.W. Wright, A. Jessner and A. Karasterigou for informative discussions and/or critical readings of the manuscript and the GMRT operational staff for observing support. DM would like to thank Alexis von Hoensbroech for providing the 2.7-GHz observation used in this work and which was also used in Mitra (1999) and Mitra et al (2000). We also gratefully acknowledge our use of this archival observation from the Effelsberg Radio Observatory courtesy of the Max-Planck Institut für Radioastronomie in Bonn. Portions of this work were carried out with support from US NSF Grants AST 99-87654 and 00-98685. This work made use of the NASA ADS system.
References
- Backer & Rankin (1980) Backer D.C., & Rankin, J.M. 1980, Ap.J.Suppl., 42, 143
- Barnard & Arons (1986) Barnard, J. J. & Arons, J. 1986, Ap.J., 302, 138
- Bartel (1981) Bartel N. 1981, A&A, 97, 384
- Bartel et al (1982) Bartel N., Morris D., Sieber W., Hankins T.H. 1982, Ap.J., 258, 776
- Bhattacharya & van den Heuvel (1991) Bhattacharya, D. & van den Heuvel, E.P.J. 1991, Physics Reports, 203, 1-124
- Blaskiewicz, Cordes & Wassermann (1991) Blaskiewcz, M., Cordes, J.M., & Wassermann, I. 1991 Ap.J., 370 643.
- Brisken et al (2002) Brisken, W. F., Benson, J. M., Goss, W. M., & Thorsett, S. E. 2002, Ap.J., 571, 906.
- Cheng & Ruderman (1980) Cheng, A. F. & Ruderman, M. A. 1980, Ap.J., 235, 576
- Cole & Pilkington (1968) Cole, T.W., & Pilkington, J. D. H. 1968, Nature, 219, 574.
- Deshpande & Rankin (1999) Deshpande, A.A. & Rankin, J.M. 1999, Ap.J., 524, 1008
- Deshpande & Rankin (2001) Deshpande, A.A. & Rankin, J.M. 2001, M.N.R.A.S., 322, 438
- Dyks et al (2004) Dyks, J., Rudak, B., & Harding, A.K. 2004, Ap.J., 607, 939
- Edwards & Stappers (2004) Edwards, R.T., & Stappers, B.W. 2004, A&A, 421, 681 (ES04).
- Everett & Weisberg (2001) Everett, J. E., & Weisberg, J. M. 2001, Ap.J., 553, 341.
- Gangadhara (1995) Gangadhara, R. T. 1995, Ap&SS, 232, 327.
- Gangadhara & Gupta (2001) Gangadhara R.T., Gupta Y. 2001, Ap.J., 555, 31(G&G)
- Gil et al (1992) Gil, J. A., Lyne, A. G., Rankin, J. M., Snakowski, J. M., & Stinebring, D. R. 1992, A&A, 255, 181.
- Gil & Lyne (1995) Gil, J. A., & Lyne, A. G. 1995, M.N.R.A.S., 276, 55.
- Gould & Lyne (1998) Gould, D.M., & Lyne, A.G. 1998, M.N.R.A.S., 301, 253.
- Gupta et al (2000) Gupta, Y.; Gothoskar, P., Joshi, B. C., Vivekanand, M.; Swain, R., Sirothia, S.& Bhat, N. D. R., 2000, ASP Conf. Ser. 202: IAU Colloq. 177: Pulsar Astronomy - 2000 and Beyond, 227
- Hankins & Rankin (2006) Hankins T.H., & Rankin, J.M. 2006, A.J., submitted
- Helfand, Gotthelf & Helpern (2001) Helfand, D. J., Gotthelf, E. V.& Halpern, J. P. 2001, Ap.J., 556, 380
- Hesse (1973) Hesse, K. H. 1973, A&A, 27, 373
- von Hoensbroech & Xilouris (1997) von Hoensbroech, A., & Xilouris, K.M. 1997, A&A Suppl., 126, 121.
- von Hoensbroech (1999) von Hoensbroech, A. 1999, Ph.D. Thesis, Bonn University, Bonn, Germany.
- Hobbs et al (2005) Hobbs, G., Lorimer, D. R., Lyne, A. G., & Kramer, M. 2005, M.N.R.A.S., 360, 974
- Johnston et al (2006) Johnston, S., Hobbs, G., Vigeland, S., Kramer, M., Weisberg, J. M., & Lyne, A. G. 2006, M.N.R.A.S., 364, 1397
- Karastergiou et al (2001) Karastergiou, A., von Hoensbroech, A., Kramer, M., Lorimer, D.R., Lyne, A.G., Doroshenko, O., Jessner, A., Jordan, C., & Wielebinski, R. 2001, A&A, 379, 270
- Komesaroff (1970) Komesaroff, M.M. 1970, Nature, 225, 612
- Krishnamohan & Downs (1983) Krishnamohan, S., & Downs, G. S. 1983, Ap.J., 265, 372.
- Kuz’min & Izvekova (1996) Kuz’min, A. D. & Izvekova, V. A. 1996, in IAU Colloq. 160, Pulsars: Problems and Progress, ed. S. Johnston, M. A. Walker, & M. Bailes (ASP Conf. Ser. 105; San Francisco; ASP), 217.
- (32) Lorimer, D. R, Jessner, A., Seiradakis, J. H., Lyne, A. G., D’Amico, N., Athanasopoulos, A., Xilouris, K. M., Kramer, M., & Wielebinski, R. 1998, A&A Suppl., 128, 541
- Lyne & Manchester (1988) Lyne, A.G., & Manchester, R.N. 1988, M.N.R.A.S., 234, 477 (LM88)
- Lyubarskii & Petrova (1998) Lyubarskii, Y. E. & Petrova, S. 1998, A&A, 333, 181
- Malov & Suleymanova (1998) Malov, I. F., & Suleymanova, S.A. 1998, Astron. Rep. 42, 388 (MS98).
- Manchester et al (1975) Manchester, R.N., Taylor, J.H., & Huguenin, G.R. 1975, Ap.J., 196, 83.
- McKinnon & Hankins (1993) McKinnon, M. M., & Hankins, T. H. 1993, A&A, 269, 325 (MH93).
- McKinnon & Stinebring (2000) McKinnon, M. M., & Stinebring, D. R., Ap.J., 529, 435
- Melrose et al (2006) Melrose. D, Miller. A, Karastergiou. A. & Luo, Q 2006, M.N.R.A.S., 365, 638
- Mitra (1999) Mitra, D. 1999, Ph.D. Thesis, Jahawarlal Nehru University, New Delhi.
- Mitra et al (2000) Mitra, D., Konar, S., Bhattacharya, D., Hoensbroech, A. V., Seiradakis, J. H. & Wielebinski, R., 2000, ASP Conf. Ser. 202: IAU Colloq. 177: Pulsar Astronomy - 2000 and Beyond, 265
- Mitra & Seiradakis (2003) Mitra, D. & Seiradakis, J. M. 2003, Proceeding of the 6th Hellenic Astronomical Conference, Penteli, Athens, Greece, 15-17 September 2003, P. G. Laskarides, ed., p. 205
- Mitra & Rankin (2002) Mitra, D, & Rankin, J. M., 2002, Ap.J., 577, 322 (MR02)
- Mitra et al (2005) Mitra, D, Gupta, Y. & Kudale, S., 2005, “Polarization Calibration of the Phased Array Mode of the GMRT”, URSI GA 2005, Commission J03a
- Morris et al (1979) Morris, D., Graham, D. A., Sieber, W., Jones, B. B., Seiradakis, J. H., & Thomasson, P. 1979, A&A, 73, 46
- Ng & Romani (2004) Ng, C. -Y. & Romani, R. W. 2004, Ap.J., 601, 479
- Petrova (2006a) Petrova, S. A. 2006a, M.N.R.A.S., 368, 1764
- Petrova (2006b) Petrova, S. A. 2006b, M.N.R.A.S., 366, 1539
- Radhakrishnan & Cooke (1969) Radhakrishnan, V., & Cooke, D. J. 1969, Ap. Lett, 3, 225
- Radhakrishnan & Rankin (1993) Radhakrishnan, V., & Rankin, J. M.. 1990, Ap.J., 352, 258.
- Ramachandran et al (2004) Ramachandran, R., Backer, D.C., Rankin, J.M., Weisberg, J.M., & Devine, K.E. 2004, Ap.J., 606, 1167
- Rankin (1983) Rankin J.M. 1983a, Ap.J., 274 333
- Rankin (1983) Rankin J.M. 1983b, Ap.J., 274 359
- Rankin (1986) Rankin J.M. 1986, Ap.J., 301, 901
- Rankin (1990) Rankin, J.M. 1990,Ap.J., 352, 247 (R90)
- Rankin (1993) Rankin J.M. 1993, Ap.J., 405, 285 and Ap.J. Suppl.., 85, 145
- Rankin (2007) Rankin J.M. 2007, Ap.J., in press.
- Rankin & Ramachandran (2003) Rankin J.M., & Ramachandran, R. 2003, Ap.J., 590, 411
- Sirothia (2000) Sirothia, S. 2000, M.Sc. thesis, University of Pune
- Suleymanova & Pugachev (1998) Suleymanova, S.A., & Pugachev, V.D. 1998, Astronomy Reports, 42, 252
- Suleymanova & Pugachev (2002) Suleymanova, S.A., & Pugachev, V.D. 2002, Astronomy Reports, 46, 34
- Suleymanova (2006) Suleymanova, S.A. 2006, private communication
- Swarup et al (1991) Swarup, G., Ananthakrishnan, S., Kapahi, V. K., Rao, A. P., Subrahmanya, C. R., Kulkarni, & V. K. 1991, Current Science 60, 95.
- Weltevrede et al (2003) Weltevrede, P., Stappers, B. W., van den Horn, L. J., & Edwards, R. T. 2003, A&A, 412, 473
Appendix A Emission Geometry
A.1 Sightline and Conal Beam Geometry
B0329+54 has a core-cone (Lyne & Manchester 1988; LM88) triple (T) profile (R83a), and its core and main conal component (I & IV) pair are seen over most of the about 0.06 to 15-GHz band in which it can be detected. Three main lines of evidence furthermore indicate that this pulsar’s conal components represent an outer cone: a) it has another set of weak components in between the major ones [Hesse 1973; Kuz’min & Izvekova 1996; see also Fig. 3 (left)], b) the cone size increases strongly at low frequency (Mitra & Rankin 2002; hereafter MR02), and the OPM configuration and depolarisation (e.g., Figs. 1–3) is typical of outer cones (Rankin & Ramachandran 2003).
| Method | Note | Ref | ||
|---|---|---|---|---|
| (∘) | (∘) | |||
| L&M | 30.8 | 2.9 | LM88 | |
| 32 | — | R90 | ||
| ETVI | 30 | 2.1 | R93ba | |
| PA sweep | 5920 | –4.52 | PPM | GL95 |
| 4220 | –32 | SPM | ||
| This paper— | ||||
| PA sweep | 35.513 | –3.71.0 | cor 92% | this paper |
| Thorsett | 32.1 | –3.38 | MR02 |
aThis analysis used a steeper average PA sweep rate of –13.5°/°, thus the smaller values of .
Outer cones are known to have particular dimensions relative to the polar cap size (Rankin 1993a,b; hereafter R93a,b). Its outer cone width together with its central PA sweep rate can be used to determine both its magnetic latitude and sightline impact angle . Several other methods have also been used to estimate these basic parameters for B0329+54, including those of LM88, direct PA sweep fitting (GL95), the core-width method (R90), and a “Thorsett”-function analysis [see DR01, table 2 for a B0943+10 example or Rankin et al (2006), table 2 for B0809+74]—and the results of these analyses are given in Table A1.
We have carried out our own analyses by fitting the RVM to the PPM and SPM PA traverses of the S/N-1 (out of 15) modal PA track at 325- and the SPM PA traverse of the S/N-1 (out of 7) 610-MHz observations. The low S/N PA tracks were chosen for the fits because as seen in Figure 3, these tracks are not corrupted by major non-RVM features. These three fits yielded mutually consistent and values. The fiducial longitudes obtained for each of these fits were used to overlay the three sets of PA values as shown in Figure 5. The combined PAs were then again fitted to eq.(1), and the results are summarized in Table A1. As expected this analysis showed high correlations between and , thus the large errors—35.513 and –3.71.0°, respectively. The fiducial longitude, was well determined at +0.30.5° relative to the peak of the central component in an overall average profile.
Table A1 exhibits that all the available analyses result in similar, and generally compatible, estimates for B0329+54’s magnetic latitude and sightline-impact angle . The older analyses tended to use larger values of the central PA sweep rate , because the different OPM behaviours were then unknown. Larger errors are expected from methods which directly fit the PA traverse (and use no profile-width information), because and are highly correlated in eq.(1)—as we found above. Given the coherence of these analyses (as well as the weight of the many similar analyses applied to many other pulsars which vet and calibrate them), we must conclude that B0329+54’s magnetic latitude is in the 30–35° range and probably near 32°. Furthermore, its is near –3.5°, and the negative sense (poleward sightline traverse) is indicated by a significantly better goodness of fit.555 In addition to B0329+54’s outer conal components (I & IV) and the long known other ones (II, V & VI), G&G identified three additional components and argued that they represented four concentric cones of emission. They then carried out an A/R analysis to compute their emission heights, using the central core component as the reference longitude. Though the other inner component pair is too weak to show in the average profile, our analysis above does tend to confirm them. Also, our computation of the PA-traverse center above makes it possible to apply Blaskiewicz et al’s (1991) method directly. The results of this procedure would, however, provide only a small correction to those of G&G, given that the PA inflection lags the normal-mode core peak only slightly.

A.2 Core Emission Geometry
The implication of the foregoing conal analyses is that B0329+54 has an angular polar-cap diameter of some 2.45° or 2.9°, where is its rotational period of 0.7145 s and moreover that for an of about 32°, we should expect a core-component width 2.45° of about 5.5° longitude. This line of argument has itself been used to determine for many pulsars (R90), and the resulting values in turn found to agree very substantially with LM88’s method (Bhattacharya & van den Heuvel 1991).
Nominally, the core-width estimate has been found to agree best with measurements at around 1 GHz as the core components of most objects tend to become broader at lower frequencies (Rankin 1983b; hereafter B83b). For B0329+54 measurements show observed normal mode core widths in excess of 4° in the 1–2 GHz band, possibly up from some 3.8° at 15 GHz. The high quality observations of von Hoensbroech & Xilouris (1997) show a symmetrical, Gaussian-shaped core component at 10.55 GHz, but ever more asymmetric “notched” forms at longer wavelengths: at 4.85 GHz their core is just perceptibly canted on its leading edge with a 4.4° width, whereas at all lower frequencies down to our own 610- and 325-MHz observations, the size of the “gouged” leading region of the core component increases. This is particularly clear in Fig. 1 (right) at 2.7 GHz, where we see a clearly asymmetric core component in which a double inflection on its leading edge suggests a missing portion. Also note that the leading “notch” is progressively deeper at 610 (bottom left), at 325 MHz (top left) and at 103/111 MHz (see SP98: fig. 4). Around 100 MHz the intrinsic core width is some 3.5° and corrected values appear to vary little down to 61 MHz (Suleymanova 2006).
The strange shape and spectral changes of B0329+54’s bright central region, we have seen above, have several causes. First, it is comprised not only of the core component (III) but also the “pedestal” feature, which in turn is comprised mostly of component X but also G&G’s component II. Component III, however, surely appears to be the core component. Its antisymmetric circular polarization, when present [e.g., in the SPM, Fig. 4 (top right)] tends to have a zero-crossing point near the longitude origin taken at the peak of the central component—and we have also seen that this aligns closely with the PA inflection point. Second, the core-component width falls short of the 5.5° polar cap diameter, thus it does appear to be only partially illuminated. However, this total profile width is dominated by the bright, narrow, earlier-shifting PPM SPs, again contributing to the core’s canted shape. It is worth noting that the core’s width in the average of the weakest pulses (see Fig. 3, left) could be nearly that of the polar cap. Therefore, we have no basis for regarding the “pedestal” and component III together as a “notched” (or “absorbed”) core component (this line of interpretation was taken in R90).