The Supernova Type Ia Rate Evolution with SNLS
Abstract
We present a progress report on a project to derive the evolution of the volumetric supernova Type Ia rate from the Supernova Legacy Survey. Our preliminary estimate of the rate evolution divides the sample from Neill et al. (2006) into two redshift bins: , and . We extend this by adding a bin from the sample analyzed in Sullivan et al. (2006a) in the range from the same time period. We compare the derived trend with previously published rates and a supernova Type Ia production model having two components: one component associated closely with star formation and an additional component associated with host galaxy mass. Our observed trend is consistent with this model, which predicts a rising SN Ia rate out to at least .
Keywords:
galaxies: evolution – galaxies: high redshift – supernovae: general:
97.60.Bw1 Introduction
The importance of Type Ia supernovae (SNe Ia) as cosmic distance tracers Riess et al. (1998); Perlmutter et al. (1999) motivates the efforts to understand their progenitors. We need not only explain the physics that makes their explosions so useful, but we must also recognize and control the systematic effects that may result from the properties of their progenitors and their evolution.
One method used to explore various progenitor models is to compare the evolution of star formation in the universe with the evolution of the observed SN Ia rate Cappellaro et al. (1999); Hardin et al. (2000); Pain et al. (2002); Madgwick et al. (2003); Tonry et al. (2003); Blanc et al. (2004); Dahlen et al. (2004); Barris and Tonry (2006). The challenge of this method is that it requires minimizing systematic effects that can produce spurious trends as a function of redshift. The redshift regions most important for constraining the progenitors, the highest and lowest redshifts, are also the most prone to systematic effects. At low redshifts cosmic variance and the difficulty of sampling large volumes and thus produce good statistics are severe challenges. At high redshifts, the faintness of the objects produce low signal-to-noise detections and less certain typing as well as higher host contamination since projected host offsets are smaller.
The Supernova Legacy Survey (SNLS) offers the opportunity to measure the SN Ia rate trend right in the sweet spot where the volume sampled per square degree is large and yet the objects are bright enough for high quality typing. This circumstance motivated the recently published study of Neill et al. (2006) which produced an anchor point for rate evolution studies at . Our next step is to extend this effort by binning the original sample and adding a higher redshift bin to trace the rate evolution from to . The homogeneous sample and high quality typing provided by SNLS can thus achieve a reduction in the systematics in this redshift range and provide a foundation for rate evolution studies at higher and lower redshifts.
Even though rigorous constraints of SN Ia progenitors await accurate low and high redshift rate measurements, we can still address a few questions that have arisen from other studies of SN Ia rates. We would like to see if we can reproduce the observed trends from previously published studies, in particular those that show a large jump in the SN Ia rate just beyond Barris and Tonry (2006). Of particular importance to future SN Ia surveys, such as JDEM and LSST, is the question of the rate evolution beyond , which appears to decline dramatically Dahlen et al. (2004). This seems to contradict the observation in the local universe that the SN Ia rate is higher in star forming galaxies Cappellaro et al. (1999); Oemler and Tinsley (1979); van den Bergh (1990); Mannucci et al. (2005) which implies that the SN Ia rate should increase at least out to . This correlation of SN Ia rate with host star formation rate has now been observed in the intermediate redshift universe using SNLS Sullivan et al. (2006a) which implies it is not a local effect. For this study we ask: is the observed trend in the SN Ia volumetric rate consistent with this correlation of rate with host properties?
2 The Supernova Legacy Survey
The SNLS was instigated with the goal of providing observational constraints on the pressure/density ratio of the universe, . Its first-year results Astier et al. (2006), in combination with other cosmological probes, provide one of the best observational constraints on Spergel and et al. (2006). It is designed as a rolling-search survey of four one-square-degree fields evenly spaced in RA. Each field is imaged with the Megacam imager on the Canada-France-Hawaii Telescope five times a month during its roughly six-month observing season in four wavelength bands: g’r’i’z’. A deep u* image is also taken of each field to aid in measuring host galaxy properties. As each epoch is acquired it is scanned for variable objects which are recorded in a database111see http://legacy.astro.utoronto.ca, and http://makiki.cfht.hawaii.edu:872/sne/. SN-like variables are assessed for their SN Ia type likelihood Sullivan et al. (2006b) and all useful SN Ia candidates are promoted for followup spectroscopy with the VLT or the Gemini or Keck Telescopes. The availability of 8 and 10 meter class telescopes for spectroscopic followup provides a well defined completeness and a large spectroscopically confirmed sample of objects. The database of all variable objects provides a means to estimate spectroscopic completeness Neill et al. (2006).
3 Rate Evolution with SNLS
Neill et al. (2006) used a Monte Carlo method to estimate the SNLS survey efficiency in the redshift range . Updated host extinction models Riello and Patat (2005) improved the estimation of the systematic errors. The study of SN Ia rates as a function of host properties by Sullivan et al. (2006a) used the same sample and methods, but added an additional sample in the range .
To estimate the rate evolution using the SNLS, we split the sample from Neill et al. (2006) and Sullivan et al. (2006a) into three bins: , , and . Separate Monte Carlo runs were performed for each sub-sample including experiments to determine the associated systematic errors in each redshift bin. Table 1 lists the spectroscopically confirmed sample for each field in each redshift bin. The preliminary results reported here will be improved upon by adding more recent SNe Ia from the survey to increase the sample size in each bin.
We applied the same methods used in Neill et al. (2006) to derive the volumetric SN Ia rate in each bin, and associated systematic and statistical errors. We now compare the results to the two-component model of SN Ia production Sullivan et al. (2006a); Mannucci et al. (2005); Scannapieco and Bildsten (2005).
| Field | |||
|---|---|---|---|
| D1 | 3 | 13 | 9 |
| D2 | 5 | 10 | 12 |
| D3 | 6 | 10 | 12 |
| D4 | 3 | 8 | 9 |
| ALL | 17 | 41 | 42 |
4 The Two-Component Model
This model proposes a component associated with the host galaxy mass, to explain the non-zero SN Ia rate observed in early-type galaxies, and a component associated with the host galaxy star formation rate, to explain the correlation of SN Ia rate with host star formation rate Sullivan et al. (2006a); Mannucci et al. (2005). The volumetric SN Ia rate evolution, , is thus expressed as follows:
| (1) |
with in terms of SNe Ia per year per unit host stellar mass and in terms of SNe Ia per year per unit host star formation. The component produces SNe Ia on shorter (Gyr) time-scales, while the component is responsible for the longer time-scale required to produce SNe Ia in galaxies dominated by older stellar populations.
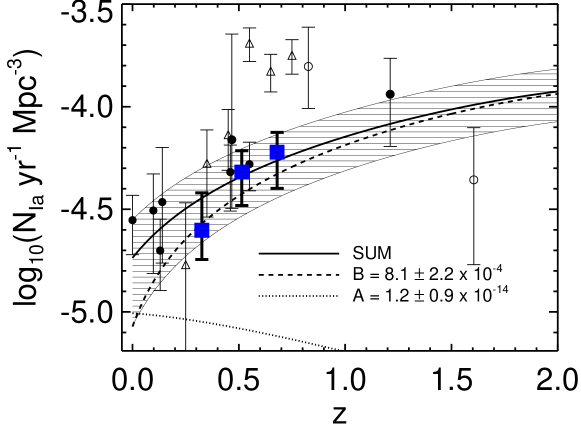
Figure 1 shows a fit (solid line) of the SNLS rate evolution (filled squares) and various rates from the literature (solid circles) to the two-component model based on the star formation history (SFH) as parameterized by Hopkins and Beacom (2006). The resulting coefficients are annotated on the plot and the resulting evolution of each component is indicated by the dashed line ( component) and the dotted line ( component). The statistical uncertainty in the combined components is indicated by the hashed region.
We note that this model appears to be incompatible with two features in the observed rates. This fit is statistically inconsistent with the large jump in the rates seen at by Barris and Tonry (2006). It also predicts an increase in the SN Ia rate out to , while the rates from Dahlen et al. (2004) show a steady decline after a redshift of . The highest redshift observation () is only marginally inconsistent with the model.
The mass used in fitting the and components was derived by integrating the SFH from Hopkins and Beacom (2006), and thus includes the mass of dead stars. When fitting host properties, the mass derived does not include dead stars. Our fitted values for and are consistent with published values (Neill et al., 2006, §6.1.1), but are marginally offset from host property values as expected from the differences in host masses. Our final results will include a mass correction for dead stars and thus produce and values more consistent with those derived from host properties.
5 Conclusions
By restricting our measurements of the SN Ia volumetric rate evolution to samples whose members are primarily identified with spectroscopy, we find a trend that appears compatible with the observed properties of SN Ia hosts. The most stringent test of this model awaits further measurements of the rate beyond , but we must be careful. If the two-component model is correct, the higher redshift SNe Ia are more closely associated with star formation. This close association could introduce systematics from the dust and other features of high-redshift star formation that compound the difficulty of deriving accurate high-redshift SN Ia rates. This caution applies to the use of these high-redshift SNe Ia for cosmology as well.
References
- Neill et al. (2006) J. D. Neill, et al., AJ 132, 1126–1145 (2006).
- Sullivan et al. (2006a) M. Sullivan, et al., ApJ 648, 868–883 (2006a).
- Riess et al. (1998) A. G. Riess, et al., AJ 116, 1009–1038 (1998).
- Perlmutter et al. (1999) S. Perlmutter, et al., ApJ 517, 565–586 (1999).
- Cappellaro et al. (1999) E. Cappellaro, R. Evans, and M. Turatto, A&A 351, 459–466 (1999).
- Hardin et al. (2000) D. Hardin, et al., A&A 362, 419–425 (2000).
- Pain et al. (2002) R. Pain, et al., ApJ 577, 120–132 (2002).
- Madgwick et al. (2003) D. S. Madgwick, P. C. Hewett, D. J. Mortlock, and L. Wang, ApJL 599, L33–L36 (2003).
- Tonry et al. (2003) J. L. Tonry, et al., ApJ 594, 1–24 (2003).
- Blanc et al. (2004) G. Blanc, et al., A&A 423, 881–894 (2004).
- Dahlen et al. (2004) T. Dahlen, et al., ApJ 613, 189–199 (2004).
- Barris and Tonry (2006) B. J. Barris, and J. L. Tonry, ApJ 637, 427–438 (2006).
- Oemler and Tinsley (1979) A. Oemler, and B. M. Tinsley, AJ 84, 985–992 (1979).
- van den Bergh (1990) S. van den Bergh, PASP 102, 1318–1320 (1990).
- Mannucci et al. (2005) F. Mannucci, M. della Valle, N. Panagia, E. Cappellaro, G. Cresci, R. Maiolino, A. Petrosian, and M. Turatto, A&A 433, 807–814 (2005).
- Astier et al. (2006) P. Astier, et al., A&A 447, 31–48 (2006).
- Spergel and et al. (2006) D. N. Spergel, et al., ApJ, submitted, astro-ph/0603449.
- Sullivan et al. (2006b) M. Sullivan, et al., AJ 131, 960–972 (2006b).
- Riello and Patat (2005) M. Riello, and F. Patat, MNRAS 362, 671–680 (2005).
- Scannapieco and Bildsten (2005) E. Scannapieco, and L. Bildsten, ApJL 629, L85–L88 (2005).
- Hopkins and Beacom (2006) A. M. Hopkins, and J. F. Beacom, ApJ, submitted, astro-ph/0601463.