The chemical evolution of Omega Centauri’s progenitor system
Abstract
Chemical evolution models are presented for the anomalous globular cluster Centauri. After demonstrating that the chemical features of Cen can not be reproduced in the framework of the closed-box self-enrichment scenario, we discuss a model in which this cluster is the remnant of a dwarf spheroidal galaxy evolved in isolation and then swallowed by the Milky Way. Both infall of primordial matter and metal-enriched gas outflows have to be considered in order to reproduce the stellar metallicity distribution function, the age-metallicity relation and several abundance ratios. Yet, as long as an ordinary stellar mass function and standard stellar yields are assumed, we fail by far to get the enormous helium enhancement required to explain the blue main sequence (and, perhaps, the extreme horizontal branch) stellar data. Rotating models of massive stars producing stellar winds with large helium excesses at low metallicities have been put forward as promising candidates to solve the ‘helium enigma’ of Cen (Maeder & Meynet, 2006, A&A, 448, L37). However, we show that for any reasonable choice of the initial mass function the helium-to-metal enrichment of the integrated stellar population is unavoidably much lower than 70 and conclude that the issue of the helium enhancement in Cen still waits for a satisfactory explanation. We briefly speculate upon possible solutions.
keywords:
galaxies: dwarf – galaxies: evolution – globular clusters: individual ( Centauri) – stars: abundances – stars: chemically peculiar.1 Introduction
The globular cluster (GC) Cen (NGC 5139) is a unique window into astrophysics (see Smith 2004, for a recent review). The estimated mass, between (2.5 0.3) M⊙ (van de Ven et al. 2006) and 5.1 M⊙ (Meylan et al. 1995) – or even 7.1 M⊙ (Richer et al. 1991), makes it the most massive GC of the Milky Way. Its total mass better compares with that of a small dwarf spheroidal galaxy such as Sculptor ( 6.4 M⊙; Mateo 1998) rather than with that of a typical Galactic GC ( M⊙; Harris 1996). The large degree of chemical self-enrichment observed in Cen giant and subgiant members also sets it apart from all the other Galactic globulars.
Indeed, Cen is the only known GGC to exhibit a large degree of chemical self-enrichment in all the elements studied (Freeman & Rodgers 1975; Cohen 1981; Mallia & Pagel 1981; Gratton 1982; Norris & Da Costa 1995; Smith, Cunha & Lambert 1995; Smith et al. 2000; Pancino et al. 2002). While star-to-star variations in the abundances of light elements such as carbon, nitrogen, oxygen, sodium, magnesium and aluminum could be due to proton-capture fusion reactions occurring during quiescent hydrogen and helium burning within the giants themselves, variations in the abundances of heavier species – such as iron-peak and neutron-capture elements – should be immune to such processes and, therefore, likely reflect patterns imprinted on the observed stars by previous stellar generations (Lloyd Evans 1983; Cohen & Bell 1986; Norris & Da Costa 1995; see also Gratton, Sneden & Carretta 2004, for a comprehensive review on abundance variations within GCs).
The first indication that Cen was chemically inhomogeneous came from the large color width of the red giant branch (RGB) established in an earlier photometric work by Woolley (1966). In the last decade, both extensive spectroscopic surveys and wide-field photometric studies – mostly of giant Cen members – have definitely confirmed the existence of several (up to five) discrete stellar populations covering a large range in metallicity (Norris, Freeman & Mighell 1996; Suntzeff & Kraft 1996; Lee et al. 1999; Hilker & Richtler 2000; Hughes & Wallerstein 2000; Pancino et al. 2000; Rey et al. 2004; Sollima et al. 2005a). The metallicity distributions of (sub)giant stars and main sequence turnoff (MSTO) stars look pretty much the same (Stanford et al. 2006). From their spectroscopic and photometric MSTO data, Stanford et al. (2006) find that the formation of Cen took place most likely over 2–4 Gyr; both a null age range and age ranges higher than 6 Gyr are deemed unlikely (cf. previous works by Norris & Da Costa 1995; Hilker & Richtler 2000; Hughes & Wallerstein 2000; Smith et al. 2000; Pancino et al. 2002; Rey et al. 2004; Sollima et al. 2005a; see also Kayser et al. 2006). It has also been found that the faint main sequence of Cen splits into at least two distinct branches (Anderson 1997; Bedin et al. 2004; Sollima et al. 2006b). The blue main sequence (bMS) contains 25 per cent of the stars and is 0.3 0.2 dex more metal-rich than the red one (rMS; Piotto et al. 2005). These observations are most likely explained by an anomalously high helium abundance of bMS stars of 0.38 ( 70; Norris 2004; Piotto et al. 2005). Such an intriguing possibility has been quantitatively investigated in the framework of somewhat idealized scenarios for the formation and evolution of Cen (Bekki & Norris 2006).
It has been shown (Norris et al. 1997) that the metal-rich component of the cluster, which is more centrally concentrated, has a smaller line-of-sight velocity dispersion and a lower systemic rotation about the cluster’s minor axis than the metal-poor one. A more recent analysis by Sollima et al. (2005b) confirms the trend of decreasing velocity dispersion with increasing metal abundance in the metallicity range 2.0 [Fe/H] 1.0, but shows also that in the extreme metal-rich extension of the stellar population, now better sampled thanks to new generation instrumentation (Pancino et al. 2000), this decreasing trend is reversed (see fig. 9b of Sollima et al. 2005b). Asymmetries in the distribution and velocity of the stars could testify past accretion events within Cen (Ferraro, Bellazzini & Pancino 2002; Pancino et al. 2003), but evidence for these is not definitive yet (Platais et al. 2003). To further complicate the overall picture, the orbit of Cen is found to be strongly retrograde, almost coplanar with the Milky Way disc, and to have small apogalacticon, unlike any known Galactic GC (e.g. Majewski et al. 2000). At variance with most globulars, the relaxation time for Cen is very long, up to a few times 109 years in the core and a few times 1010 years at half-mass radius (Meylan et al. 1995; van de Ven et al. 2006). Indeed, recent results suggest that the cluster is not yet relaxed even in the central regions (Ferraro et al. 2006). This cluster could then mantain for a fairly long time the imprinting of its initial conditions, thus allowing one to use the currently observed distribution of stars of different populations in order to trace back the cluster formation and evolution (e.g. Merritt, Meylan & Mayor 1997).
The large mass, spread in element abundances, flattened shape and rotation all come close to the picture where Cen is the surviving remnant of a larger system. The chemical and kinematical segregations detected in Cen add even more relevance to the picture of a dwarf galaxy progenitor being subject to accretion events, since such gradients are present in nearly all of the Local Group dwarf spheroidals (e.g. Harbeck et al. 2001; Tolstoy et al. 2004; Koch et al. 2006, to name a few). Several authors have speculated on the possibility that Cen is the naked nucleus of a dwarf satellite galaxy captured into a retrograde Galactic orbit many billion years ago (Dinescu, Girard & van Altena 1999; Majewski et al. 2000; Smith et al. 2000; Gnedin et al. 2002; Bekki & Norris 2006), following more general ideas on an accreted origin for GCs in our own as well as external galaxies (Zinnecker et al. 1988; Freeman 1993). Self-consistent dynamical models as well as N-body hydrodynamical simulations can be found in the literature which succeed to reproduce the main features of the cluster by assuming that it formed in isolation and then fell inside the Galactic potential well (e.g. Carraro & Lia 2000; Bekki & Freeman 2003; Tsuchiya, Korchagin & Dinescu 2004). The total mass of the parent object ranges from 108 M⊙ to some 109 M⊙ in those models. Alternative scenarios envisage an off-centre stellar supercluster seed, which would have trapped older galactic field stars during its formation process (Fellhauer, Kroupa & Evans 2006). Other possible explanations for the cluster origin – namely, merging between two or more smaller globulars or between a dwarf galaxy and a cluster (Icke & Alcaino 1988; Norris et al. 1997), or formation triggered by cloud-cloud collisions (Tsujimoto & Shigeyama 2003) – have been put forward, but seem less likely on the basis of the continuous trends of heavy elements-to-iron and lanthanum-to-iron observed for S stars in Cen (Vanture, Wallerstein & Suntzeff 2002, and references therein). Clear evidence against the parent system evolving as a closed box has been put forward by Ikuta & Arimoto (2000).
In this paper we deal with the chemical evolution of Cen. We discuss two possible scenarios of formation: in the first one, the precursor of Cen is a small system which evolves either as a closed-box or with some exchange of matter with the surroundings; in the second one, the cluster is the leftover of an ancient nucleated dwarf galaxy swallowed by our Galaxy some 10 Gyr ago. We pay special attention to the intriguing subject of helium enhancement in bMS stars. For the first time, this critical issue is faced in the framework of a complete, self-consistent chemical evolution model, taking all the relevant physics into account. In Section 2 we list the observations that we use to constrain our chemical evolution model. The model is presented in Section 3. Section 4 summarizes the model results, that are discussed and compared to previous investigations in Section 5. In Section 5 we also draw our conclusions.
2 The nature of the chemical enrichment in Omega Centauri
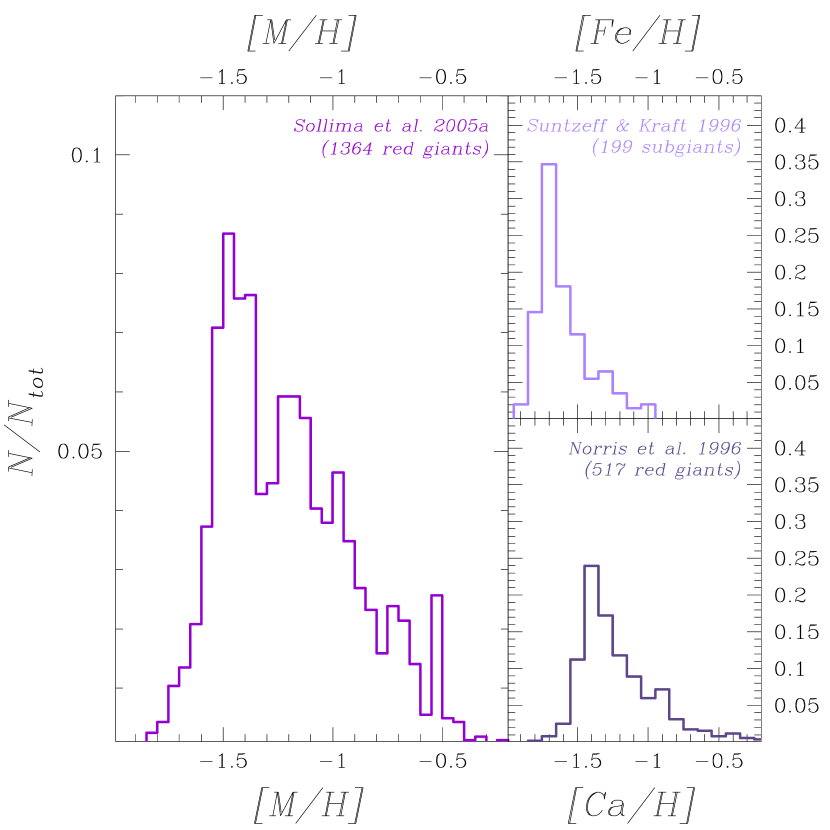
It was recognized several years ago that simple models for cluster enrichment can not reproduce the number of metal-rich stars observed in the metallicity distribution function (MDF) of Cen giants (Norris et al. 1996; Suntzeff & Kraft 1996; Ikuta & Arimoto 2000). Based on Ca abundances obtained from low-resolution spectra, Norris et al. (1996) found a bimodal distribution with a metal-poor component, peaking at [Ca/H] 1.4 dex and comprising nearly 80 per cent of the stars, and a metal-rich one, comprising nearly 20 per cent of the stars at [Ca/H] 0.9 dex (Fig. 1, lower right panel). Suntzeff & Kraft (1996) also found a sharp rise at low metallicities and a high-metallicity tail, but no evidence for a secondary hump at higher metallicities (Fig. 1, upper right panel).
The sharp rise to a mean of [Fe/H] 1.6 dex and the long tail at higher metallicities have been confirmed by a number of subsequent studies, using both higher resolution spectroscopy and/or high quality photometry (e.g. Hilker & Richtler 2000; Frinchaboy et al. 2002; Sollima et al. 2005a; Stanford et al. 2006; Kayser et al. 2006). Some of these works also show that the MDF is more complex than previously thought, with several separate peaks identified in the observed distribution (e.g. Sollima et al. 2005a; Fig. 1, left panel). According to subgiant branch (SGB) data, the different populations have ages comparable within 2 Gyr; actually, they might be even coeval (Sollima et al. 2005b; see also Ferraro et al. 2004). A wider age range, 2–4 Gyr, is inferred from MSTO data (Stanford et al. 2006; see also Hilker et al. 2004 and Kayser et al. 2006).
The abundance ratios of different chemical species provide another independent constraint on the evolutionary time-scales. As first discussed by Lloyd Evans (1983), the enrichment of s-process elements (e.g. Ba, La) in the metal-rich Cen stars is likely to be that of the gas clouds out of which the stars formed. Smith et al. (2000) suggested previous generations of low-mass asymptotic giant branch (AGB) stars as polluters and argued in favour of a protracted period of star formation in Cen, of the order of 2–3 Gyr. Shorter time-scales are inferred from the observed knee in the [/Fe] versus [Fe/H] relation, if Type Ia supernovae (SNeIa) in Cen restore the bulk of their iron to the interstellar medium (ISM) on the same time-scale as in the solar neighbourhood (1 Gyr; Pancino et al. 2002). However, one must be aware that the time-scale for the maximum enrichment by SNeIa in a specific system depends strongly on the assumptions about the SN progenitors, stellar lifetimes, initial mass function (IMF), star formation rate (SFR) and, last but not least, possible metal-enriched gas outflows from the system. It has been demonstrated (Matteucci & Recchi 2001, and references therein) that time-scales as long as 4–5 Gyr can be obtained with suitable assumptions. We will come back to this issue later on, when discussing model results in Section 5.
Gnedin et al. (2002) used simple dynamical modeling to demonstrate that if Cen had always evolved in isolation on its present orbit in the Milky Way, it would have been unable to retain the s-process-rich wind material from AGB stars because of stripping from ram pressure during many passages through the disc. Subsequent numerical simulations demonstrated that an Cen-like object can originate from a nucleated dwarf galaxy intruding into the Milky Way. Both the orbital parameters and the observed surface brightness profile of the present-day Cen are reproduced by a tidal disruption scenario where the falling dwarf has its outer stellar envelope almost completely stripped, whereas a central, dense nucleus still survives owing to its compactness (Bekki & Freeman 2003; Tsuchiya et al. 2004; Ideta & Makino 2004). Interestingly enough, also the number fraction (25 per cent) of the bMS stars with extreme helium enhancement ( 0.12–0.14; Norris 2004; Piotto et al. 2005) can not be explained as long as they originated from the ejecta of rMS stars initially within Cen. Rather, most of the helium-rich gas necessary to form the bMS had to come from field stellar populations surrounding Cen when it was the compact nucleus of a Galactic dwarf satellite (Bekki & Norris 2006). In other words, the original total mass of the rMS population must have been larger than the present-day one and most of the rMS stars must have been removed from the proto- Cen after their ejecta were used to form the bMS population. Searches for tidal debris from Cen’s hypothetical parent galaxy in the solar neighbourhood are possible in principle (Dinescu 2002). Indeed, a distinct population of stars with Cen-like phase-space characteristics and metallicities consistent with those of Cen members emerges from catalogs of metal-deficient stars in the vicinity of the Sun (Dinescu 2002; Meza et al. 2005).
Though gas fueling from an ancient host galaxy stands as an attractive hypothesis in many respects, to the best of our knowledge this possibility has never been studied by means of fully self-consistent chemical evoution models before.
3 The chemical evolution model
We follow the evolution of the abundances of several chemical species in the gaseous medium out of which Cen’s stars form, in the case of either a GC precursor or a dwarf spheroidal progenitor. The adopted chemical evolution model is one zone, with instantaneous111Notice that ‘instantaneous’ actually means ‘on time-scales shorter than the adopted timestep for integration of the equations’. and complete mixing of gas inside it and no instantaneous recycling approximation (i.e., the stellar lifetimes are taken into account in detail). The GC precursor has an initial mass of the same order of magnitude of the present one ( = 2.5–5 106 M⊙). Both a closed-box model and models where exchanges of matter with the surroundings are allowed are analyzed. For the dwarf galaxy precursor, when the computation starts the baryonic matter (cooling gas) is embedded in a relatively massive ( = 10), diffuse ( = 10), virialized dark matter halo. Initially, the baryonic mass inside the dark matter potential well is two orders of magnitude higher than the present one. As soon as the star formation begins, the thermal energy of the gas starts to increase as a consequence of multiple SN explosions, eventually exceeding its binding energy222We compute the binding and thermal energies of the gas according to the recipes of Bradamante, Matteucci & D’Ercole (1998). However, we adopt a typical efficiency of thermalization from both Type II and Type Ia SNe of = = 0.20, rather than 0.03 (see Romano, Tosi & Matteucci 2006, and references therein).. When this condition is met, part of the gas escapes the galactic potential well; we assume that this gas is definitively lost from the system.
3.1 Basic equations
We use the following basic equation (Tinsley 1980)
| (1) |
to track the evolution of the fractional gas mass in the form of element normalized to the initial gaseous mass, . The quantity represents the abundance by mass of the element at the time ; by definition, the summation over all the elements in the gas mixture is equal to unity. The first term on the right hand side accounts for gas consumption by star formation; the second term on the right hand side refers to gas return by dying stars. All the complicated dependencies on the adopted stellar initial mass function and lifetimes, SNIa progenitors and stellar nucleosynthesis products hidden in the term are not made explicit here; the interested reader can find all of them discussed in considerable detail in Matteucci & Greggio (1986). Suffice it here to say that in this work we use an extrapolated Salpeter (1955) IMF or a Scalo (1986) IMF, both normalized to unity over the 0.1–100 M⊙ stellar mass range, to show the predictions from both steep and flat, although ‘standard’, IMFs. The adopted stellar nucleosynthesis prescriptions are discussed in Section 3.3.
In our models the SFR is a simple Schmidt’s (1963) law:
| (2) |
The quantity is the star formation efficiency, namely the inverse of the typical time-scale for star formation, and is expressed in units of Gyr-1. The exponent is set to be 1.
The last two terms in Equation (1) account for any gas inflow and/or outflow. For the closed system, all the gas available for star formation is in situ when the star formation begins at = 0, and no infall from outside is considered. For the open systems, the rate of gas infall is parametrized as
| (3) |
with , the infall time-scale, set to be 0.5 Gyr, and , the abundances of the infalling gas, set to their primordial values. In particular, we assume = 0.248, in agreement with the predictions of the standard big bang nucleosynthesis (SBBN) theory and the constraints from the cosmic microwave background (CMB; see Romano et al. 2003, and references therein).
The rate of gas loss via SN-driven large-scale outflows is different from zero only for the open models, and simply proportional to the amount of gas present at the time :
| (4) |
The quantity is a free parameter which describes the efficiency of the galactic wind; it is expressed in Gyr-1 and may have different values for different elements (e.g. Recchi, Matteucci & D’Ercole 2001).
3.2 The evolutive context
According to Bekki & Freeman (2003, and references therein), in the dwarf progenitor scenario the initial stellar mass of Cen’s host was significantly higher than that currently observed and can be estimated as
| (5) |
where = 0.05 is the mass fraction of the compact nucleus and = 0.2 is the stellar mass fraction that gets lost through long-term (10 Gyr) tidal interaction with the Milky Way. If 5 106 M⊙ (Meylan et al. 1995), one gets = 1.25 108 M⊙. Since might be a factor of two lower (van de Ven et al. 2006), we run several models, starting with an initial gaseous mass = 5 108–109 M⊙ and ending up with a stellar mass = 3 5 107–108 M⊙. Given the similarity of the results, in the case of the dwarf galaxy parent we will show only the predictions for our most massive model ( = 0.35 Gyr-1, 5 Gyr-1).
Though in our models the star formation activity lasts 3 Gyr, it is worth noting that most of the stars (nearly 75 per cent of the cluster population) actually form during the first 1 Gyr. In the dwarf progenitor scenario, while the star formation proceeds, the galaxy gets almost completely depleted of its gas, partly owing to gas consumption by the adopted long-lasting star formation activity, but most of all because of efficient gas removal through the large-scale galactic outflows.
The chemical properties of our Cen progenitor systems are discussed and compared with the available observations in Section 4.
3.3 Nucleosynthesis prescriptions
In this work we adopt the metallicity-dependent yields of van den Hoek & Groenewegen (1997) for single low- and intermediate-mass stars (LIMSs; 0.9 /M⊙ 8) and the yields of Nomoto et al. (1997) for massive stars (13 /M⊙ 70). These latter are computed for a solar chemical composition of the stars. The stellar yields are then scaled to the current metallicity of the model by means of the production matrix formalism (Talbot & Arnett 1973). We (arbitrarily) use linear interpolations and extrapolations to cover the 1–100 M⊙ stellar mass range. The effect of adopting different yield sets will be thoroughly analyzed in a forthcoming paper (Romano et al., in preparation; notice that changing the adopted yield sets is not expected to affect significantly the main results presented in this paper).
For stars evolving in binary systems which will give rise to SNIa explosions, the nucleosynthesis prescriptions are from Iwamoto et al. (1999). In our models, a substantial fraction of Cu and Zn is produced by SNeIa, following the suggestions of Matteucci et al. (1993).
4 Results
4.1 The closed-box picture
In this section we briefly discuss the results obtained in the framework of the closed-box self-enrichment scenario, where any matter exchange between the proto- Cen and its environment is strictly forbidden.
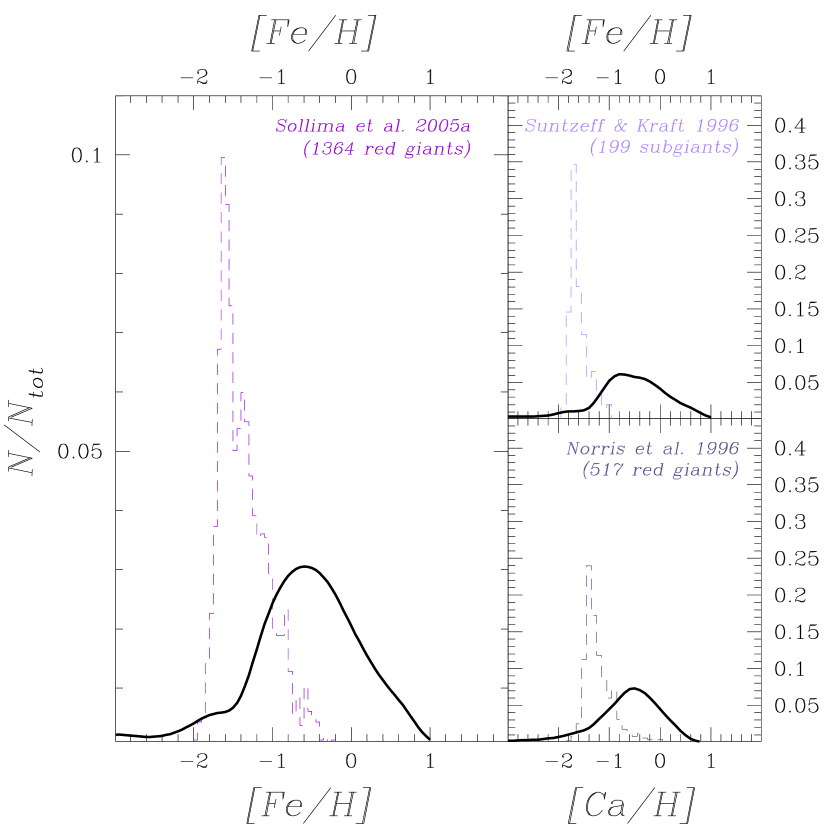
In Fig. 2, the theoretical metallicity distribution as a function of [Fe/H] or [Ca/H] (thick solid lines) is compared with the photometric and spectroscopic empirical ones (thin dashed histograms; Norris et al. 1996; Suntzeff & Kraft 1996; Sollima et al. 2005a). This comparison shows the shortcomings of this simple picture. In the context of a closed-box evolution, metallicities much higher than observed are quickly attained, so that most of the stars form from matter with a chemical composition from one tenth of solar to supersolar, at variance with the observations.
The results displayed in Fig. 2 are for the Scalo (1986) IMF, that – owing to its steeper slope for 2 M⊙ with respect to Salpeter’s, = 1.7 rather than 1.35 – allows a lower fraction of high-mass stars to pollute the ISM with their metal-rich ejecta. Obviously, by adopting a Salpeter IMF the predicted distribution goes towards even higher metallicities. Flattening the IMF in the very low stellar mass domain, as in a Kroupa et al.’s (1993) IMF, does not prevent the system from suddenly reaching too much high metal abundances. Even in the framework of extreme scenarios where the formation of SNIa progenitors is suppressed and lower Fe yields from core collapse SNe are assumed (Chieffi & Limongi, in preparation), we still fail to reproduce the observed MDF. Since within the scheme of a closed-box self-enrichment we can not fulfil even such a basic observational constraint, we deem it meaningless to analyze further the model results and switch to the ‘open’ scenarios.
Indeed, only if a substantial fraction of SN ejecta escapes from the cluster, the observed MDF can be reproduced. Our result supports the findings of Ikuta & Arimoto (2000) that significant outflow from the cluster is needed in order to reduce the effective yield per stellar generation. Ikuta & Arimoto (2000) obtained the best fit to the observed MDF with a model involving gas outflow, infall at the very early stage of chemical evolution and a bimodal IMF. However, the duration of star formation for their best-fit model was only 0.28 Gyr, much shorter than that inferred from current observations and assumed here.
4.2 A stripped dwarf galaxy?
An open, small-mass model hence offers a viable solution, but the questionable assumption has to be made that, while SN products easily leave the cluster, the stellar wind ejecta are completely retained and the surrounding medium remains unperturbed. The current mass of Cen is unlikely to generate sufficient dynamical friction to modify its orbit to its present small size (Majewski et al. 2000). Dynamical modeling, however, points out that the long and complex star formation history of Cen is inconsistent with the cluster originating on its present orbit: with a period of only 120 Myr (Dinescu et al. 1999), the frequent disc crossings would have swept out all the intracluster gas very soon, leading to a mono-metallicity system. Thus, the progenitor of Cen must have been a massive enough system to allow dynamical friction to drag it to the inner Galactic regions (Bekki & Freeman 2003). In light of these considerations, in the following we discuss the results for a nucleated dwarf hosting Cen with initial mass = 109 M⊙. After a 3 Gyr evolution, the parent system has lost most of its gas through galactic winds and ended up with a stellar mass 108 M⊙, which is consistent with that of Cen’s parent galaxy according to the computations of Bekki & Freeman (2003).
4.2.1 Stellar metallicity distribution and age-metallicity relation
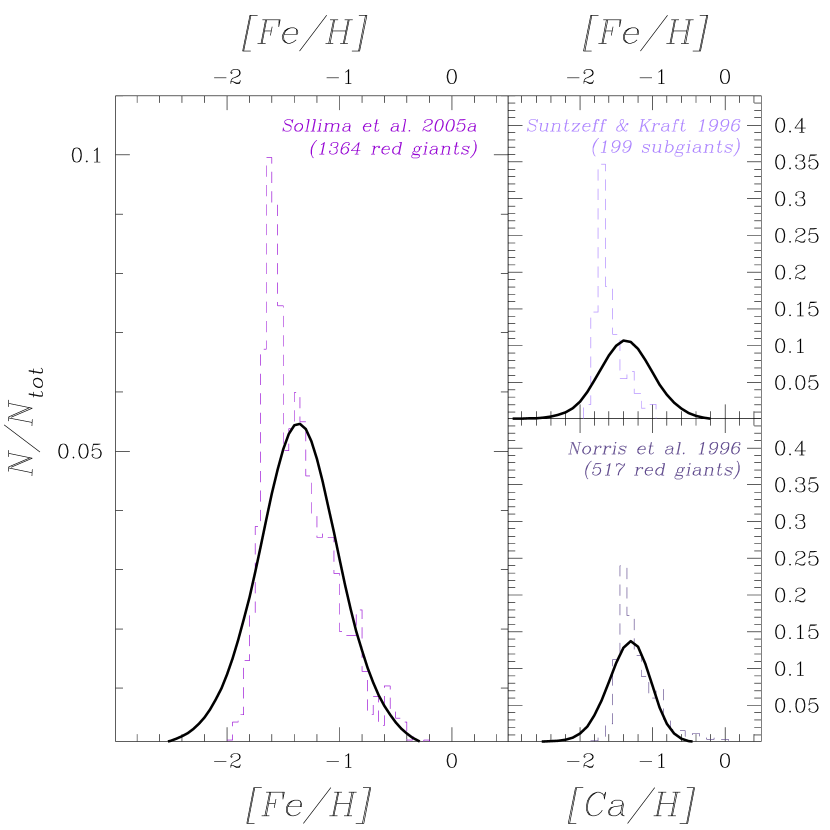
The observed MDF of long-lived stars in a galaxy is an important record of its past evolution. In fact, the relative numbers of stars which formed at any metallicity testify the interplay of fundamental processes such as star formation, infall of gas from the surroundings and metal-enriched gas outflows at any time. Reproducing the currently observed MDF of Cen’s stars significantly restrains the free parameter space of our dwarf galaxy model. We find that a fast early collapse coupled with an intense (per unit mass) star formation activity, 0.1 M⊙ yr-1 during the first 1 Gyr evolution, gives rise to a distribution peaked at [Fe/H] 1.6, as observed (Fig. 3, left panel), thanks to the strong galactic wind which efficiently removes the metals from the proto- Cen. In our model, the thermal energy of the gas exceeds its binding energy nearly 200 million years after the onset of the star formation, owing to multiple SN explosions: the gas is then swept away by a strong galactic wind and the star formation slowly fades. We impose that the wind is differential, namely that the SN ejecta leave the galaxy more easily than the stellar wind ejecta (see also Recchi et al. 2001). In particular, by assuming a wind efficiency 5 Gyr-1 for the SN ejecta, no stars with [Fe/H] 0.4 dex are formed, in agreement with the observations (Fig. 3, left panel). Such high outflow rates – more than ten times the SFR – are often required to reproduce the high-quality data of nearby dwarf spheroidals (Lanfranchi & Matteucci 2003, 2004). In Fig. 3 we compare the predictions of this model (thick solid lines) with the same observed distributions of Figs. 1 and 2. Both the steep rise at low metallicities and the extended metallicity tail are well reproduced; in particular, the agreement with the up-to-date distribution of Sollima et al. (2005a) is strikingly good. This is encouraging, but the model has to be tested against many more observational constraints in order to prove its validity.
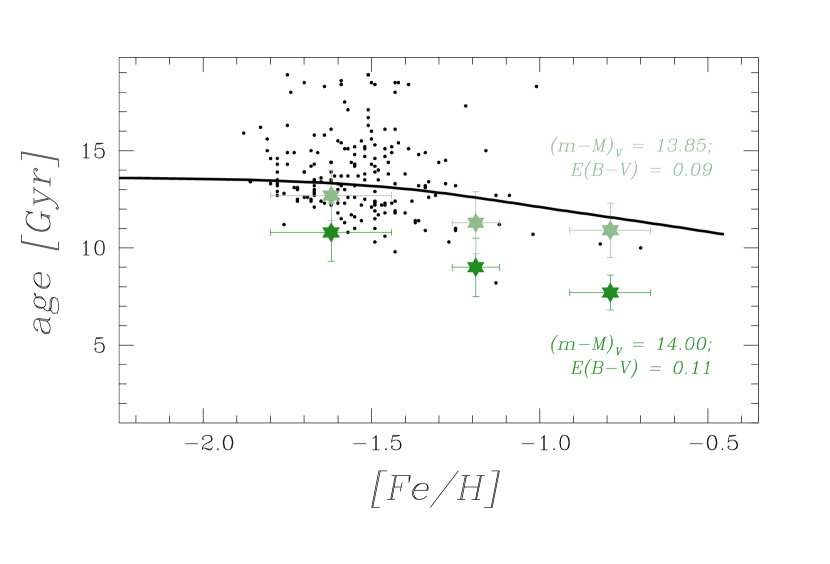
In a recent study by Hilker et al. (2004; see also Kayser et al. 2006), newly derived spectroscopic abundances of iron for 400 Cen members have been used in combination with the location of the stars in the CMD to infer the age-metallicity relation (AMR) of the system. The suggested age spread is about 3 Gyr and there is some indication that the AMR could level off above [Fe/H] 1.0 dex. This is clearly seen in Fig. 4, where the stars with the error bars represent the AMR for the subsample of stars with most reliable age and metallicity determinations, for two choices of the reddening and distance modulus values (see Hilker et al. 2004; their table 1). Evidence for the most metal-rich stellar populations of Cen being younger by 2–4 Gyr than the most metal-poor one has been found also by Stanford et al. (2006) from extensive Monte Carlo simulations on their MSTO data (Fig. 4, dots)333 Note that such an age difference seems inconsistent with the results obtained by Ferraro et al. (2004) and Sollima et al. (2005b) from the magnitude level, shape and extension of the turnoff region.. Although a large dispersion is present in the data, our model clearly predicts the correct run of metallicity with age (Fig. 4, thick solid line). Notice that in our model the SFR goes to zero after a 3 Gyr evolution, when [Fe/H] 0.4 dex, because of the strong galactic outflows which efficiently remove any residual gas from the galaxy (see previous paragraph).
4.2.2 Abundance ratios
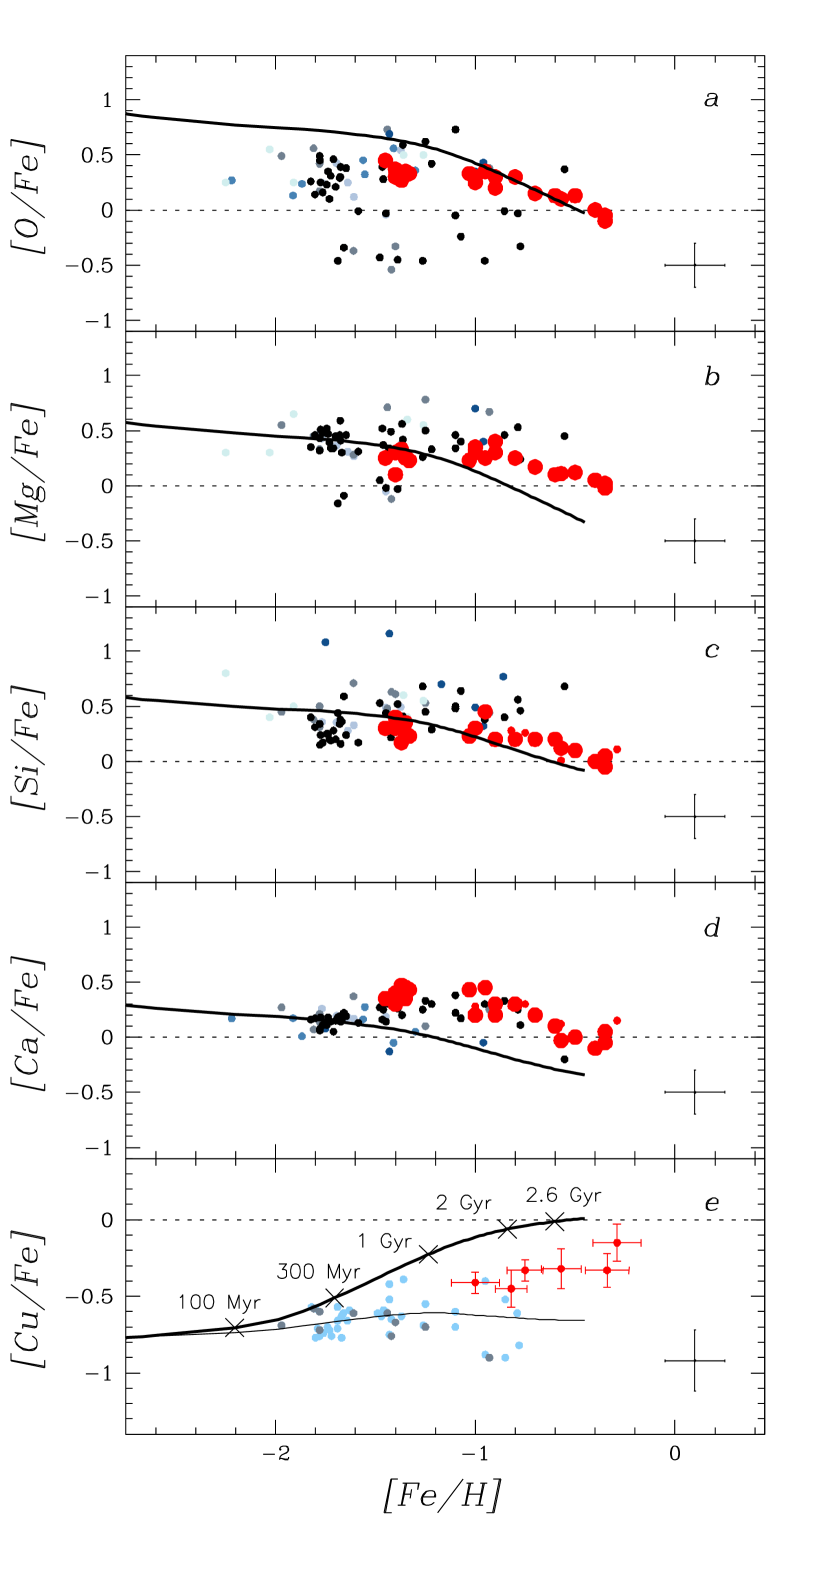
In Fig. 5 we display our predictions for several abundance ratios as a function of [Fe/H] (thick solid lines). The data displayed in Fig. 5 (circles) have been collected from the literature. Data from high-resolution optical spectra (François, Spite & Spite 1988; Brown & Wallerstein 1993; Norris & Da Costa 1995; Smith et al. 1995, 2000; Cunha et al. 2002; Pancino et al. 2002; Vanture et al. 2002) are shown as small circles. Data from low- and medium-resolution infrared spectra (Origlia et al. 2003) are shown as big circles.
We have checked that all literature abundance ratios are in reasonable agreement with each other (we consider two studies in reasonable agreement when the abundances of the stars in common do not differ, on average, by more than 0.1 dex, which is the typical uncertainty of the measurements). As far as [Fe/H] is concerned, most papers agree with each other with the exceptions of François et al. (1988), Pancino et al. (2002), Vanture et al. (2002) and Origlia et al. (2003), all having [Fe/H] 0.2 dex lower, which is a marginal ( 2 ) discrepancy. We therefore compared atmospheric parameters (, and ), atomic data () and equivalent width (EW) measurements among the above studies, to find possible explanations for the discrepancies. In the case of François et al., the turbolent velocities are significantly lower ( 0.5 km s-1) and the adopted solar composition is significantly higher, (Fe)⊙ = 7.67. Vanture et al. have instead a much lower (by 0.4 km s-1) than average, and slightly lower ( 0.06 dex). In the case of Pancino et al., all parameters appear in good agreement with the other literature sources, but for the only star in common (ROA 371) there is an average difference in EW of 6.5 mÅ. All these factors together suggest that we should revise the François et al., Pancino et al. and Vanture et al. [Fe/H] values upwards by 0.2 dex. Origlia et al. have only stars in common with Pancino et al., with differences in ( 150 K), ( 0.3 dex) and ( 0.3 km s-1), but very similar abundances. Even if we do not have the tools to fully understand the cause of the discrepancies (the method, resolution and spectral range employed by Origlia et al. are very different from the rest of the papers), we choose to revise the [Fe/H] values upwards by 0.2 dex, in conformity with what done for François et al. (1988), Pancino et al. (2002) and Vanture et al. (2002).
Concerning the -elements, there is a good agreement among various studies, except for a few notable exceptions. Oxygen is a very difficult element to measure, since only one line, [O I] at 6300 Å, is used by most authors, that lies in a region plagued by atmospheric O absorption and is blended with a Ni I and a Sc II line. However, some authors also include the weak 6363 Å line in their analysis, while only part of the authors perform a full spectral synthesis on the region. In spite of this, the abundance determinations are in reasonable agreement with each other, with the marginal exception of Vanture et al. (2002), that we choose to leave as it is, since the overall scatter in [O/Fe] is significantly larger than for other elements (see Fig. 5). For Mg I, Smith et al. (2000) have an abundance 0.2 dex higher than average, which is partly explained by the lower ( 0.1 dex) of the employed lines. We therefore lower the Smith et al. [Mg/Fe] abundances by 0.1 dex, bringing them in reasonable agreement with other determinations. Silicon abundances are a tricky business, since there is a general disagreement among authors (only François et al. 1988 and Smith et al. 2000 appear to be on the same scale), but no clear cause for the discrepancies emerges from our analysis, so we choose to apply no correction for this particular element. The Ca I determination by Norris & Da Costa (1995) is 0.2 dex higher than all other studies considered here, that is fully taken into account by the 0.2 dex lower values adopted by those authors, so we revise Norris & Da Costa’s [Ca/Fe] downwards by 0.2 dex.
Finally, only two papers have studied Cu in Cen so far, namely Pancino et al. (2002) and Cunha et al. (2002), having only one star in common, ROA 371. The linelist for the synthesis of the Cu I 5782 Å line used is different in the two papers. The adopted atmospheric parameters are very similar, but the solar copper abundances differ by 0.09 dex. All this together makes an 0.2 dex difference between the two studies of ROA 371 ([Cu/Fe] = 0.33 in Pancino et al. and [Cu/Fe] = 0.52 in Cunha et al.) as can be seen from fig. 6 of Cunha et al. (2002). However, if we adopt the Grevesse & Sauval (1998) solar composition for Cunha et al., as in Fig. 5, the discrepancy rises to 0.3 dex ([Cu/Fe] = 0.61 in Cunha et al.). We choose to use the same solar abundance (Grevesse & Sauval 1998), to put into evidence the real discrepancy between the two studies, which reflects the actual uncertainty in the derivation of Cu abundances.
Theoretical values are normalized to the solar ones of Grevesse & Sauval (1998). Elements such as carbon and nitrogen are not considered, as their original abundances could be easily altered in the atmospheres of the sampled giant stars444 Actually, a large scatter is present also in the abundances of oxygen. Although commonly explained as the signature of processing in the CNO cycle (e.g. Norris & Da Costa 1995), it is worth stressing that it could be at least partly due to the wealth of observational problems discussed above.. The neutron capture elements Y, Ba, La and Eu deserve special attention and will be treated in detail elsewhere (Romano et al., in preparation).
It can be seen that the model reproduces satisfactorily the decreasing trend of various [/Fe] ratios with time (metallicity), with the possible exception of Mg, which is underestimated for [Fe/H] 1.0. Appropriate adjustment of the adopted nucleosynthesis prescriptions and IMF slope would make the model predictions fit the data even better. Indeed, François et al. (2004) find that the Nomoto et al. (1997) yields of Mg we are using need significant corrections to best fit the abundance data of very metal-poor Galactic halo stars, and the stellar mass function is known to flatten in the very-low stellar mass domain (e.g. Kroupa et al. 1993; Chabrier 2003). However, what really matters here is to provide an overall, coherent interpretative framework for the whole body of data for Cen, rather than to attempt to precisely fit a specific observational constraint.
The high ratios of [O/Fe], [Mg/Fe], [Si/Fe] and [Ca/Fe] for [Fe/H] 1.2 clearly point to SNeII as the major drivers of the chemical enrichment. Yet, the indication of a decrease of these abundance ratios in the intermediate and metal-rich subpopulations (Pancino et al. 2002; Origlia et al. 2003) are the unmistakable sign of significant Type Ia SN pollution, occuring at later times but before star formation stops.
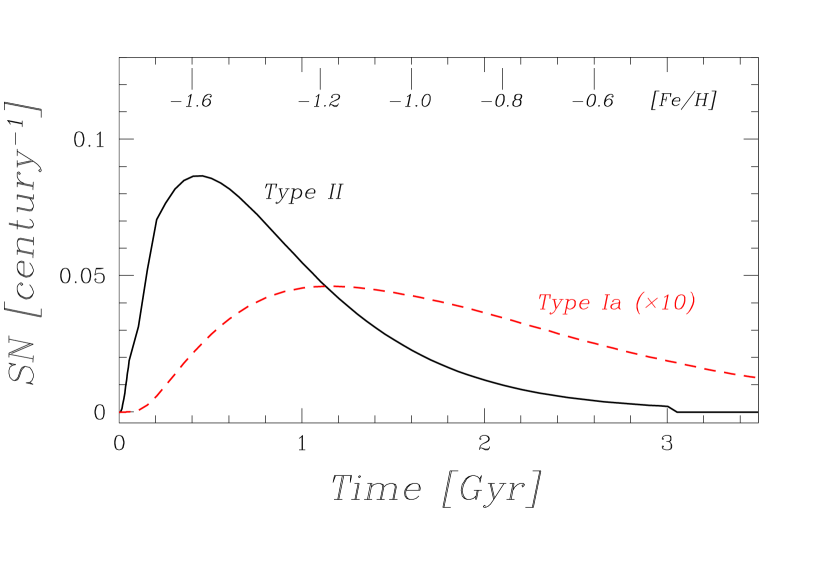
As far as copper is concerned, it is worth stressing that the flat behaviour of the [Cu/Fe] data indicates no evolution in the copper-to-iron yields over much of the chemical evolution within Cen (see Fig. 5, panel e, circles, and Cunha et al. 2002, their fig. 6). Yet, from Fig. 5, panel e, it is seen that our chemical evolution model (thick solid curve) overpredicts the copper-to-iron ratio over the whole metallicity range. The predicted behaviour of [Cu/Fe] results from the assumption that the major astrophysical site for the synthesis of Cu are SNeIa (Matteucci et al. 1993), and these stellar factories happen to contribute to the chemical enrichment of Cen already at the lowest metallicities. This is apparent from Fig. 6, where we show the Type II (solid line) and Type Ia (dashed line) SN rates predicted by our model for Cen. The SNIa rate has been multiplied by a factor of ten to make it clearly visible. SNeII appear soon (a few million years) after their massive progenitors are born, thus their rate closely follows the SFR. SNeIa, instead, come from intermediate- to low-mass stellar progenitors in binary systems (Matteucci & Greggio 1986), which explode on varying time-scales: they start to contribute significantly to the chemical enrichment of the proto- Cen 400 Myr after the beginning of star formation, when the ISM has attained a metallicity of [Fe/H] 1.6 (Fig. 6, upper x axis), while the maximum enrichment takes place only several Myr later, at 1.1 Gyr, when [Fe/H] 1.2555Notice that a bimodal distribution of the delay times for the explosion, with ‘prompt’ and ‘tardy’ events, has recently proven to best match present SNIa data (Mannucci, Della Valle & Panagia 2006).. Later on, at 2.6 Gyr ([Fe/H] 0.6), the contribution from SNeIa nearly equals that from SNeII, but only a few stars form from this SNIa-enriched material before the star formation stops. It is worth emphasizing here that the metal-enriched outflow lengthens the enrichment time-scale, i.e. the time that it takes for the ISM to reach a given metallicity: in the absence of such an enriched wind, it would take only 0.7 Gyr for the ISM to reach a metallicity of [Fe/H] 1.2 and 1.8 Gyr to reach [Fe/H] 0.6.
In their 1993 paper, in order to fit the solar neighbourhood data, Matteucci and coworkers adopted Cu yields from SNeIa a factor of 100 higher than predicted by current SNIa models. When adopting the lower Cu yields from SNeIa predicted by Iwamoto et al. (1999), we find a flat behaviour of [Cu/Fe] versus [Fe/H] in Cen (Fig. 5, panel e, thin solid curve). While this is consistent with the data of Cunha et al. (2002), it does not account for the rise for [Fe/H] 1.0 pointed out by Pancino et al. (2002). Clearly, the issue of copper production in stars need to be further investigated. Apart from the flatness, an even more striking feature is the overall Cu deficiency in conjunction with a strong s-process enhancement. The same chemical signature appears to characterize the Sagittarius dwarf spheroidal galaxy, thus lending support to the idea that Cen is the remaining nucleus of an accreted dwarf Galactic satellite (McWilliam & Smecker-Hane 2005).
4.3 Helium enrichment in Cen
In this section, we explore the issue of the helium enrichment in Cen within the picture where this cluster is the compact survivor of a larger satellite system ingested by the Milky Way many Gyr ago.
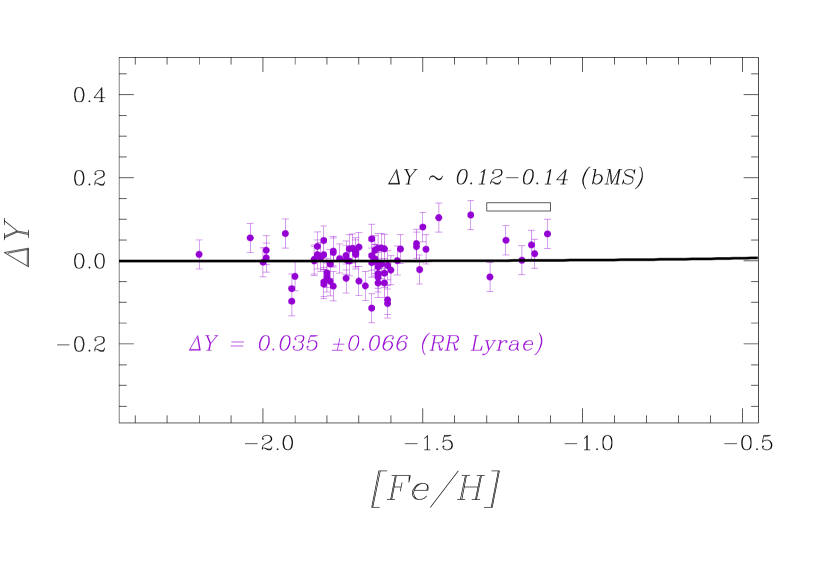
In Fig. 7 we compare the theoretical versus [Fe/H] relation (thick solid line) to the data (box and filled circles). When using standard stellar yields (see Section 3.3), after a 3 Gyr evolution we obtain a negligible increase of the He abundance in the ISM ( = 0.01), thus underestimating by an order of magnitude the level of He enhancement required to explain the bMS and horizontal branch (HB) data ( = 0.12–0.14; Norris 2004; Piotto et al. 2005). Yet, our model predictions are fully consistent with the tiny change in helium abundance ( = 0.035 0.066) over a wide metallicity range (2.2 [Fe/H] 1.1) implied by the observations of 74 RR Lyræ variables by Sollima et al. (2006a). The fact that there is a population of metal-intermediate RR Lyræ stars in Cen with luminosity and pulsational properties that are incompatible with a significant helium overabundance adds new complexity to the peculiar chemical features of Cen, as it entails the coexistence of two populations with similar metallicities but very different helium abundances in the cluster (Sollima et al. 2006a).
The stars on the blue side of the MS show no spread in metallicity (Piotto et al. 2005), thus suggesting that they formed from a well-homogenized medium. On the other hand, in order to elevate from its primordial value 0.248 to 0.40 one must assume that the material from which the bMS stars formed was made up almost entirely of pure ejecta from previous stellar generations (Norris 2004). In fact, as long as the fresh ejecta of dying stars are diluted and mixed up with pre-existing gas in the framework of a homogeneous chemical evolution model, there is no way of attaining a significant helium enrichment of the ISM by the time the metallicity increases from [Fe/H] 2.0 to 1.2 dex (see Fig. 7, solid line). This result is independent of the adopted stellar yields, as can be immediately understood from an inspection of Figs. 8 and 9. There, we show the mass fraction of He in the ejecta of LIMSs and massive stars as a function of stellar mass, calculated as
| (6) |
where is the initial helium abundance of the star, is the stellar yield, namely the fractional mass of the star of initial mass which is restored to the ISM in the form of newly produced He, and is the mass of the remnant.
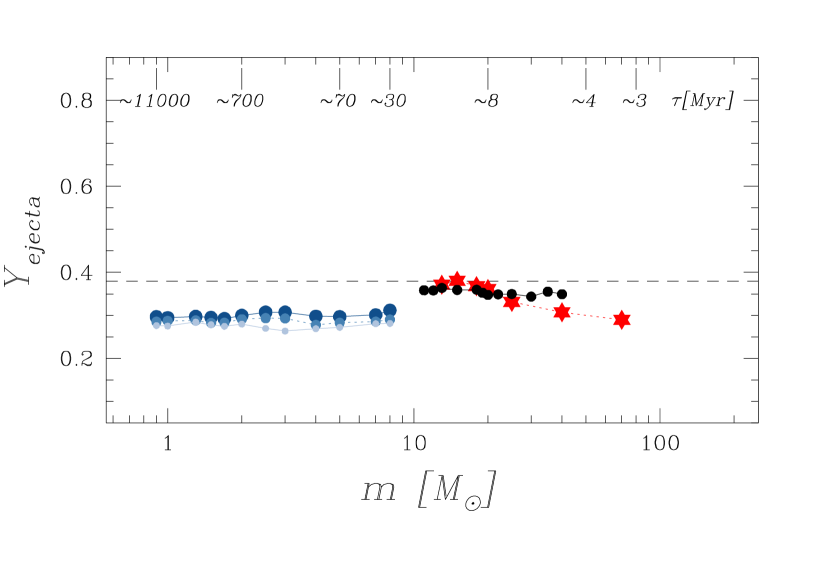
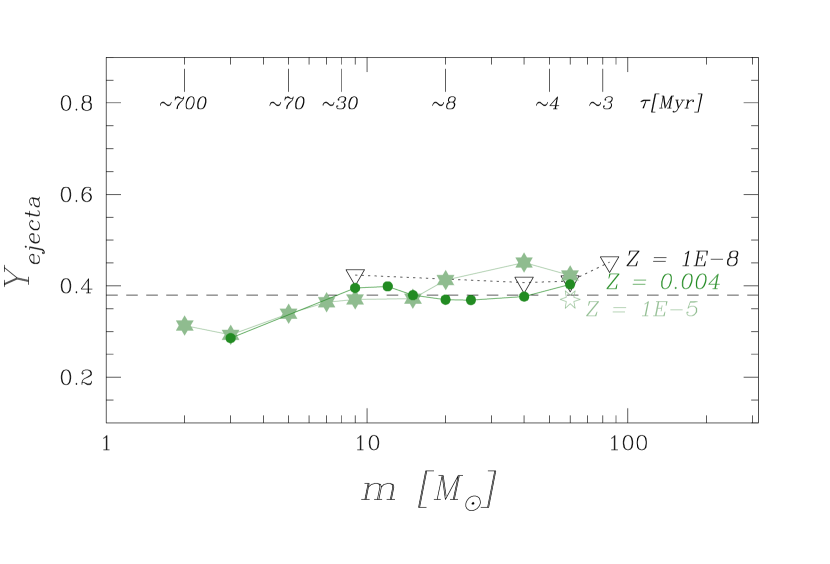
The quantities displayed in Fig. 8 have been computed using the tables of van den Hoek & Groenewegen (1997) for LIMSs and Nomoto et al. (1997; stars) and Woosley & Weaver (1995; filled circles) for massive stars. In the case of van den Hoek & Groenewegen’s yields, the bigger the size of the symbol, the higher the initial metallicity of the star ( = 0.001, 0.004, 0.008). The quantities displayed in Fig. 9 have been computed using the tables of Meynet & Maeder (2002), Hirschi (2006) and Meynet et al. (2006) for rotating stars, for different initial metallicities and/or rotational velocities of the stars (see figure caption). We refer to those authors for details about the stellar model assumptions. In the case of the standard yields (Fig. 8), is always below the quantity needed to explain the bMS data. Rotating stars, instead, do actually (slightly) exceed = 0.38 in the high-mass domain, but below 8 M⊙ they always contribute a much lower He amount (Fig. 9). Since, according to the Salpeter IMF we are using, in each stellar generation about 85 per cent of the mass falls in the 0.1–8 M⊙ mass range, it is easy to guess that after the 1 Gyr evolution needed to achieve [Fe/H] 1.2 in the ISM, the average helium abundance of the medium out of which the bMS stars form will be definitely lower than required. Indeed, when including the yields of the Geneva group in our homogeneous chemical evolution model, we always find 0.30 ( 0.05). We will come back to the issue of the helium enrichment in Cen in a future paper (Romano et al., in preparation).
5 Discussion and conclusions
In this work we study the formation and evolution of the anomalous globular cluster Cen. The constraints established by the wealth of very good-quality abundance data for its member stars collected over the last decade significantly restrain the evolutive picture. We show that in the framework of the closed-box self-enrichment scenario (still an often used approximation) the metallicity distribution function of Cen’s stars can not be reproduced. On the other hand, the main chemical properties of Cen are nicely reproduced if it is the compact remnant of a dwarf spheroidal galaxy evolved in isolation and then accreted – and partly disrupted – by the Milky Way. This evolutive picture has already allowed different authors to explain the present-day peculiar location near the Galactic centre and surface brightness profile of Cen (see, e.g., Bekki & Freeman 2003; Tsuchiya et al. 2004; Ideta & Makino 2004); our analysis gives further strength to the accreted dwarf picture by proving that the ingested satellite would also have similar chemical properties to Cen. Indeed, by assuming a relatively long-lasting star formation activity (though with most of the stars forming within 1 Gyr), standard IMF and standard stellar yields, our models satisfactorily reproduce several observed abundance ratios as a function of [Fe/H].
Regarding the helium abundances of Cen, a great deal of work has been recently devoted to the enigma of the anomalous helium-to-metal enrichment of bMS and hot HB stars (Norris 2004; Lee et al. 2005; Piotto et al. 2005; Bekki & Norris 2006; Maeder & Meynet 2006). Stars which populate the ‘blue hook’ region could have suffered an unusually large mass loss on the RGB and, consequently, experienced the helium core flash while descending the white dwarf cooling curve (Moehler et al. 2002). Therefore, it is not clear which fraction of the He enhancement truly reflects the pristine abundance. Stars on the bMS, instead, likely give more trustworthy indication: they point to = 0.12–0.14 ( 70). Recent observations of RR Lyræ stars suggest that a population with a normal (i.e. nearly primordial) helium content inhabits the cluster as well, thus complicating the overall picture (Sollima et al. 2006a). Our homogeneous chemical evolution model, when adopting a 3 Gyr long star formation history, standard yields and Salpeter’s IMF, predicts that the helium abundance in the ISM almost does not change during the cluster’s progenitor evolution, in agreement with the RR Lyræ star data, but in sharp disagreement with the abundances inferred for the bMS. We compare existing helium yields for low-metallicity rotating stars to the outputs of standard stellar evolution which does not take rotation into account, and find that the winds of massive stars of intermediate rotation velocities do indeed eject significant amounts of He (see also Maeder & Meynet 2006). However, once weighted with a normal IMF, the helium yield of a stellar generation turns out to be lower than that required to explain the bMS anomalies (see Section 4.3). It is worth noticing at this point that even if the escape of SN ejecta through galactic winds helps to keep the global metal content of the galaxy low, thus favouring high values, it also leads to longer enrichment time-scales (see Section 4.2.2), thus allowing low- and intermediate-mass stars to spread their relatively helium-poor gas through the ISM. Ad hoc scenarios in which the winds of massive stars remain confined and pollute only the central regions where the He-rich MS stars are actually more concentrated may represent a way out of the problem. Helium diffusion has recently been proposed as a viable mechanism to significantly increase the helium content of protostellar clouds (Chuzhoy 2006).
Assuming an IMF strongly biased towards massive stars could also solve the problem, but current observational evidence seems to favour a Salpeter-like IMF in dwarf spheroidals as well as Galactic globulars (Wyse 2005, and references therein). Another option would be that the bMS was formed apart as a star cluster and then merged with the rMS in the central region of Cen’s host galaxy, a possibility first pointed out by Bekki & Norris (2006). We note that if the star cluster originated mostly from matter ejected by slow winds from rotating massive stars with [Fe/H] 1.2, then it would have both the high helium abundance and uniform metallicity inferred from bMS observations. Measuring the helium abundances of stars more metal-rich than [Fe/H] 1.0 would help us to discriminate between a scenario where the helium abundance in the ISM monotonically increases with time and a scenario where the formation of a helium-rich population is a fortuitous event occurred on a short time-scale under very special conditions. We will examine these scenarios in detail in a forthcoming paper, together with the most updated (even ad hoc) nucleosynthesis prescriptions.
Acknowledgments
We thank L. Stanford for kindly providing her data in machine-readable format.
References
- [1] Anderson A. J., 1997, Ph.D. Thesis, Univ. California, Berkeley
- [2] Bedin L. R., Piotto G., Anderson J., Cassisi S., King I. R., Momany Y., Carraro G., 2004, ApJ, 605, L125
- [3] Bekki K., Freeman K. C., 2003, MNRAS, 346, L11
- [4] Bekki K., Norris J. E., 2006, ApJ, 637, L109
- [5] Bradamante F., Matteucci F., D’Ercole A., 1998, A&A, 337, 338
- [6] Brown J. A., Wallerstein G., 1993, AJ, 106, 133
- [7] Carraro G., Lia C., 2000, A&A, 357, 977
- [8] Chabrier G., 2003, PASP, 115, 763
- [9] Chuzhoy L., 2006, MNRAS, 369, L52
- [10] Cohen J. G., 1981, ApJ, 247, 869
- [11] Cohen J. G., Bell R. A., 1986, ApJ, 305, 698
- [12] Cunha K., Smith V. V., Suntzeff N. B., Norris J. E., Da Costa G. S., Plez B., 2002, AJ, 124, 379
- [13] Dinescu D. I., 2002, in van Leeuwen F., Hughes J. D., Piotto G., eds, ASP Conf. Ser. Vol. 265, Omega Centauri: A Unique Window into Astrophysics. Astron. Soc. Pac., San Francisco, p. 365
- [14] Dinescu D. I., Girard T. M., van Altena W. F., 1999, AJ, 117, 1792
- [15] Fellhauer M., Kroupa P., Evans N. W., 2006, MNRAS, 372, 338
- [16] Ferraro F. R., Bellazzini M., Pancino E., 2002, ApJ, 573, L95
- [17] Ferraro F. R., Sollima A., Pancino E., Bellazzini M., Straniero O., Origlia L., Cool A. M., 2004, ApJ, 603, L81
- [18] Ferraro F. R., Sollima A., Rood R. T., Origlia L., Pancino E., Bellazzini M., 2006, ApJ, 638, 433
- [19] François P., Spite M., Spite F., 1988, A&A, 191, 267
- [20] François P., Matteucci F., Cayrel R., Spite M., Spite F., Chiappini C., 2004, A&A, 421, 613
- [21] Freeman K. C., 1993, in Smith G. H., Brodie J. B., eds, ASP Conf. Ser. Vol. 48, The globular clusters-galaxy connection. Astron. Soc. Pac., San Francisco, p. 608
- [22] Freeman K. C., Rodgers A. W., 1975, ApJ, 201, L71
- [23] Frinchaboy P. M., Rhee J., Ostheimer J. C., Majewski S. R., Patterson R. J., Johnson W. Y., Dinescu D. I., Palma C., Westfall K. B., 2002, in van Leeuwen F., Hughes J. D., Piotto G., eds, ASP Conf. Ser. Vol. 265, Omega Centauri: A Unique Window into Astrophysics. Astron. Soc. Pac., San Francisco, p. 143
- [24] Gnedin O. Y., Zhao H., Pringle J. E., Fall S. M., Livio M., Meylan G., 2002, ApJ, 568, L23
- [25] Gratton R. G., 1982, A&A, 115, 336
- [26] Gratton R., Sneden C., Carretta E., 2004, ARA&A, 42, 385
- [27] Grevesse N., Sauval A. J., 1998, Space Sci. Rev., 85, 161
- [28] Harbeck D., et al., 2001, AJ, 122, 3092
- [29] Harris, W. E., 1996, AJ, 112, 1487
- [30] Hilker M., Richtler T., 2000, A&A, 362, 895
- [31] Hilker M., Kayser A., Richtler T., Willemsen P., 2004, A&A, 422, L9
- [32] Hirschi R., 2006, A&A, in press (astro-ph/0608170)
- [33] Hughes J., Wallerstein G., 2000, AJ, 119, 1225
- [34] Icke V., Alcaino G., 1988, A&A, 204, 115
- [35] Ideta M., Makino J., 2004, ApJ, 616, L107
- [36] Ikuta C., Arimoto N., 2000, A&A, 358, 535
- [37] Iwamoto K., Brachwitz F., Nomoto K., Kishimoto N., Umeda H., Hix W. R., Thielemann F.-K., 1999, ApJS, 125, 439
- [38] Kayser A., Hilker M., Richtler T., Willemsen P. G., 2006, A&A, 458, 777
- [39] Koch A., Grebel E. K., Wyse R. F. G., Kleyna J. T., Wilkinson M. I., Harbeck D. R., Gilmore G. F., Evans N. W., 2006, AJ, 131, 895
- [40] Kroupa P., Tout C. A., Gilmore G., 1993, MNRAS, 262, 545
- [41] Lanfranchi G. A., Matteucci F., 2003, MNRAS, 345, 71
- [42] Lanfranchi G. A., Matteucci F., 2004, MNRAS, 351, 1338
- [43] Lee Y.-W., Joo J.-M., Sohn Y.-J., Rey S.-C., Lee H.-C., Walker A. R., 1999, Nat, 402, 55
- [44] Lee Y.-W., et a., 2005, ApJ, 621, L57
- [45] Lloyd Evans T., 1983, MNRAS, 204, 975
- [46] Maeder A., Meynet G., 2006, A&A, 448, L37
- [47] Majewski S. R., Patterson R. J., Dinescu D. I., Johnson W. Y., Ostheimer J. C., Kunkel W. E., Palma C., 2000, in Noels A., Magain P., Caro D., Jehin E., Parmentier G., Thoul A. A., eds, The Galactic Halo : From Globular Cluster to Field Stars. Institut d’Astrophysique et de Géophysique, Liège, p. 619
- [48] Mallia E. A., Pagel B. E. J., 1981, MNRAS, 194, 421
- [49] Mannucci F., Della Valle M., Panagia N., 2006, MNRAS, 370, 773
- [50] Mateo M. L., 1998, ARA&A, 36, 435
- [51] Matteucci F., Greggio L., 1986, A&A, 154, 279
- [52] Matteucci F., Recchi S., 2001, ApJ, 558, 351
- [53] Matteucci F., Raiteri C. M., Busso M., Gallino R., Gratton R., 1993, A&A, 272, 421
- [54] McWilliam A., Smecker-Hane T. A., 2005, ApJ, 622, L29
- [55] Merritt D., Meylan G., Mayor M., 1997, AJ, 114, 1074
- [56] Meza A., Navarro J. F., Abadi M. G., Steinmetz M., 2005, MNRAS, 359, 93
- [57] Meylan G., Mayor M., Duquennoy A., Dubath P., 1995, A&A, 303, 761
- [58] Meynet G., Maeder A., 2002, A&A, 390, 561
- [59] Meynet G., Ekström S., Maeder A., 2006, A&A, 447, 623
- [60] Moehler S., Sweigart A. V., Landsman W. B., Dreizler S., 2002, A&A, 395, 37
- [61] Nomoto K., Hashimoto M., Tsujimoto T., Thielemann F.-K., Kishimoto N., Kubo Y., Nakasato N., 1997, Nucl. Phys. A, 616, 79c
- [62] Norris J. E., 2004, ApJ, 612, L25
- [63] Norris J. E., Da Costa G. S., 1995, ApJ, 447, 680
- [64] Norris J. E., Freeman K. C., Mighell K. J., 1996, ApJ, 462, 241
- [65] Norris J. E., Freeman K. C., Mayor M., Seitzer P., 1997, ApJ, 487, L187
- [66] Origlia L., Ferraro F. R., Bellazzini M., Pancino E., 2003, ApJ, 591, 916
- [67] Pancino E., Ferraro F. R., Bellazzini M., Piotto G., Zoccali M., 2000, ApJ, 534, L83
- [68] Pancino E., Pasquini L., Hill V., Ferraro F. R., Bellazzini M., 2002, ApJ, 568, L101
- [69] Pancino E., Seleznev A., Ferraro F. R., Bellazzini M., Piotto G., 2003, MNRAS, 345, 683
- [70] Piotto G., et al., 2005, ApJ, 621, 777
- [71] Platais I., Wyse R. F. G., Hebb L., Lee Y.-W., Rey S.-C., 2003, ApJ, 591, L127
- [72] Recchi S., Matteucci F., D’Ercole A., 2001, MNRAS, 322, 800
- [73] Rey S.-C., Lee Y.-W., Ree C. H., Joo J.-M., Sohn Y.-J., Walker A. R., 2004, AJ, 127, 958
- [74] Richer H. B., Fahlman G. G., Buonanno R., Fusi Pecci F., Searle L., Thompson I. B., 1991, ApJ, 381, 147
- [75] Romano D., Tosi M., Matteucci F., Chiappini C., 2003, MNRAS, 346, 295
- [76] Romano D., Tosi M., Matteucci F., 2006, MNRAS, 365, 759
- [77] Salpeter E. E., 1955, ApJ, 121, 161
- [78] Scalo J. M., 1986, Fundam. Cosmic Phys., 11, 1
- [79] Schmidt M., 1963, ApJ, 137, 758
- [80] Smith V. V., 2004, in McWilliam A., Rauch M., eds, Carnegie Obs. Astrophys. Ser. Vol. 4, Origin and Evolution of the Elements. Cambridge Univ. Press, Cambridge, p. 186
- [81] Smith V. V., Cunha K., Lambert D. L., 1995, AJ, 110, 2827
- [82] Smith V. V., Suntzeff N. B., Cunha K., Gallino R., Busso M., Lambert D. L., Straniero O., 2000, AJ, 119, 1239
- [83] Sollima A., Ferraro F. R., Pancino E., Bellazzini M., 2005a, MNRAS, 357, 265
- [84] Sollima A., Pancino E., Ferraro F. R., Bellazzini M., Straniero O., Pasquini L., 2005b, ApJ, 634, 332
- [85] Sollima A., Borissova J., Catelan M., Smith H. A., Minniti D., Cacciari C., Ferraro F. R., 2006a, ApJ, 640, L43
- [86] Sollima A., Ferraro F. R., Bellazzini M., Origlia L., Straniero O., Pancino E., 2006b, ApJ, in press (astro-ph/0609650)
- [87] Stanford L. M., Da Costa G. S., Norris J. E., Cannon R. D., 2006, ApJ, 647, 1075
- [88] Suntzeff N. B., Kraft R. P., 1996, AJ, 111, 1913
- [89] Talbot R. J., Jr., Arnett W. D., 1973, ApJ, 186, 51
- [90] Tinsley B. M., 1980, Fundam. Cosmic Phys., 5, 287
- [91] Tolstoy E., et al., 2004, ApJ, 617, L119
- [92] Tsuchiya T., Korchagin V. I., Dinescu D. I., 2004, MNRAS, 350, 1141
- [93] Tsujimoto T., Shigeyama T., 2003, ApJ, 590, 803
- [94] van den Hoek L. B., Groenewegen M. A. T., 1997, A&AS, 123, 305
- [95] van de Ven G., van den Bosch R. C. E., Verolme E. K., de Zeeuw P. T., 2006, A&A, 445, 513
- [96] Vanture A. D., Wallerstein G., Suntzeff N. B., 2002, ApJ, 569, 984
- [97] Zinnecker H., Keable C. J., Dunlop J. S., Cannon R. D., Griffiths W. K., 1988, in Grindlay J. E., Davis Philip A. G., eds, Proc. IAU Symp. 126, The Harlow Shapley Symposium on Globular Cluster Systems in Galaxies. Kluwer, Dordrecht, p. 603
- [98] Woolley R. R., 1966, Royal Obs. Ann., 2, 1
- [99] Woosley S. E., Weaver T. A., 1995, ApJS, 101, 181
- [100] Wyse R. F. G., 2005, in Corbelli E., Palla F., Zinnecker H., eds, The Initial Mass Function 50 years later. Springer, Dordrecht, p. 201