The Alignment between Satellites and Central Galaxies: Theory vs. Observations
Abstract
Recent studies have shown that the distribution of satellite galaxies is preferentially aligned with the major axis of their central galaxy. The strength of this alignment has been found to depend strongly on the colours of the satellite and central galaxies, and only weakly on the mass of the halo in which the galaxies reside. In this paper we study whether these alignment signals, and their dependence on galaxy and halo properties, can be reproduced in a hierarchical structure formation model of a CDM concordance cosmology. To that extent we use a large -body simulation which we populate with galaxies following a semi-analytical model for galaxy formation. We find that if the orientation of the central galaxy is perfectly aligned with that of its dark matter halo, then the predicted central-satellite alignment signal is much stronger than observed. If, however, the minor axis of a central galaxy is perfectly aligned with the angular momentum vector of its dark matter halo, we can accurately reproduce the observed alignment strength as function of halo mass and galaxy color. Although this suggests that the orientation of central galaxies is governed by the angular momentum of their dark matter haloes, we emphasize that any other scenario in which the minor axes of central galaxy and halo are misaligned by (on average) will match the data equally well. Finally, we show that dependence of the alignment strength on the color of the central galaxy is most likely an artefact due to interlopers in the group catalogue. The dependence on the color of the satellite galaxies, on the other hand, is real and owes to the fact that red satellites are associated with subhaloes that were more massive at their time of accretion.
keywords:
dark matter — large-scale structure of the universe — galaxies: halos — galaxies: structure — methods: statistical1 Introduction
Satellite galaxies are a useful tracer of the dark matter distribution on the scale of individual dark matter haloes. Since they are typically distributed over the entire dark matter halo, they are ideally suited as a tracer population of the potential well in which they orbit. In particular, their kinematics can be used to obtain accurate dynamical masses of their host haloes (e.g., McKay et al. 2002; Brainerd & Specian 2003; Prada et al. 2003; van den Bosch et al. 2004; Conroy et al. 2007). In addition, one can also obtain useful constraints from the radial and angular number density distributions of satellite galaxies. For example, a strong photoionizing background may strongly suppress star formation in low-mass (sub)haloes (e.g Quinn, Katz, & Efstathiou 1996; Bullock, Kravtsov & Weinberg 2000; Benson et al. 2002). Hence the observed number of satellite galaxies can be used to put constraints on the efficiency of this process. Furthermore, numerical simulations have shown that dark matter haloes are in general triaxial (e.g., Jing & Suto 2002) and that the massive progenitors are preferentially accreted along the direction of the large-scale filaments (Knebe et al. 2004; Benson 2005; Wang et al. 2005; Zentner et al. 2005; Libeskind et al. 2005). Consequently, the angular distribution of satellite galaxies contains information regarding the shape and orientation of dark matter haloes. This is the topic of this paper.
The alignment of central galaxies with satellite galaxies was first studied nearly four decades ago by Holmberg (1969), who found that satellites are preferentially located along the minor axes of isolated disc galaxies. There have since been many studies with conflicting results (e.g., Hawley & Peebles 1975; Sharp, Lin & White 1979; Zaritsky et al. 1997), mainly because the samples used were relatively small. With the advent of large galaxy surveys, such as the 2-degree Field Galaxy Redshift Survey (2dFGRS) and the Sloan Digital Sky Survey (SDSS), much larger samples can now be constructed to study central-satellite alignments. Recent results from such samples demonstrated that satellite galaxies are in fact preferentially aligned with the major axis of the central galaxies (Brainerd 2005; Yang et al. 2006; Azzaro et al. 2006)111An independent study by Sales & Lambas (2004) based on the 2dFGRS, claimed to detect a minor axis alignment. However, due to an error with their definition of the orientations angles, they actually detected a major axis alignment (see discussion in Yang et al. 2006).. Brainerd (2005) studied a sample of isolated SDSS galaxies and found that the satellites around these galaxies are preferentially oriented along their major axes. Yang et al. (2006; hereafter Y06) studied the alignment between the central galaxies and the distribution of satellite galaxies in a large sample of galaxy groups selected from the SDSS, and confirmed the preference for major axis alignment. In addition, Y06 found that the alignment signal depends on the color of the central and satellite galaxies: it is strongest between red centrals and red satellites, and almost absent between blue centrals and blue satellites. These results, in turn, have been confirmed by Azzaro et al. (2006), who studied the alignments in isolated host-satellite systems in the SDSS. Finally, Y06 found that the strength of the alignment signal increases weakly with increasing group (halo) mass.
The goal of this paper is to examine whether these observed alignment signals can be reproduced in the hierarchical structure formation model. To that extent we use a large -body simulation which has been populated with galaxies following a semi-analytical model for galaxy formation. Our study is similar in spirit to that of Agustsson & Brainerd (2006, hereafter AB06). However, our simulation resolution (see §2) is significantly higher than that used by AB06, allowing us to include satellite galaxies with much lower masses. In addition, we use very different (less restrictive) host-satellite selection criteria, and we also investigate how the alignment strength depends on galaxy color and halo mass, something that was not addressed by AB06. Finally, when comparing our simulation results with observations, we use realistic mock catalogs to take into account various selection effects (see §4).
The outline of the paper is as follows. In §2 we present our numerical simulations, and describe how the orientations of central galaxies are defined and how the alignment signals are analyzed. In §3 we explore the alignments under the hypothesis that the central galaxy is oriented along the major axis of the dark matter halo in projection. In §4 we construct more realistic mock catalogs, which we use to examine how the alignment signal changes due to selection effects. We also investigate two more realistic models for the orientation of the central galaxy; one based on the inertia moment of its halo, the other based on the halo angular momentum. We summarize our results In §5.
2 Methodology
The numerical simulation and semi-analytical model used in this paper are described in detail in Kang et al. (2005a; hereafter K05) and Kang, Jing & Silk (2006). Below we give a brief description of the main ingredients of the model, and we refer the reader to these papers for more details.
2.1 -body simulations and the semi-analytical model
The numerical simulation used here has been carried out by Jing & Suto (2002) using a vectorized-parallel P3M code. It follows the evolution of particles in a cosmological box of , assuming a flat CDM ‘concordance’ cosmology with , , and . Each particle has a mass of . Dark matter haloes are identified using the friends-of-friends (FOF) algorithm with a linking length equal to 0.2 times the mean particle separation. For each halo thus identified we compute the virial radius, , defined as the spherical radius inside of which the average density is times the critical density of the Universe (cf. Bryan & Norman 1998). The virial mass is simply defined as the mass of all particles that have halocentric radii , and is about 15 percent smaller than the FOF mass. Note that is about 30 percent larger than the often used radius , inside of which the average density is times the critical density of the universe. In our alignment analysis, we will use both the (non-spherical) friends-of-friends haloes, and the (spherical) virial haloes, hereafter FOF and VIR haloes, respectively.
Dark matter subhaloes within each FOF (parent) halo are identified using the SUBFIND routine described in Springel et al. (2001). In the present study, we use all haloes and subhaloes with masses down to (10 particles). Using 60 simulation outputs between and , equally spaced in , K05 constructed the merger history for each (sub)halo in the simulation box, which are then used in the semi-analytical model. In what follows, whenever we refer to a halo, we mean a virialized object which is not a sub-structure of a larger virialized object, while subhaloes are virialized objects that orbit within a halo.
In the semi-analytical model it is assumed that the baryonic gas in a halo is heated to the virial temperature of the halo by gravitational shocks. Subsequently, this hot gas cools, radiating away its binding energy, and settles down into the center of the halo to form a central galaxy (White & Rees 1978). The star formation rate in a galaxy is assumed to be proportional to the total amount of cold gas and inversely proportional to the dynamical time of the system. An initial mass function is assumed to estimate the supernova rate, and is combined with a population synthesis model and a dust extinction model to calculate the luminosities in different photometric bands. In addition, our semi-analytical model also accounts for feedback from supernova explosions and active galactic nuclei (see Kang et al. 2006 for details).
In this model, each halo contains a galaxy at its center, which we call the central galaxy, and which is assumed to have the same position and velocity as the most bound particle of its halo. Subhaloes also host galaxies at their center, to which we refer as halo galaxies. They are assigned the position and velocity of the most bound particle of their subhalo. Note that halo galaxies were central galaxies before their host haloes fell into a larger halo. When this happens, the hot gas associated with the smaller progenitor is assumed to be stripped from its halo, and becomes part of the hot gas reservoir of the new parent halo. Consequently, halo galaxies are no longer fed by a cooling flow of new gas, and their star formation terminates as soon as their cold gas reservoir is used up.
Subhaloes are subject to tidal mass loss while they orbit their parent halo. Consequently, subhaloes may be tidally disrupted, or may become too small to be identified by the SUBFIND routine. If this happens its halo galaxy is attached to the most bound particle of its subhalo at the time just before it disappeared from the (sub)halo catalog. In what follows we refer to these galaxies as orphan galaxies. The dark matter mass of the orphan galaxies are defined as the total dark matter mass of the subhalos at the time they are identified as the halo galaxies. The stellar mass of the orphan galaxies are determined according to the star formation evolution model given in detail by K05. The motion of an orphan galaxy is assumed to be governed by dynamical friction, and it is therefore merged with the central galaxy in the halo after a dynamical friction time scale. The combined set of halo and orphan galaxies which are found in VIR (or FOF) haloes are now referred to as satellite galaxies.
2.2 The orientation of central galaxies
We now describe how we use the semi-analytical model described above to compute the alignment between the orientation of the central galaxy and the distribution of its satellite galaxies. In order to measure the required alignments, we first need to specify the orientation of the central galaxies. Unfortunately, the semi-analytical model does not make any predictions regarding either the shape or the orientation of the galaxies. Rather, these have to be put in by hand. We follow AB06 and assume that the orientation of central galaxies is governed by properties of their dark matter haloes. In this paper we consider three scenarios: (i) the orientation of the central galaxy is aligned with the projected major axis of its dark matter halo (see §3), (ii) the minor axis of the central galaxy is aligned with the true, 3-dimensional (3D) minor axis of the dark matter halo (see §4), and (iii) the minor axis of the central galaxy is aligned with the angular momentum vector of the dark matter halo (see §4). Note that scenarios (i) and (ii) are equivalent for spherical and axisymmetric (oblate or prolate) haloes, but not for the more general triaxial haloes. In fact, scenario (i) is unphysical for triaxial haloes, as it depends on the projection axis used (i.e., on the orientation of the line connecting the galaxy and the observer). Clearly, the orientation of a galaxy can not depend on this. The reason for nevertheless adopting this model is twofold. First of all, it maximizes the alignment signal, making it useful to explore various trends. Secondly, the same model was also used by AB06, thus allowing for a meaningful comparison with their results. As discussed above, we will consider two halo definitions, FOF and VIR. In each case, we define the orientations of the halo and the central galaxy using only those particles that are part of the FOF or VIR halo in question.
In order to obtain the orientation of a dark matter halo we determine the principal axes of the inertia tensor of the distribution of dark matter particles. We define the inertia tensor as
| (1) |
where is the position of the particle. In order to reduce the impact of (massive) subhaloes on the determination of the summation is over those particles in the FOF or VIR halo that are not part of a subhalo. In the case of the projected mass distribution, , while in 3D configuration space we use . The eigenvectors of define the orientation of the halo, while the corresponding eigenvalues determine the halo shape.
Finally, we compute the angular momentum vector of each halo using
| (2) |
Here and are the position and velocity vectors of the dark matter particles, is the mean bulk velocity of the halo, and the summation is again over all dark matter particles of the FOF or VIR halo in question that are not part of a subhalo. Tests have shown, however, that none of our alignment results presented below are sensitive to whether we remove these subhalo particles or not.
2.3 Quantifying Alignment
Having defined the orientation of central galaxies, we now proceed to quantify the angular distribution of their satellite galaxies. The satellites are defined as all the halo galaxies and orphan galaxies found within (or the FOF halo). We start by only selecting those galaxies in haloes with and with . Here can be either the FOF or the virial mass, depending on what halo definition we adopt. The mass limit is imposed to ensure that we have a sufficient number of particles () to reliably measure the halo shape, orientation and angular momentum. In addition, the results of Y06, which we use for comparison, have also been restricted to haloes with . The absolute magnitude limit reflects the minimum luminosity for which the SAM can reproduce the luminosity function: the simulation box used does not resolve the halo masses that typically host central galaxies with . These selection criteria yield central galaxies and satellites, of which 58 percent are orphan galaxies. Finally, we split the galaxy population in two subsamples based on their photometric color. Following Y06, we define galaxies with as red galaxies and the rest as blue galaxies. Here is the color in the SDSS and bands, -corrected to .

In our model, the total radial distribution of the satellites are found to be similar with the dark matter particles, but halo galaxies are found to be more less concentrated in the center of the halo, and such distributions are also found by other works (e.g. Gao et al. 2004, Kang et al. 2005, AB06). These For each central-satellite pair we compute the angle , defined as the angle on the projection plane between the position of the satellite galaxy and the major axis of the central galaxy. We restrict to the range , where () implies that the satellite lies along the major (minor) axis of the central galaxy. For a given set of centrals and satellites we then count the total number of central-satellite pairs, , for a number of bins in . Next we construct 100 random samples in which we randomize the orientation of all central galaxies, and we compute , the average number of central-satellite pairs as function of . Note that this ensures that the random samples have exactly the same selection effects as the real sample, so that any significant difference between and reflects a genuine alignment between the orientation of the central galaxies and the distribution of satellite galaxies.
To quantify the strength of any possible alignment we follow Y06 and define the distribution of normalized pair counts:
| (3) |
Note that in the absence of any alignment, while at small implies a satellite distribution with a preferred alignment along the major axis of their centrals. As a measure of the statistical error on we use , where is the standard deviation of obtained from the 100 random samples. We also compute the average angle . Major and minor axis alignments are characterized by and , respectively222Note, however, that does not necessarily imply an isotropic distribution. Therefore, the statistic is more informative.. The significance of such an alignment can be expressed in terms of , defined as the variance in as obtained from the 100 random samples.
3 The Alignment in Dark Matter Haloes

In this section, we first study the alignment signal between central and satellite galaxies using the distribution of galaxies taken directly from the simulation box and projected along the -axis (arbitrary). Here we ignore all observational selection effects: we do not model redshift-space distortions, nor do we consider a flux-limit. In addition, we consider all central-satellite pairs (with ) that reside in the same dark matter halo (with ). The analysis of Y06, to which we will compare our results, however, is based on a flux-limited redshift survey, in which centrals and satellites are grouped together using a galaxy group finder. This results in interlopers and incompleteness, which are not accounted for here. Rather, the results presented in this section represent the true, uncontaminated alignment strengths present in our (projected) simulation box. In §4 we will examine the impact of observational selection effects by using realistic mock catalogues to which we apply the same galaxy group finder as used by Y06.

Fig. 1 plots the probability distribution, , obtained under the assumption that the major axis of the central galaxies is perfectly aligned with the major axis of its projected dark matter halo. The open triangles correspond to the results obtained with FOF haloes, counting all satellites that are part of the FOF halo. As one can see, the probability distribution peaks at small , indicating that the satellite galaxies are distributed preferentially along the major axes of their projected dark matter haloes. This is also evident from the fact that , which deviates from the case of no alignment (i.e., ) by almost . This alignment is simply due to the non-spherical nature of dark matter haloes and to the fact that satellite galaxies are a reasonable tracer of the overall mass distribution (e.g., Zentner et al. 2005; Kang et al. 2005b; Libeskind et al. 2005; AB06). The open squares in Fig. 1 show the alignment signal obtained with the VIR haloes, only counting those satellites with Note that the alignment signal for these VIR haloes is somewhat lower than for the FOF haloes. This simply owes to the fact that the VIR haloes are confined to a spherical radius. Give that the observational results of Y06 are also confined to a spherical (group) radius, and that the virial masses are physically better defined than the FOF masses, in what follows we focus on the VIR haloes, unless specifically stated otherwise.
The dashed and solid lines in Fig. 1 show the distributions for the dark matter particles of the FOF and VIR haloes, respectively. Clearly the dark matter particles also reveal an alignment signal, though it is somewhat weaker than that of the satellite galaxies. This suggests that satellite galaxies are not a perfect tracer of the dark matter distribution, but that in fact their distribution is somewhat more flattened than that of the halo itself. This holds for both the FOF and VIR haloes. This is in qualitative agreement with AB06, who also noticed a similar weak enhancement of the alignment strength of satellites with respect to the dark matter. It is also in agreement with the simulation results of Libeskind et al. (2005) and Zentner (2005), who demonstrated that (massive) subhaloes (in Milky-Way type haloes) tend to be more strongly aligned with the major axis of the host halo than the dark matter particles themselves. This owes to the preferred infall along filaments, which tend to be preferentially aligned with the major axis of the halo. In §§ 3.2 and 3.3 we show that this difference between the of satellite galaxies and dark matter particles is a function of halo mass and satellite color, and that it disappears for massive haloes.
Finally, for comparison, the solid dots with errorbars (reflecting ) show the observational results obtained by Y06 from the SDSS group catalogue, using only those groups with an inferred mass . With it is clear that the observed alignment signal is much weaker than what is obtained from our SAM (see also AB06). This indicates that either (i) there are large observational selection effects that reduce the strength of the alignment signal, or (ii) that the orientation of the central galaxies is not perfectly aligned with the major axis of the projected host halo. We will test these two hypotheses in detail in §4.
3.1 Redshift Dependence

In a recent study, Donoso, O’Mill & Lambas (2006) used the Sloan Digital Sky Survey data release 4 (Adelman-McCarthy et al. 2006) to study the alignment of luminous red galaxies at . They found that the major axes of these systems are aligned with their surrounding galaxy distributions, similar as in the local universe. Motivated by these findings, we investigate how the alignment signal evolves with redshift in our SAM. The results are shown in Fig. 2, where the triangles, circles and squares indicate the model predictions for VIR haloes at , and , respectively. The differences between the alignment signals at different redshifts are extremely small, with that are all consistent with each other at the level. Note that these results are obtained by selecting, at each redshift, all galaxies in FOF haloes with and with . In a flux limited survey, however, brighter galaxies, which typically reside in more massive haloes, sample higher redshifts. If the alignment strength depends on halo mass, as in the data analyzed by Y06 (see also §3.3 below), then one has to be careful to properly separate redshift dependence from halo mass dependence.
3.2 Dependence on Galaxy Color
We now examine how the alignment signal depends on various galaxy and halo properties. Fig. 3 shows the dependence of the alignment signal on the colors of the satellite galaxies (upper panels) and the central galaxies (lower panels). The open triangles show the results obtained from our SAM, while the observational results of Y06 are shown as solid dots. Similar to the results shown in Fig. 1, the SAM yields much stronger alignment signals than observed. Again we defer the discussion of this difference and its implications to §4. Here we simply focus on the color dependence. First of all, the SAM predicts that blue satellite are less strongly aligned with the orientation of their central galaxy than red satellites, which is in qualitative agreement with the observations. The solid lines indicate the for the dark matter particles. This shows that blue satellites have a distribution that is virtually identical to that of the dark matter particles, while red satellites reveal an alignment signal that is clearly enhanced with respect to that of the dark matter.
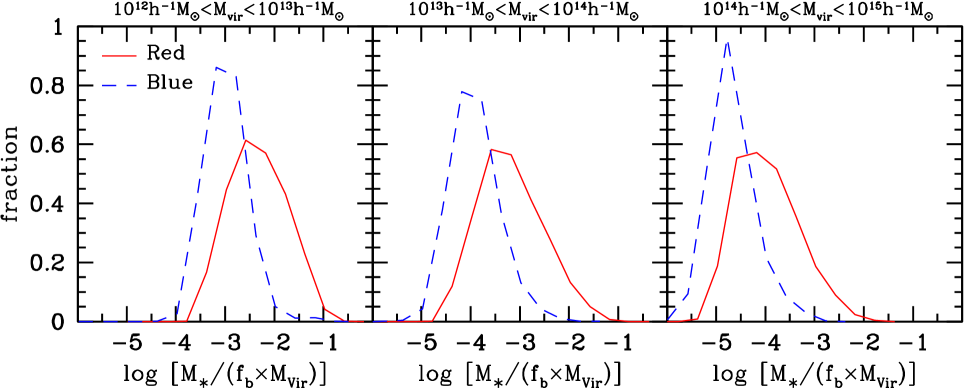
In order to gain insight in the origin of this enhanced alignment signal of red satellites, we have inspected the galaxy distributions in the SAM. This shows that red satellites are more radially concentrated than the blue satellites, in agreement with observations (e.g., Postman & Geller 1984; Girardi et al. 2003; Biviano & Katgert 2004; Thomas & Katgert 2006). In addition, we find that blue satellites are mostly associated with halo galaxies (the satellites that still have a detectable subhalo around them). This owes to the fact that most of them have been accreted only fairly recently. Red satellites, on the other hand, have their star formation largely truncated and have been accreted a long time ago. Consequently, they make up the majority of orphans, whose subhaloes have been disrupted by tidal stripping. The crucial difference between red and blue satellite galaxies, however, which actually explains their different alignment strengths, is their difference in stellar mass. As shown in Fig. 4, red satellites are on average significantly more massive than their blue counterparts. As shown by Libeskind et al. (2005), the stellar mass of a satellite galaxy is strongly correlated with the mass of its subhalo at the time of accretion. Furthermore, Libeskind et al. (2005) and Wang et al. (2005) have clearly demonstrated that subhaloes that were the most massive at the time of accretion were accreted more preferentially along the halo’s major axis. Consequently, their distribution is typically more strongly flattened than that of the other subhaloes or than the overall dark matter distribution. This owes to the fact that the filamentary alignment of the most massive progenitors is largely preserved in the final halo, and nicely explains why the red (more massive) satellite galaxies in our SAM reveal a stronger alignment signal than either the dark matter or the blue satellites.
The lower panels of Fig. 3 show that the SAM predicts that the satellite alignment around blue centrals is comparable to that around red centrals. This differs from what it seen for the dark matter (solid lines) and the results of Y06 (solid dots), both of which show a significantly stronger alignment of satellites around red centrals. As we show in the next section, the fact that for the dark matter particles is smaller around blue centrals mainly owes to the fact that blue centrals mainly reside in less massive haloes, which are more spherical. The discrepancy between the alignment signals in the SAM and those obtained by Y06 will be discussed in detail in §4.
3.3 Dependence on Halo Mass
Next we examine how the alignment scales with halo mass. In Fig. 5, we plot for central-satellite pairs in different halo mass bins. Before looking into the alignment signals of the satellite galaxies, let us first focus on the solid lines, which reflect of the dark matter particles. Note how decreases with increasing halo mass. This reflects the well-known fact that more massive haloes are more strongly flattened (e.g., Warren et al. 1992; Bullock 2002; Jing & Suto 2002; Bailin & Steinmetz 2005; Kasun & Evrard 2005; Allgood et al. 2006).
For haloes with the total satellite population has a that is almost identical to that of the dark matter particles, indicating that in massive haloes satellite galaxies are a fair tracer of the overall dark matter distribution (at least in the SAM studied here). In low mass haloes, however, the satellite galaxies reveal an alignment signal that is significantly stronger than that of the dark matter particles. Thus, the differences between of dark matter particles and satellite galaxies shown in Fig. 1 mainly owes to haloes with . Note that overall, the alignment signal of the satellite galaxies is almost independent of halo mass: the fact that more massive haloes are more strongly flattened, is roughly counter-balanced by the fact that in low mass haloes, the satellite galaxies are more strongly flattened than the dark matter.
3.4 Dependence on Luminosity
Finally, we examine how the alignment strength depends on the luminosities of the galaxies (respectively for centrals and satellites). So far we always considered all galaxies in the SAM with . Fig. 6 shows how changes if we change this magnitude limit for satellites and centrals respectively. It is found that luminous satellites have stronger alignment signal than faint satellites, but the signals are identical for central galaxies regardless of the luminosity. Since there is virtually no halo mass dependence, it is obvious that why there is no dependence on the luminosity of the central galaxy. Rather, the luminosity dependence of for satellites owes to the fact that more massive (and hence brighter) satellites reveal a stronger alignment signal; the same effect that is responsible for boosting the alignment of red satellites with respect to that of blue satellites (cf. §3.2). As we will see below, this has important implications for the alignment signal inferred from a flux-limited sample of galaxies.
4 The Alignment in Galaxy Groups
As illustrated in Figs. 1 and 3, the alignment signals found observationally by Y06 are much weaker than those obtained from our SAM. This, however, should not come entirely as a surprise. First of all, Yang et al. studied the alignment in galaxy groups, not in dark matter haloes. Although the group finding algorithm used is optimized to group together those galaxies that reside in the same dark matter halo, the groups suffer from both interlopers (group members that do not actually belong to the same halo), and incompleteness (halo members that are missed by the group finder). In addition, the group catalogue is constructed from the SDSS, which is a flux-limited survey that suffers from incompleteness itself (i.e., fiber-collisions). As we show below, these observational ‘selection’ effects cause a blurring of the true alignment signal. Furthermore, so far we have oriented the central galaxies along the major axis of the projected dark matter distribution, which maximizes the alignment signal. However, since we believe haloes to be triaxial, the projected major axis depends on the viewing angles, making such an identification unphysical.
In this section, we study the impact of the observational selection effects, and we consider a few more realistic models for how the central galaxy is oriented in its dark matter halo.
4.1 Constructing mock catalogs
In order to examine the survey selection effects, we start by constructing a mock SDSS DR2 galaxy sample. A detailed description of how the mock galaxy catalogue is constructed can be found in Li et al. (2006). Here we only give a brief description. Since the SDSS DR2 survey extends to redshifts , we need to cover a volume that extends to a radial distance of about . To that extent we create a periodic replica of our simulation box. Next we define an ecliptic ()-coordinate frame with respect to a virtual observer located in the central box, and we remove all galaxies outside the SDSS DR2 survey regions. For each galaxy in the survey region, we calculate the redshift using its comoving distance and peculiar velocity along the line of sight. We then calculate the -band apparent magnitude and select galaxies according to the position-dependent magnitude limit in the SDSS DR2. We also mimic the position-dependent completeness using the completeness masks provided as part of the SDSS DR2. Finally, we select those galaxies with
Note that in the spirit of constructing the mock survey above, for each mock galaxy, we know exactly the identity of its halo from our simulation described in detail in Section 2.1, and we also know whether it is a central or satellite of that halo. Now we use the resulting mock survey to study the central-satellite alignments using two different methods. In the first method, we make use of the fact that for each galaxy in the mock survey, we know its host halo, and we know whether the galaxy is a central galaxy, a halo galaxy, or an orphan galaxy from our N-body simulation. It is then easy to allocate galaxies into different haloes. In case a halo without central galaxy selected by the SDSS selection effect, we omit all the galaxies in the halo. Overall the fraction of such haloes is very small. For each halo with a central galaxy we project the dark matter halo particles (taken from N-body simulation) onto the ‘sky’ and we use the method mentioned in §2.2 to determine its major axis (once again in projection). As before, we assume that the central galaxy is aligned along this major axis, and we determine and using all satellite galaxies in the mock survey that are located within the same VIR halo as the central galaxy. The halo mass and radius () of the central galaxy is also taken directly from the simulation. In what follows we refer to the results obtained in this way as the Mock Halo results. A comparison of these results with those discussed in §3 above reveals the impact of a flux-limit, of peculiar velocities, and of the incompleteness of the SDSS on the alignment signal.
In the second method we aim for a more meaningful comparison with the results of Y06 by applying their halo-based group finder to our mock survey to construct a mock galaxy group catalog. Following Yang et al. (2005a), we compute a measure for the total group luminosities by summing the luminosities of its member galaxies, and by correcting for missing members using a calibration based on relatively nearby groups. We then obtain group masses by matching the group luminosity function to the (theoretical) halo mass function assuming a monotonic relation between group luminosity and halo mass (see Yang et al. 2005a,b and Weinmann et al. 2006 for details and for tests demonstrating the reliability of the assigned group masses). Note here we do not use the identify of the galaxy (central or satellite) in the N-body simulation. Following Y06, we define the brightest group member as the ‘central’ galaxy, and all other group members as ‘satellites’. We thus obtain a sample of central galaxies and central-satellite pairs, comparable to Y06 ( centrals and central-satellite pairs). We align the major axis of each ‘central’ group galaxy with the major axis of its projected dark matter halo (VIR), and we then determine and using all other group members as satellites. We refer to the results obtained in this way as the Mock Group results. Note that this is exactly the same method as used by Y06. A comparison with the results presented in §3 and with the Mock Halo results thus allows us to study the impact of interlopers (group members that are not located in the same VIR halo as the central group galaxy), incompleteness, and errors in the assigned group mass.
4.2 The Impact of Selection Effects


The solid and dashed lines in Fig. 7 show the results obtained from the Mock Haloes and Mock Groups, respectively. In both cases we only use haloes (or groups) with . For comparison, we also show the results obtained in §3 for the VIR haloes (open squares, cf. Fig 1) and the observational results of Y06 (solid dots with errorbars). The alignment signal for the Mock Haloes is actually stronger than what we obtained using the simulation box directly. This is due to the fact that the mock catalogues are apparent magnitude limited. Consequently, brighter galaxies contribute a relatively larger fraction to the total alignment signal. As we have shown in §3.4, brighter (more massive) satellite galaxies reveal a stronger alignment signal than their fainter (less massive) counterparts (cf. Fig. 6).
Note also that the alignment signal from the Mock Groups is significantly weaker than for the Mock Haloes. This mainly owes to fact that percent of the satellite galaxies in the group catalogue are interlopers. Since interlopers are not associated with the halo of the central, they tend to dilute the alignment signal. Since our mock group catalogue and the group catalogue constructed by Y06 should be impacted by interlopers in roughly the same fashion, the data-model comparison is still valid. Therefore, the fact that the alignment signal in the Mock Group catalogue, which mimics all observational selection effects, is still much stronger than that obtained by Y06, implies that central galaxies are not perfectly aligned with the orientation of their projected dark matter halo. In the following section we use more realistic assumptions regarding the alignment between central galaxies and their dark matter haloes.
4.3 Different Alignment Models

In what follows we assume that the central galaxy is a pure oblate spheroid (of which a thin disk is the extreme case, as used by AB06). In addition, we assume that its minor axis is either (i) perfectly aligned with the minor axis of its dark matter halo (hereafter Minor Axis model), or (ii) perfectly aligned with the angular momentum vector of its dark matter halo (hereafter Spin Axis model).In both case we use the VIR haloes, and we determine the halo’s 3D inertia tensor and angular momentum vector as described in §2.2. Following AB06, we project oblate into the sky and obtain the major axis of the image. the As long as the halo itself is a spheroid (oblate or prolate), the Minor Axis model is identical to the case discussed above, in which the major axis of the central galaxy is perfectly aligned with that of its projected dark matter halo. If, however, the halo is triaxial, this is no longer true in general. The Spin Axis model is motivated by the standard model for disk formation, in which the disk forms out of a cooling flow that conserves its specific angular momentum (e.g., Fall & Efstathiou 1980; Mo, Mao & White 1998; van den Bosch 2001; Dutton et al. 2007). If the baryons and dark matter start out with the same specific angular momentum, which is a standard assumption in these models (but see van den Bosch et al. 2002; Chen, Jing & Yoshikaw 2003; Sharma & Steinmetz 2005), then the angular momentum vectors of the disk and halo should be aligned.
Fig. 8 shows obtained from the Mock Group catalogue, for both the Minor Axis (solid line) and Spin Axis (dashed line) models. First of all, note that the Minor Axis model yields an alignment strength that is much lower than that for the Mock Groups in Fig. 7. This shows that overall dark matter haloes are triaxial. However, the alignment signal is still significantly larger than observed (solid dots with errorbars), indicating that the Minor Axis model can not represent reality. The Spin Axis model, on the other hand, can accurately reproduce the satellite alignment signal obtained by Y06. Therefore, the data is consistent with a model in which the central galaxy is oblate and perfectly aligned with the spin axis of its dark matter halo.
The fact that the Spin Axis model yields a weaker satellite alignment signal than the Minor Axis model implies that, in general, the spin axis and minor axis of dark matter haloes are not perfectly aligned. This is consistent with numerical simulations, which show that although the angular momentum axis of a dark matter halo tends to be preferentially aligned with the minor axis, the alignment is far from perfect. For the VIR haloes in our simulation, we find an average angle (in 3D) between the minor axis and angular momentum axis of , in good agreement with Bailin & Steinmetz (2005) and Bett et al. (2006).
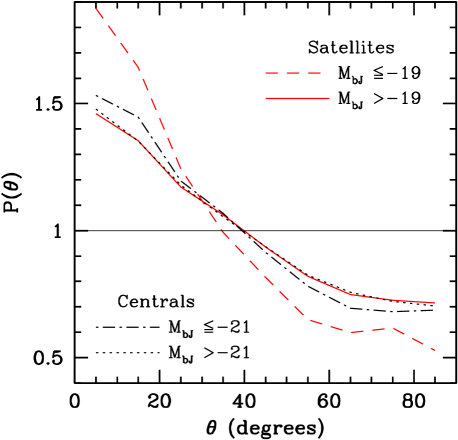
To test the Minor Axis and Spin Axis models in more detail, Fig. 9 shows obtained from the Mock Group catalogue for blue and red satellites (upper panels) and for blue and red centrals (lower panels). The Minor Axis model only provides a good fit to the Y06 data for the blue satellites. In all other cases it significantly overpredicts the observed alignment signal. The Spin Axis model, on the other hand, matches the Y06 results remarkably well in all cases, providing strong support for a picture in which the orientation of central galaxies is governed by the angular momentum vector of their dark matter halo.
In order to study the impact of interlopers, the dot-dashed lines show the results for the Spin Axis model in which we have manually removed the interlopers from the group catalogue. The differences with the solid lines therefore highlight the impact of interlopers. Overall the differences are small; only the alignment signal of the blue centrals seems to have been significantly diluted by interlopers. This owes to the fact that blue centrals have a larger interloper fraction ( percent) than red centrals ( percent). This in turn owes to the fact that group masses are estimated from the group luminosities. At the low mass end, where the group luminosity is dominated by the luminosity of the central galaxy, blue galaxies typically get an assigned mass which is somewhat too high (see More et al. 2006, in preparation). Consequently, the assigned virial radius is somewhat too large, which results in a larger fraction of interlopers. Since the for blue centrals and red centrals are similar when the interlopers are removed (cf. Fig. 3), we conclude that the finding by Y06, that blue centrals are more strongly aligned with their satellites than red centrals, is most likely an artefact of the method used to assign masses to the groups.
The difference between the alignment signal of blue and red satellites, on the other hand, seems to be a genuine effect, not significantly distorted by interlopers. Indeed, as shown in §3.2, this difference is also evident when analyzing the simulation box directly, and is due to the fact that red satellites are associated with subhaloes that were more massive at the time of accretion. We therefore conclude that the enhanced alignment signal for red satellites has a natural explanation within the framework of hierarchical structure formation.
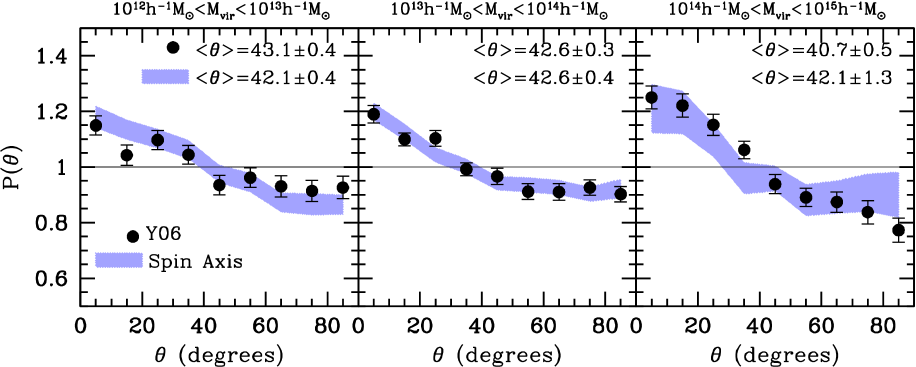
Finally, Fig. 10 compares the alignment signal obtained from ourMock Group catalogue with the Spin Axis model to the data of Y06 for three different bins in group mass. The width of the shaded band reflects , and is shown to highlight the random scatter in our Mock Group catalogue. Consistent with what we found in §3.3, the alignment signal from our Mock Group catalogue reveals no significant mass dependence. Although the Y06 data seems to hint towards a decrease of with increasing group mass, the overall agreement with our model predictions is very satisfactory, providing further support for a picture in which the central galaxy is aligned with the spin axis of its dark matter halo.
5 Conclusions
We have used a high-resolution -body simulation combined with a semi-analytical model for galaxy formation to study the alignment between the orientation of central galaxies and the distribution of their satellite galaxies. Since dark matter haloes, in general, are flattened, and satellite galaxies are a reasonably fair tracer of the dark matter mass distribution, satellite galaxies will reveal an alignment signal as long as the orientation of the central galaxy is correlated with that of its dark matter halo. In particular, the major axis alignment detected by several recent studies (Brainerd 2005; Yang et al. 2006; Azzaro et al. 2006) requires that the major axis of a central galaxy is somehow aligned with the major axis of its dark matter halo. Using our simulation we have constructed a mock SDSS, to which we applied the same halo-based group finder as used by Y06. Using exactly the same analysis as Y06, we find that a perfect alignment of the minor axes of central galaxy and dark matter halo yields a central-satellite alignment signal that is significantly stronger than observed. However, if we assume that the minor axis of the central galaxy is perfectly aligned with the spin axis of its dark matter halo, which has an average misalignment with the halo minor axis of , we can accurately reproduce the results of Y06.
AB06 have also obtained similar conclusions as presented here. First they also found that if the major axis of the central galaxy aligns well with the major axis of the projected dark matter halo, the signal from the model is stronger than observed. On the contrary, if the spin axis of the central galaxy aligns with the net angular momentum of the dark matter halo, the signal is decreased. AB06 claimed that the signal is decreased too much, and is lower than observation of Brainerd (2005). Here we find that our Spin Axis model match well with the observations of Y06. It is deserved to clarify the disagreement. First, AB06 compared their model results with the observation results of Brainerd 2005, who measured the average alignment angle as , but Y06 obtained . The difference in the two observational results owes to the fact that AB06 and Y06 measured the alignment signal in different halo mass. AB06 measured the signal mostly from isolated host galaxies, but Y06 measured the signal from groups and clusters. Second, in fact our result from Spin Axis model is almost identical to that of AB06, here we get average alignment angle of , and from AB06. Third, there is no statistical errorbars from AB06, then it is hard to conclude whether there is a significant disagreement between their results and the observational results of Brainerd (2005).
The analysis of SDSS groups by Y06 revealed a stronger alignment signal for red satellites than for blue satellites (see also Sales & Lambas 2004 and Azzaro et al. 2006). This is remarkably well reproduced by our SAM, and is related to the fact that red satellites have larger stellar masses (when normalized by the mass of the host halo) than their blue counterparts, and are associated with subhaloes that were more massive at the time of accretion. As shown by Wang et al. (2005) and Libeskind et al. (2005), the distribution of those subhaloes is more strongly flattened than that of less massive subhaloes or that of the dark matter particles. This owes to the fact that the filamentary alignment of the most massive progenitors is largely preserved in the final halo. When assuming that the minor axes of central galaxies is perfectly aligned with their halo spin axes, our SAM accurately matches the data of Y06, and we therefore conclude that the enhanced alignment signal of red satellites has a natural explanation in the framework of hierarchical structure formation.
The analysis of Y06 also revealed a stronger alignment signal for red centrals than for blue centrals. Although our Spin Axis model can accurately reproduce this trend when using the mock group catalogue, we find no enhanced alignment signal for red centrals when analyzing the dark matter haloes in the simulation box directly. Detailed tests show that blue centrals have a larger interloper fraction, which causes an enhanced dilution of the alignment signal. We therefore conclude that the difference in the alignment signal of red and blue centrals detected by Y06 is most likely an artefact caused by interlopers in the group catalogue used.
Finally, the alignment signal in the semi-analytical model is found to only depend very weakly on halo mass, in good agreement with the data of Y06. This lack of a clear mass dependence is somewhat surprising, since it is well known that more massive haloes are more strongly flattened. Consequently, one would expect a stronger central-satellite alignment in more massive haloes. However, satellites in low mass haloes are relatively more massive (with respect to their host halo). Since the alignment signal of more massive satellites is stronger, this counter-balances the mass-dependence of the halo shapes: Massive haloes are strongly flattened, and their satellites accurately trace the mass. Low mass haloes, however, are less strongly flattened, but their satellite distribution is more strongly flattened than the dark matter.
Our main conclusion is that the observed alignment between the orientation of central galaxies and the distribution of their satellite galaxies is in good agreement with the standard hierarchical structure formation model, as long as the minor axes of central galaxies are misaligned with the minor axes of their dark matter haloes by on average . Interestingly, this is exactly the typical misalignment angle between a halo’s minor axis and its angular momentum vector, which is suggestive of a picture in which the orientation of central galaxies is governed by the spin axes of their dark matter haloes.
At first sight, it may seem weird that the orientation of (red) elliptical galaxies would be governed by the spin axes of their dark matter haloes. However, except for the most massive ellipticals, more early-type galaxies are oblate rotators, which implies that their flattening owes to their angular momentum (e.g., Davies et al. 1983). If ellipticals form in major mergers, which is the standard paradigm, this angular momentum originates from the orbital angular momentum of the merging progenitors. Interestingly, several studies have shown that the angular momentum of a dark matter halo also originates from the orbital angular momenta of its (most massive) progenitors (e.g., Vitvitska et al. 2002; Maller, Dekel & Somerville 2002). Therefore, we argue that an alignment between the minor axes of ellipticals and the spin axes of their dark matter haloes may well have a natural origin in hierarchical models of structure formation. This can be tested straightforwardly with high-resolution numerical simulations.
For (blue) disk galaxies, a tight alignment between the spin axes of halo and disk seems a natural outcome if (i) the spin axes of dark matter and baryons are initially aligned and (ii) cooling preserves specific angular momentum. However, hydrodynamic simulations suggest that the angular momentum vectors of the baryons and dark matter are not perfectly aligned (van den Bosch et al. 2002; Chen et al. 2003; Sharma & Steinmetz 2005). Furthermore, detailed simulations of disk formation show that the actual formation of the disk strongly modifies the shape of the inner dark matter halo (), reorienting it so that the minor axis of the inner halo is well aligned with the disk axis (Kazantzidis et al. 2004; Bailin et al. 2005; see also Binney, Jiang & Dutta 1998). Such a reorientation of the inner halo may have an impact on the central-satellite alignment, which has not been accounted for in our model. It remains to be seen to what extent a self-consistent treatment of the formation of (central) galaxies, that accounts for the back reaction of cooling on the shape and orientation of the halo, impacts on the alignment signal studied here. In particular, since the radial distribution of red satellites is more centrally concentrated than that of blue satellites, the impact of this effect may well be different for red and blue satellites.
As a final remark, we caution that, although our data suggests that the orientation of central galaxies is governed by the spin axes of their dark matter haloes, and there are theoretical arguments to support such a picture, any alternative model in which the minor axes of central galaxy and dark matter halo have an average misalignment of , will match the data equally well. In that respect, the origin of the alignment between centrals and satellites requires further study.
Acknowledgements
We thank the anonymous referee for useful comments. XK acknowledges support from the Royal Society China Fellowship scheme. XY is supported by the One Hundred Talents project of the Chinese Academy of Sciences and grants from NSFC (Nos.10533030, 10673023). YPJ is supported by the grants from NSFC (Nos.10125314, 10373012, 10533030) and from Shanghai Key Projects in Basic research (No. 04JC14079 and 05XD14019). HJM and SM thank the Chinese Academy of Sciences and Chinese Natural Science Foundation for travel support.
References
- [] Adelman-McCarthy, J.K., et al. 2006, ApJS, 162, 38
- [] Agustsson I., Brainerd T. G., 2006, ApJ, 650, 550 (AB06)
- [] Allgood B., Flores, R.A., Primack J.R., Kravtsov A.V., Wechsler R.H., Faltenbacher A., Bullock J.S., 2006, MNRAS, 367, 1781
- [] Azzaro M., Patiri S.G., Prada F., Zentner A.R., 2006, preprint (astro-ph/0607139)
- [] Bailin J., Steinmetz M., 2005, ApJ, 627, 647
- [] Bailin J., et al., 2005, ApJ, 627, L17
- [] Benson A., Frenk C.S., Lacey C.G., Baugh C.M., Cole S., 2002, MNRAS, 333, 177
- [] Benson A., 2005, MNRAS, 358, 551
- [] Bett P., Eke V., Frenk C.S., Jenkins A., Helly J., Navarro J., 2006, preprint (astro-ph/0608607)
- [] Binney J., Jiang I.G., Dutta S., 1998, MNRAS, 297, 1237
- [] Biviano A., Katgert P., 2004, A&A, 424, 779
- [] Brainerd T.G., Specian M.A., 2003, ApJ, 593, 7
- [] Brainerd T.G., 2005, ApJ, 628, L101
- [] Bryan G., Norman M., 1998, ApJ, 495, 80
- [] Bullock J.S., Kravtsov A.V., Weinberg D.H., 2000, ApJ, 539, 517
- [] Bullock J.S., 2002, in The Shapes of Galaxies and Their Dark Matter Halos, Ed. P. Natarajan (World Scientific: Singapore), p.109
- [] Chen D.N., Jing Y.P., Yoshikaw K., 2003, ApJ, 597, 35
- [] Conroy C., et al., 2007, ApJ, 654, 153
- [] Davies R.L., Efstathiou G.P., Fall S.M., Illingworth G.D., Schechter P.L., 1983, ApJ, 266, 41
- [] Donoso E., O’Mill A., Lambas D.G., 2006, MNRAS, 369, 479
- [] Dutton A.A., van den Bosch F.C., Dekel A., Courteau S., 2007, ApJ, 654, 27
- [] Fall S.M., Efstathiou G., 1980, MNRAS, 193, 189
- [] Girardi M., Rigoni E., Mardirossian F., Mezzetti M., 2003, A&A, 406, 403G
- [] Hawley D.L., Peebles P.J.E., 1975, AJ, 80, 477
- [] Holmberg E., 1969, Ark. Astron., 5, 305
- [] Jing Y.P., Suto Y., 2002, ApJ, 574, 538
- [Kang et al. 2005] Kang X., Jing Y.P., Mo H.J., Börner G., 2005a, ApJ, 631, 21
- [KMGJ05] Kang X., Mao S., Gao L., Jing Y. P., 2005b, A&A, 437, 383
- [Kang et al. 2006] Kang X., Jing Y.P., Silk J., 2006, ApJ, 648 820
- [] Kasun S.F., Evrard A.E., 2005, ApJ, 629, 781
- [] Kazantzidis S., Kravtsov A.V., Zentner A.R., Allgood B., Nagai D., Moore B., 2004, ApJ, 611, L73
- [] Knebe A., Gill S.P.D., Gibson B.K., Lewis G.F., Ibata R.A., Dopita M.A. 2004, ApJ, 603, 7
- [] Li C., Kauffmann G., Wang L., White S.D.M., Heckman T.M., Jing Y.P., 2006, MNRAS, 373, 457
- [] Libeskind N.I., Frenk C.S., Cole S., Helly J.C., Jenkins A., Navarro J.F., Power C., 2005, MNRAS, 363, 146
- [] Maller A.H., Dekel A., Somerville R., 2002, MNRAS, 329, 423
- [] McKay T.A., et al., 2002, ApJ, 571, 84
- [] Mo H.J., Mao S., White S.D.M., 1998, MNRAS, 295, 319
- [] Postman M. Geller M.J., 1984, ApJ, 281, 95
- [] Prada F., et al., 2003, ApJ, 598, 260
- [] Quinn T., Katz N., Efstathiou G., 1996, MNRAS, 278, L49
- [] Sales L., Lambas D.G., 2004, MNRAS, 348, 1236 (SL04)
- [] Sharma S., Steinmetz M., 2005, ApJ, 628, 21
- [] Sharp N.A., Lin D.N.C., White S.D.M., 1979, MNRAS, 187, 287
- [] Springel V., White S.D.M., Tormen G., Kauffmann G., 2001, MNRAS, 328, 726
- [] Thomas T., Katgert P., 2006, A&A, 446, 31
- [] van den Bosch F.C., 2001, MNRAS, 327, 1334
- [] van den Bosch F.C., Abel T., Croft R.A.C., Hernquist L., White S.D.M., 2002, ApJ, 576, 21
- [] van den Bosch F.C., Norberg P., Mo H.J., Yang X., 2004, MNRAS, 352, 1302
- [] Vitvitska M., Klypin A.A., Kravtsov A.V., Wechsler R.H., Primack J.R., Bullock J.S., 2002, ApJ, 581, 799
- [] Wang H.Y., Jing Y.P., Mao S., Kang, X., 2005, MNRAS, 364, 424
- [] Warren M.S., Quinn P.J., Salmon J.K., Zurek, W.H., 1992, ApJ, 399, 405
- [] Weinmann S.M., van den Bosch F.C., Yang X., Mo H.J., 2006, MNRAS, 366, 2
- [] White M., 2002, ApJS, 143, 241
- [] White S.D.M., Rees M.J., 1978, MNRAS, 183, 341
- [] Yang X., Mo H.J., van den Bosch F.C., Jing Y.P., 2005a, MNRAS, 356, 1293
- [] Yang X., Mo H.J., Jing Y.P., van den Bosch F.C., 2005b, MNRAS, 358, 217
- [] Yang X., van den Bosch F.C., Mo H.J., Mao S., Kang X., Weinmann S.M., Guo Y., Jing Y.P., 2006, MNRAS, 369, 1293 (Y06)
- [] Zaritsky D., Smith R., Frenk C.S., White S.D.M., 1997, ApJ, 478, 53
- [] Zentner A.R., Kravtsov A.V., Gnedin O.Y., Klypin A.A., 2005, ApJ, 629, 219
- [] Zentner A.R., 2005, in Mass Profiles and Shapes of Cosmological Structures, eds. G. Mamon, F. Combes, C. Deffayet, B. Fort, EAS Publications Series, in press (astro-ph/0510376)