Can large-scale structure probe CMB-constrained non-Gaussianity?
Abstract
The first year Wilkinson Microwave Anisotropy Probe (WMAP) set quantitative constraints on the amplitude of any primordial non-Gaussianity. We run a series of dark matter-only N-body simulations with the WMAP constraints to investigate the effect of the presence of primordial non-Gaussianity on large scale structures. The model parameters can be constrained using the observations of protoclusters associated with Ly- emitters at high redshift (), assuming the galaxy velocity bias can be modelled properly. High redshift structure formation potentially provides a more powerful test of possible primordial non-Gaussianity than does the CMB, albeit on smaller scales. Another constraint is given by the local galaxy density probability distribution function (PDF), as mapped by the 2 degree Field Galaxy Redshift Survey (2dFGRS). The PDF of 2dFGRS L galaxies is substantially higher than the standard model predictions and requires either a non-negligible bias between galaxy and dark matter on h-1 Mpc scales or a stronger non-Gaussianity than allowed by the WMAP year one data. The latter interpretation is preferred since second-order bias corrections are negative. With a lower normalisation of the power spectrum fluctuations, , as favoured by the WMAP 3 year data, the discrepancy between the Gaussian model and the data is even larger.
keywords:
cosmology: theory – large-scale structure of the Universe – galaxies: clusters: general1 Introduction
The best limits on possible initial non-Gaussianities in the primordial density fluctuation distribution have hitherto been imposed by the CMB (Komatsu & Spergel 2001). There are many models which can generate such non-Gaussianities, including multiple field inflation or more speculative models such as those assuming non-homogeneous reheating processes or those seeded with topological defects. Moreover such non-Gaussianities may be scale-dependent, and it is therefore important to complement CMB searches with smaller scale probes, on cluster and galaxy scales.
Our approach here is phenomenological, following that of Mathis, Diego & Silk (2004), and focuses on the large-scale galaxy distribution. Tracers of primordial non-Gaussianities include possible large-scale power excesses in the nearby galaxy distribution as mapped by 2dFGRS and SDSS redshift surveys, the early formation of protoclusters up to as traced by radio galaxies surrounded by Ly- emitters and Lyman-break galaxies, and the possible excess of angular power in CMB temperature fluctuations seen by CBI and ACBAR on cluster scales (which is most likely due to the thermal SZ effect). With the claimed reduction in normalisation of the fluctuation power spectrum to (Spergel et al. 2006), such questions take on renewed urgency.
Our approach here is to study the implications via dark matter N-body simulations of a simple non-Gaussian model, which modifies the frequency of rare peaks in the primordial density field that defines the locations where massive clusters (or superstructures) are formed. If the probability distribution function of the density field shows an excess (or deficit) of high peaks compared to the Gaussian case, protoclusters of given mass form earlier (or later), and systems above a given mass will be more (or less) abundant at fixed redshift. Sadeh, Rephaeli & Silk (2006) presented analytical models, whereas here we simulate and evolve a suite of N-body simulations of 300 h-1 Mpc on the side.
2 The case for non-Gaussianity
We consider a simple non-Gaussian model, where the amplitude of non-Gaussianity in the primordial fluctuations is parametrised by a non-linear coupling parameter, (Komatsu et al. 2003). We refer to this non-Gaussian model as the model. The Bardeen curvature perturbations at any given position can be written as
| (1) |
where are Gaussian linear perturbations with zero mean. This parameterisation is useful for setting quantitative constraints on the amount of non-Gaussianity allowed by the CMB data. Komatsu et al. (2003) used first year WMAP data (WMAP-1) to establish limits on and obtained at 95% confidence.
We produce the initial conditions for the simulations using the conventional grid method, but when calculating the displacement using the Zel’dovich approximation, we use the perturbed newtonian potential, which is times the curvature perturbation given by Equation 1. We then run a series of dark matter N-body simulations using the publicly available code GADGET (Springel, Yoshida & White 2001). We consider three values for (-58,0,134) consistent with WMAP1 constraints, where corresponds to the standard Gaussian model. For these simulations, we impose the initial power spectrum to be given by an adiabatic CDM transfer function with spectral slope . We use the ‘old‘ concordance cosmological model, i.e. , and . Recent results from WMAP-3 prefer a lower value for (Spergel et al. 2006). We therefore run another series of simulations using the WMAP-3 cosmological parameters (ie. , , ), both for and . All N-body simulations are started at redshift and we follow particles in a cube of 300 h-1 Mpc aside, implying a particle mass of , which, for the present study, gives high enough resolution as shown in Section 3. For each of the above models, we present the mean results from ten statistically equivalent realizations. Hereinafter, we conservatively discuss the results for the cosmological model with unless otherwise stated.
3 Results
3.1 Halo mass function in non-Gaussian models
As with any simulation run, it is essential to check if our analysis is affected by the chosen mass resolution. In Fig. 1, we show a comparison between our simulations and results from either other high-resolution N-body simulations or analytical models. The upper panel compares the halo mass function of our Gaussian simulations with the fitting formula of Jenkins et al. (2001), which is based on a series of high-resolution N-body simulations with similar cosmology. Our estimate of the halo mass function is in good enough agreement with the Jenkins et al. (2001) fit. In the lower panel, we show the probability distribution function (PDF) of the density contrast smoothed with a spherical top-hat filter of radius 12 h-1 Mpc. Kayo et al. (2001) have shown that the PDF can be well described by a lognormal distribution. Here we show the mean PDF from our 10 Gaussian simulations as the solid line, and the errors correspond to the estimated variance. The dashed line shows the analytic relation given by Kayo et al. (2001), which is shown to be accurate at . It can be seen that our simulation matches well the analytic prediction. The main point of the plot is to show that our mass resolution is good enough to properly resolve the over-dense tail of the probability distribution function, for a typical smoothing scale used later on in our analysis.

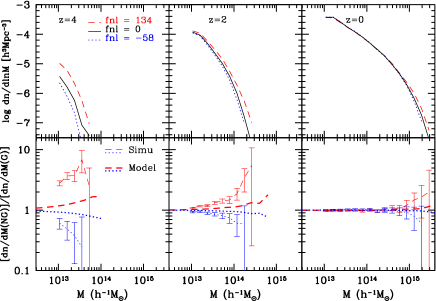
Our main motivation is to see whether the type of non-Gaussian models considered here, ie. fNL models, can produce more massive structures than does the standard Gaussian model. In Fig. 2 we present the evolution of the dark matter halo mass function as a function of redshift. The upper panel shows the results with WMAP-1 constrained fNL model parameters. A distinctive feature is that a positive fNL, which gives a more strongly disturbed gravitational field, results in the formation of increased numbers of virialized structures. This effect is also much stronger at higher redshifts, as expected from the theoretical models of Matarrese et al. (2000). In the lower panel of Fig. 2, we show the ratio of halo mass functions of non-Gaussian, , and Gaussian models, , by the thick lines with error bars from our ten statistically equivalent realizations. Even though the simulation predicts the ratio of halo mass function to increase with halo mass and with increasing redshift, there is still a large discrepancy with the analytical model expectations of Matarrese et al. (2001). Our simulations produce a much larger number density of dark matter halos for non-Gaussian models than expected by Press-Schechter-based model predictions. The main difference between the Press-Schechter halo mass functions and the N-body mass functions can be attributed to a different treatment of the dynamics of halo formation (cf. Komatsu et al. 2003). It is valid to ask whether primordial non-Gaussianity also changes the dynamics of halo formation. This issue is unfortunately beyond our current study, as following the dynamics of halo formation requires much higher-resolution simulations than the ones we have run, together with more regularly spaced simulation outputs. We therefore delay this aspect of non-Gaussianity to future work.
3.2 Protoclusters at z 2-4
As previously shown, there are significant differences between the Gaussian model and the models at high redshift, in particular for large positive values, which results in more structure being formed. Miley et al. (2004) have reported a protocluster at around a Ly- emitter galaxy. They found 21 spectroscopically confirmed galaxies around the Ly- emitter galaxy, and the 1-dimensional velocity dispersion among these galaxies is about 325 s-1 km. Kurk et al. (2004) also observed a protocluster at with a velocity dispersion of s-1 km over 3 to 5 Mpc, corresponding to co-moving sphere radii of 5 to 9 h-1 Mpc. Following Robinson & Baker (2000) and Mathis, Diego & Silk (2004), we sample such structures in our simulations by throwing down a large number of spheres with radii of 7 h-1 Mpc and calculate their 1-D dark matter velocity dispersion.
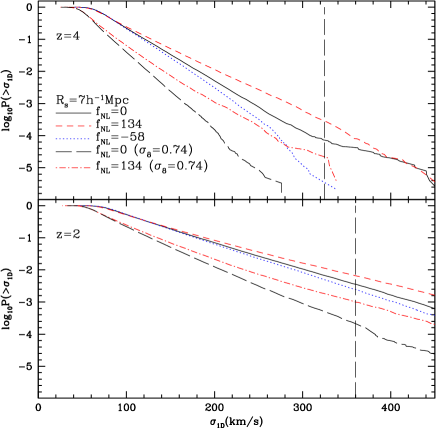
In Fig. 3 we show the cumulative probability distribution function of the measured 1-D dark matter velocity dispersion. In the top panel, we compare our findings with the measurement of Miley et al. (2004) at . In the bottom panel, we plot the equivalent curves at and compare with the velocity dispersion measurement of Kurk et al. (2004). Contrary to Mathis et al. (2004), we find that our Gaussian simulation with can explain the existence of structures with velocity dispersions larger than 320 s-1 km, such as the protocluster of Miley et al. (2004). Although the simulation of Mathis et al. (2004) used the same cosmological parameters as our simulation, they adopt too small a simulation volume (box of 100 h-1 Mpc aside), with the consequence that the cut-off in the input power spectrum on large scales depresses the velocity dispersion in their simulation.
Fig. 3 shows that for all simulations with , it is possible to observe a protocluster with 1-D velocity dispersion of about 320 s-1 km. On the other hand in a low universe (like one with , as favoured by WMAP-3), the chance of observing such protoclusters is very unlikely, unless there is a strongly disturbed primordial non-Gaussian field (such as one with ). We note that these are not in any case very strong constraints, as we have ignored any velocity bias between the galaxies and the dark matter, which to some extent could solve the apparent discrepancy. Therefore we have not attempted to quantify the predicted number density of such objects at . Only detection of a large number of protoclusters of similar size or bigger at could actually put real constraints on this simple model, together with some theoretical constraints on the strength of velocity bias, as would be measurable in higher resolution N-body simulations. The lower panel of Fig. 3 shows that, at , it is rather easy to find, in all of the simulations considered, regions with velocity dispersion larger than 400 s-1 km. This highlights the fact that only very high redshift protoclusters are likely to set constraints on the cosmological parameters using the 1-D velocity dispersion.
3.3 Large scale structures in the 2dFGRS
A clear limitation of the preceding results is the sparseness and quality of the data that we are comparing to. Hence we consider in this section constraints from local large-scale structure results. We estimate the galaxy probability distribution function (PDF) using a 2dFGRS L volume-limited sample (Norberg et al. 2002; Baugh et al. 2004), comparable in volume to a simulation cube of 200 h-1 Mpc on the side. The PDF is measured by Fast-Fourier-Transform (FFT) smoothing of the galaxy distribution with a spherical top-hat filter of radius For the smoothing scales considered (4 to 16 h-1 Mpc), we recover the results of Croton et al. (2004), who used a count-in-cells (CiC) method to measure the galaxy PDF. The FFT-based method, once we accurately account for edge effects (particularly important when smoothing over large scales), is several orders of magnitude faster than standard CiC.
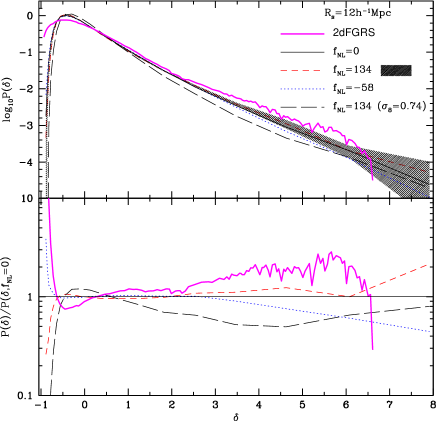
In the top panel of Fig. 4, we show the 2dFGRS L galaxy PDF, smoothed over 12 h-1 Mpc, together with the dark matter PDF of the models specified in the caption. In the bottom panel, we show the ratio between the PDFs presented in the top panel and the PDF of the Gaussian simulation. Clearly the 2dFGRS galaxy PDF lies well above all model predictions, and in particular it is very discrepant with models using a low value, as currently favoured by WMAP-3 data.
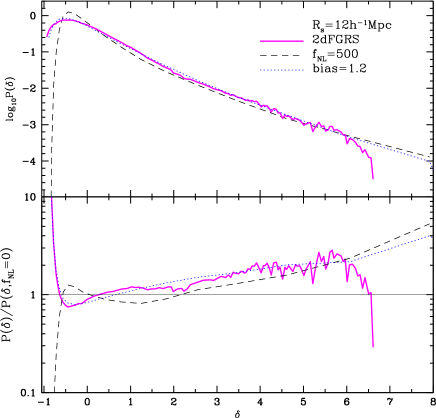
Two possible approaches may help reconcile the models with the observations. Firstly, in Fig. 4, we compare the galaxy PDF with the mass PDF, ignoring any bias between them. We consider a simple linear bias model (b ) between galaxy and dark matter on the weakly non-linear scales of 12 h-1 Mpc in the Gaussian model. Secondly, we consider a more extreme positive non-Gaussian model with , which predicts a significantly higher probability in the tail of the PDF. The constraints from WMAP on are only for very large scales, and the non-Gaussianity may be scale-dependent. In Fig. 5, we compare these two alternative models with the 2dFGRS L PDF.
In the following discussion, we assume that the data extracted from the 2dFGRS is a fair representation of the Universe, i.e. we require our model to easily reproduce the observations, something one potentially expects from a volume close to h-3 Mpc3. Clearly, if , then both a standard CDM with relatively strong linear bias on non-linear scales () or a strong non-Gaussian model () without bias reproduce the 2dFGRS PDF rather well. In the case of a low Universe, the bias needed for a pure Gaussian model would be uncomfortably large (), especially when accounting for the most recent determination of galaxy bias on weakly non-linear scales using the same 2dFGRS samples (Gaztaaga et al. 2005). Alternatively, a strong positive non-Gaussianity () coupled with a moderate galaxy bias could resolve the discrepancy between data and models. In fact, a linear bias model on the scales of 12 h-1 Mpc may not be realistic. Gaztaaga et al. (2005) have recently measured the galaxy bias on weakly non-linear scales (ie. 10 to 30 h-1 Mpc) using the 2dFGRS samples and found that the bias is non-linear in over-dense regions (). However the second order corrections are found to be negative, lowering the galaxy density, and hence favouring the non-gaussian interpretation.
Two issues are worth mentioning in this analysis: we focus in particular on the L volume-limited sample, because of the presence of two very large coherent superstructures in each 2dFGRS regions 111The Northern one is part of the SDSS great wall, which strongly influences all higher-order statistics (Baugh et al. 2004; Croton et al. 2004; Gaztaaga et al. 2005; Nichol et al. 2006), and even to some extent the 2-point correlation function. The other reason is that L galaxies are expected to only be very mildly biased tracers of the underlying dark matter (eg. Verde et al. 2002; Gaztaaga et al. 2005). Results from a larger volume-limited sample such as the L sample are more difficult to interpret, mostly because the galaxy density is much lower, making the tail of the PDFs harder to measure.
4 Conclusions
In this paper, we have studied a simple non-Gaussian model in which the initial potential has a small perturbation relative to the Gaussian random field and can be described by a simple non-linear coupling parameter (Komatsu et al. 2003). We produce a series of N-body simulations to model structure formation with both Gaussian and non-Gaussian initial conditions. We estimate the predicted halo mass function as a function of redshift, and make comparison with observations for the PDF of the 1-D DM velocity dispersion as well as for the PDF of the DM overdensity.
We find that, compared to the Gaussian model, a non-Gaussian model with deeper potential wells (ie. positive ) produces larger structures, whereas models with negative values do the opposite. The differences are very pronounced at high redshift, but are less evident at . The presence of large coherent structures at high redshift is a better indicator of early structure formation than similar objects at low redshift. Under the assumption of no velocity bias between galaxy and mass, our results show that it would be difficult to observe the protocluster of Miley et al. (2004) in a Universe with Gaussian initial conditions, but becomes much easier with a strong non-Gaussian field (eg. ). Protoclusters at high redshift can put strong constraints on non-Gaussian models, once the effects of bias and sample selections are properly addressed. High redshift structure formation potentially provides a more powerful test of possible primordial non-Gaussianity than does the CMB, albeit on smaller scales.
This of course assumes that we live in a typical region of the universe. However the large-scale coherent structures observed in the 2DFGRS (Baugh et al. 2005) that dominate the higher order statistics, and also seen in the SDSS, might indicate that a larger volume of the universe must be sampled to robustly test non-Gaussianity.
A detailed comparison between the 2dFGRS L galaxy PDF and the PDFs from a series of dark matter models show how difficult it is to reproduce the observed high tail in the galaxy PDF, when smoothed on 12 h-1 Mpc scales. In a Universe, we argued that only a Gaussian CDM model with strong linear bias between galaxies and mass () or a very strongly non-Gaussian model, with , can reconcile the results mapped by the 2dFGRS. The bias constraints obtained by Gaztaaga et al. (2005) using the same 2dFGRS samples favour the latter option. However the complication of galaxy bias on weakly non-linear scales in over-dense regions () makes it difficult to constrain the model parameters based on a simple linear bias model. Nevertheless, in a low Universe as favoured by recent WMAP-3 results, the case for primordial non-Gaussianity is strengthened. Further tests, with realistic galaxy formation recipes, are needed to properly address these issues. Our conclusions complement those in a recent theoretical paper by Hikage, Komatsu & Matsubara (2006), namely that non-Gaussianity can be well constrained by high redshift galaxy surveys and that non-linear galaxy bias makes it difficult to detect primordial non-Gaussianity at low redshift.
5 Acknowledgements
The authors would like to thank the referee for useful comments. XK acknowledges a Royal Society Chinese Fellowship for financial support. PN acknowledges receipt of a PPARC post-doctoral fellowship held at the IfA. XK and PN are grateful for the hospitality of the Physics Department of the University of Oxford during respective stays and visits.
References
- Baugh et al. (2004) Baugh, C. M., et al. 2004, MNRAS, 351L, 44
- Croton et al. (2004) Croton, D. J., et al. 2004, MNRAS, 352, 1232
- Gaztanaga et al. (2005) Gaztaga, E., Norberg, P., Baugh, C. M., & Croton, D. J., 2005, MNRAS, 364, 620
- Hikage et al. (2006) Hikage, C., Komatsu, E., & Matsubara, T., 2006, ApJ submitted, astro-ph/0607284
- Jenkins et al. (2001) Jenkins, A., et at., 2001, MNRAS, 321, 372
- Kayo et al. (2001) Kayo, I., Taruya, A., & Suto, Y., 2001, ApJ, 561, 22
- Komatsu and Spergel (2001) Komatsu, E., & Spergel, D. N. 2001, Phys.Rev.D,63,063002
- Komatsu et al. (2003) Komatsu, E., et al. 2003, ApJS, 148, 119
- Kurk et al. (2004) Kurk, J. D., Pentericci, L., Overzier, R. A., Rttgering, H. J. A., & Miley, R. K., 2004, A&A, 428, 817
- Matarrese et al. (2000) Matarrese, S., Verde, L., Jimenez, R., 2000, ApJ 541, 10
- Mathis, Diego & Silk (2004) Mathis, H., Diego, J. and Silk, J. 2004, MNRAS, 353, 681.
- MIley et al. (2004) Miley, G. K., et al. 2004, Nature, 427, 47
- Nichol et al. (2006) Nichol, R. C., et al. 2006, MNRAS, 368, 1507
- Norberg et al. (2002) Norberg, P., et al. 2002, MNRAS, 336, 907
- Robinson et al. (2004) Robinson, J., & Baker, J. E., 2000, MNRAS, 311, 781
- Sadeh, Rephaeli and Silk (2006) Sadeh, S., Rephaeli, Y. & Silk, J. 2006, MNRAS, 368, 1583
- Spergel et al (2006) Spergel, D. N., et al. 2006, astro-ph/0603449
- Springel et al. (2001) Springel, V., Yoshida, N., & White, S. D. M., 2001, New Astronomy, 6, 79
- Verde et al. (2002) Verde, L., et al. 2002, MNRAS, 335, 432