Magnetically Preferred Solar Longitudes: Reality?
Abstract
The observed persistence of specific periodicities detected in time series associated with solar surface magnetic activity over several solar cycles has led to numerous papers supporting the existence of preferred longitudes. Recent analysis of the past 120 years of sunspot number data showed that no observed periodicity remained coherent for durations greater than two 11-year solar cycles. Here we address the question: Could the observed periodicities of solar magnetic signals on time scales of two decades be the result of a purely stochastic process? We begin to answer this by comparing phase coherence between observed periodic signals and signals from a model using longitudinally random eruptions. A surprisingly non-negligible likelihood is found, approximately 1 in 3, that observed periodicities from integrated full-disk solar parameters are a chance occurrence for time series on the order of 20 years in duration.
National Solar Observatory, Tucson, Arizona, USA
2377 Route de Carcés, FR-83510 Lorgues, France.
1. Introduction
The observed solar surface is spatially and temporally variable due to the dynamic nature of magnetic active regions along with differential rotation and meridional flows. Even with such dynamics, active regions are not observed to be distributed randomly but rather magnetic regions tend to form “complexes of activity” (e.g. Bumba & Howard 1965; Brouwer & Zwaan 1990). Using Kitt Peak Vacuum Telescope (KPVT) magnetic synoptic maps, persistent bands of active “nests” were reported by de Toma et al. (2000) to support the idea of a stable pattern in the tachocline for sources of emerging flux. The lifetimes of these activity bands were found to be as long seven solar rotations.
For longer time scales, the temporal coherence of magnetic regions is expected to decrease for periods greater than the lifetime of the active regions. However, there have been numerous reports of persistent signals from spectral analysis with the sunspot number time series (e.g. Svalgaard & Wilcox 1975; Bogart 1982). Using autocorrelation analysis with 128 years of sunspot number time series data, Bogart (1982) found a persistent 27.5-day period signal. Additionally, work by Neugebauer et al. (2000) reported a very persistent signal with a well-defined period of 27.03 0.002 days, using over 30 years of solar magnetic field and solar wind measurements. Henney & Harvey (2002) also detected this signal using photospheric magnetograms (see Figure 1). In addition, using phase coherence analysis on the past 120 years of sunspot number data, Henney & Harvey (2002) showed that no observed periodicity remained coherent for durations greater than two solar cycles. Here we estimate the likelihood that coherent signals for durations on the order of two solar cycles are a result of chance occurrence. The model developed and used for this study can operate in several modes ranging from purely random longitudinal location for the infusion of new flux to including a specific longitude and rotation rate for new flux at any selected latitude. Since the integrated full-disk signal is of interest here, the solar model was used in its random longitude mode and does not include detailed solar surface flux transport (e.g. Schrijver & DeRosa 2003). The following section outlines the magnetic activity model utilized for this preliminary study.


2. Magnetic Activity Model
The modeling of large-scale solar magnetic activity is achieved in several steps. The initial step is to estimate the values of the mean eruption strength and decay-time for observed flux within a given latitude band. These values were determined using the same unsigned magnetic synoptic maps created from KPVT full-disk photospheric measurements that were used by Henney & Harvey (2002). The KPVT synoptic map data is described by Harvey et al. (1980). The long-term trends of solar magnetic activity are determined for 18 latitude bins of the KPVT synoptic magnetic maps. The maps were spatially sampled in sine-latitude bins and temporally sampled to create latitudinal time series. The temporal gaps are filled with a high-order autoregressive model, and each time series is temporally filtered using a non-recursive digital filter with a low-band pass between 10 and 60 days. Each time series is then median filtered with a window size of 83-days, then finally smoothed by convolving a Bartlet function with a window size of 27-days.
The filtered-flux time series is sampled at a cadence of 10 days, then is interpolated to a final cadence of 1 day. Allowing for daily eruptions, the model eruption strength and decay-time for each latitude band are then estimated by minimizing the standard deviation between the filtered- and modeled-flux time series (see Figure 2). The eruption strengths shown in Figure 2 vary from approximately to Mx. These values are in agreement with previous estimates of Mx and Mx for observed ephemeral (e.g. Harvey & Marten 1979) and active (e.g. Sheeley 1966) region strengths respectively. The estimated decay periods deviate around 100 days, which correspond to approximately to Mx/day. These decay rates are consistent with previous estimates of Mx/day reported by Harvey (1993).

The modeled flux emergence is governed by the input filtered-flux time series. After an initial period of approximately one hundred days of flux emergence to insure that equilibrium has been reached with the filtered-flux, the modeled time series is created for the same interval and cadence as the observed data set used to create Figure 1. Each latitude bin is assumed to rotate in agreement with the rotational profile observed by Howard & Harvey (1970). New flux is injected into a given latitude bin if the model flux drops below the filtered-flux time series for that latitude. The eruptions occur randomly in longitude over a range between 0 and 2. The eruption strengths are random with a distribution and mean value estimated from the filtered-flux time series. After a period of five times the decay-time the contribution from any given flux emergence is set to zero. For the 8839-day interval simulated, there were approximately eruptions distributed over the 18 latitude bins for each model realization.


3. Modeled Time Series Analysis
The solar magnetic activity model was run for 500 realizations, each case creating a simulated integrated full-disk magnetic flux time series with a total of 8839 days at a cadence of 1 day. Each time series was tested for signals that show similar levels of coherence to those illustrated in Figure 1, where a fixed frequency harmonic signal is considered coherent if it has negligible temporal variance in phase for the interval of time investigated. Following Henney & Harvey (2002), we estimate the phase and amplitude of a signal from a non-linear least-squares fit of a fixed frequency cosine function for overlapping segments of a time series. The phase can also be obtained with Fourier analysis, with the caveat that the phase error estimate is not readily available (for more discussion, see Henney & Harvey 2002). Examples of the power and phase coherence spectra for the simulated unsigned magnetic flux integrated full-disk time series are shown in Figure 3. The top two and bottom two figures, from simulated time series with phase coherence values of approximately 0.02 and 0.04 respectively, are similar to those shown in Figure 1.
4. Results and Discussion
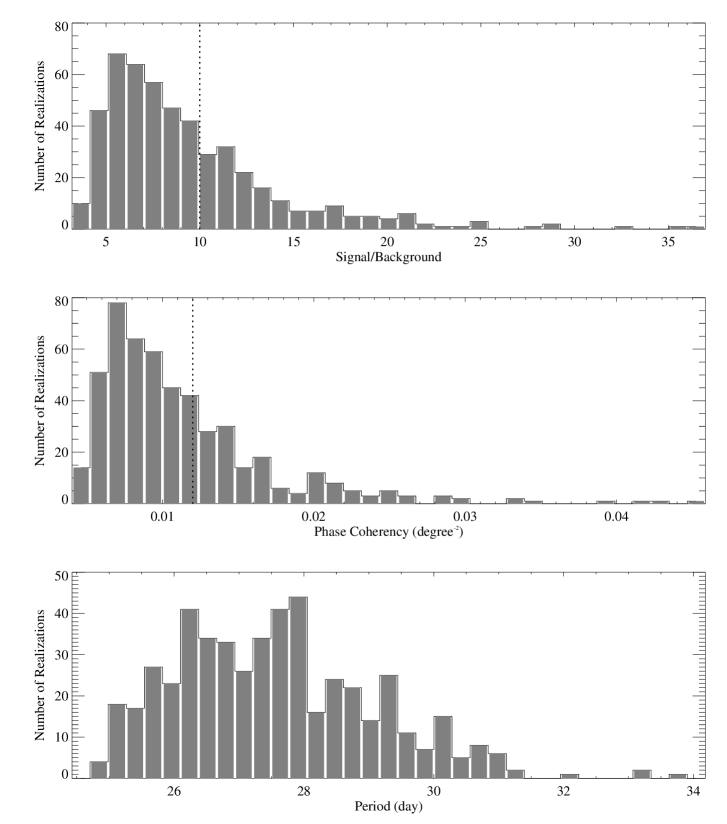
As a measure of the similarity between the simulated time series and those observed, the signal having the maximum phase coherence is selected for each of the 500 realizations. The distribution of the measured signal-to-background (S/B), the phase coherency, and period of the maximum phase coherence spectrum signal from each realization of the modeled solar magnetic activity are shown in Figure 4. In Henney & Harvey (2002), it was shown that a phase coherence value greater than 0.012 or with a S/B greater than 10 for the length of time investigated here corresponds to a signal that is phase coherent for approximately over 50% of the interval investigated. Illustrated by the vertical dotted lines in Figure 4, roughly 33% of the maximum phase coherent signals have a S/B greater than 10. In addition, nearly 34% of the signals have a phase coherence value greater than 0.012. By comparison, the 27.03-day signal in the sunspot number time series in Figure 1 has phase coherence and S/B values of approximately 0.016 and 7 respectively.
If the solar magnetic model also included activity “nesting” on time scales up to 7 months, as reported by de Toma et al. (2000), we would expect coherence values approaching those of the observed magnetic time series. This is supported with an extreme test using the current model in a mode that allows for coherent eruptions at a fixed period of rotation for a chosen latitude, while still matching the observed mean flux for each latitude bin as discussed in Section 2. This resulted in notably higher than observed peaks at the selected rotational period in both the power and coherence spectra. Observationally, the 27.03-day signal shown in Figure 1 is found to be phase coherent for durations of three years for terms scattered throughout the 24-year time series (see Figure 2 in Henney & Harvey 2002). This suggests that activity nesting may be sustained to form long lived magnetic complexes (LLMC) lasting for periods of a few years. This tentatively suggests that if the LLMC are the explanation for the observed coherence, they are scattered throughout the entire time series. If this is the case, the LLMC must rotate with the same period to contribute to the coherence spectrum. Tentative arguments favoring this suggestion can in fact be advanced: LLMC could resist dispersion if they have not broken their connection to the lower solar convection zone. Conceivably then, the generation of such fields can be favored at a given latitude. Work aimed at clarifying these issues is in progress.
5. Conclusion
We have shown that random eruptions of magnetic flux, modulated with solar differential rotation, have a surprisingly high probability of resulting in a coherent signal comparable to observation. The solar magnetic model utilized here with longitudinally random eruptions is treated as a baseline case since additional processes must be included to explain observed nesting of magnetic activity on time scales of months to a few years. For example, in Henney & Harvey (2002) it was found that the origin of the 27.03-day signal is most likely the result of long-lived, on the order of a few years, complexes of magnetic activity in the solar northern hemisphere. Whether long-lived complexes of magnetic activity merely by themselves are sufficient to explain the observed periodicities is under study. The inclusion of activity complexes or nesting, e.g. Schrijver & DeRosa (2003), with variable lifetimes and latitudes is under study and will be presented in future work. With the inclusion of nesting processes in the model, it is expected that the probability of resulting coherent signals would increase. This strongly suggests that spectral analysis results with integrated full-disk parameter signals, e.g. the sunspot number time series, should be interpreted with care. It should be stressed that these results do not lessen the possibility of very long-lived (between 30 to 300 solar rotations) magnetically active longitudes. However, these findings reinforce the need for spatial source tracking and phase coherence analysis to better understand the source of these signals and substantiate claims of very long-lived active longitudes resulting from spatially integrated time analysis of solar parameters.
6. Acknowledgments
The authors thank J. Harvey for his suggestions and comments with regards to this work. National Solar Observatory (NSO) Kitt Peak data used here are produced cooperatively by NSF/AURA, NASA/GSFC, and NOAA/SEL. This research was supported in part by the Office of Naval Research Grant N00014-91-J-1040. The NSO is operated by the Association of Universities for Research in Astronomy, Inc. under cooperative agreement with the National Science Foundation.
References
- Bogart (1982) Bogart, R. S. 1982, Solar Physics, 76, 155
- Brouwer & Zwaan (1990) Brouwer, M. P., & Zwaan, C. 1990, Solar Physics, 129, 221
- Bumba & Howard (1965) Bumba, V., & Howard, R. 1965, ApJ., 141, 1502
- Harvey (1993) Harvey, K. L. 1993, Ph.D. thesis, Astronomical Institute, Utrecht University
- Harvey et al. (1980) Harvey, J., Gillespie, B., Meidaner, P., & Slaughter, C. 1980, World Data Center A Report UAG-77
- Harvey & Marten (1979) Harvey, K. L., & Marten, S. F. 1979, Solar Physics, 32, 389
- Henney & Harvey (2002) Henney, C. J., & Harvey, J. W. 2002, Solar Physics, 207, 199
- Howard & Harvey (1970) Howard, R., & Harvey, J. 1970, Solar Physics, 12, 23
- Neugebauer et al. (2000) Neugebauer, M., Smith, E. J., Ruzmaikin, A., Feynman, J., & Vaughan, A. H. 2000, J. Geophys. Res., 105, A2, 2315
- Schrijver & DeRosa (2003) Schrijver, C. J., & DeRosa, M. L. 2003, Solar Physics, 212, 165
- Sheeley (1966) Sheeley, N. R. 1966, ApJ, 144, 723
- Svalgaard & Wilcox (1975) Svalgaard, L., & Wilcox, J. M. 1975, Solar Physics, 41, 461
- de Toma et al. (2000) de Toma, G., White, O. R., & Harvey, K. L. 2000, ApJ, 529, 1101