A High-Abundance Arc in the Compact Group of Galaxies HCG 62: An AGN- or Merger-Induced Metal Outflow?
Abstract
We present a Chandra study of the metal distribution in the X-ray bright compact group of galaxies HCG 62. We find that the diffuse X-ray emission is peaked at the core of the central galaxy NGC 4778, and is dominated by the contribution of the hot gas. The diffuse emission is roughly symmetric within , which is straddled by double-sided X-ray cavities aligned in the northeast-southwest direction. By mapping the emission hardness ratio distributions and by performing the 2-dimensional spectral analysis, we identify a remarkable high-abundance arc region at about ( kpc) from the X-ray peak that spans over a vast region from south to northwest, a part of which roughly coinciding with the outer edge of the southwest X-ray cavity. The measured average abundance in this arc is higher than that in its neighboring regions by a factor of about 2, and the abundance ratios therein are nicely consistent with the dominance of the SN Ia yields. We estimate that the mass of iron contained in the arc is , which accounts for % of the iron synthesized in the galaxy. The high-abundance arc could have been formed by the AGN activities. However, it is also possible that the arc was formed in a recent merger as is implied by the recent optical kinematic study (Spavone et al. 2006), which implies that mergers may be as important as AGN activities in metal redistributions in early-type galaxies and their associated groups or clusters.
1 Introduction
Measurements of the metal distribution in hot plasma in clusters and groups of galaxies can provide us with important constraints on the physics of feedback processes, which is tightly related to the study of supernova rates, stellar winds and gas heating on the group/cluster scales. Early X-ray observations of E/S0 galaxies showed that the iron abundance of the hot interstellar medium (ISM) is sub-solar and is significantly lower than the theoretical predictions based on the standard galactic wind and supernova synthesis models (e.g., Arimoto et al. 1997). In recent years this problem has been mitigated to some extent by the observations with Chandra and XMM-Newton which show clear evidence that the gas abundance is close to or slightly over the solar abundance in the inner regions of bright E/S0 galaxies (e.g., Buote 2002; Xu et al. 2002; Matsushita et al. 2003; Humphrey and Buote 2006), although the sub-solar abundance still cannot be ruled out unambiguously for the X-ray faint systems (e.g., Sarazin et al. 2001; Irwin et al. 2002; O’Sullivan & Ponman 2004). It also has been revealed that the iron abundance distributions in a few bright clusters of galaxies are not simply central-peaked, which include the Perseus Cluster (Sanders et al. 2005), Abell 1060 (Hayakawa et al. 2004, 2006), Abell 2199 (Johnstone et al. 2002) and AWM 7 (Furusho et al. 2003). In these clusters the highest abundances are observed in off-center regions located at from a few kpc to a few tens kpc from the cluster center. It has been suggested that the observed fluctuations in the abundance distributions may be caused by metal-enriched bubbles lifting from the cluster core (Sanders et al. 2005; Mathews et al. 2003), resonance scattering (e.g., Gil’fanov et al. 1987), or inhomogeneous cooling in the thermal evolution history (Brighenti & Mathews 2005). In the Perseus Cluster the high-abundance region was reported to coincides with the edge of a radio mini-halo, indicating that it could have been formed by the AGN activities in the recent past.
In this work, we present a Chandra study of the 2-dimensional metal distribution in the hot gas of the compact group of galaxies HCG 62 (; Hickson et al. 1992). HCG 62 is a gas-rich, luminous group in X-rays (Lx= erg s-1; Ponman et al. 1996). It contains 4 bright member galaxies and is dominated by the E3/S0 galaxy NGC 4778, the brightest member in both optics and X-rays (Pildis et al. 1995) that is identified as a low-luminosity AGN (Coziol et al. 1998). Kinematic study of the rotation curve and velocity dispersion indicated that NGC 4778 is possibly interacting with another member NGC 4761 (Spavone et al. 2006). One other luminous member NGC 4776 (S0) is located at a projected distance of only west of NGC 4778 with a peculiar velocity of 737 km s-1. However, it shows no signs of interaction or merging with NGC 4778 (Rampazzo et al. 1998). In this paper, we adopted a distance of 57.7 Mpc to the group by using km s-1 Mpc-1, and . We utilized the solar abundance standards of Grevesse and Sauval (1998), where the iron abundance relative to hydrogen is in number.
2 Observation and Data Reduction
The Chandra observation of HCG 62 was carried out on January 25, 2000 (ObsID 921) for a total exposure of 49.2 ks with CCDs 3, 5, 6, 7 and 8 of the Advanced CCD Imaging Spectrometer (ACIS) in operation. The center of the group-dominating galaxy NGC 4778 was positioned close to the normal aim point on the S3 chip (CCD 7) with an offset of . The events were collected with a frame time of 3.2 s and telemetried in the Faint mode. The focal plane temperature was set to -110 ∘C. Since for the time being 1) the effects of the ACIS CTI and its corrections on the abundance measurements are not fully clear, 2) for the iron abundances below 1.5 solar the non-CTI-corrected and CTI-corrected results show only little, negligible difference between them, and 3) in general, the results of the spectral analysis with the non-CTI-corrected ACIS data are nicely consistent with those obtained with the XMM-Newton data, with the oxygen abundance being the only notable exception (Sanders & Fabian 2006a), in this work we used the standard Chandra data analysis package CIAO software (version 3.0) and applied the latest CALDB (version 3.2.3) to process the data extracted from the S3 chip without applying any CTI correction. We kept events with ASCA grades 0, 2, 3, 4 and 6, and removed all the bad pixels, bad columns, columns adjacent to bad columns and node boundaries. We examined the lightcurves of the source-free regions on the backside-illuminated S1 (CCD 5) and S3 chips and detected no strong occasional background flares. To estimate the contribution of the diffuse emission in the S3 boundary regions (§3.2.1) we analyzed the ROSAT PSPC data of HCG 62 acquired on December 27, 1995, which lasted for 19.6 ks. We followed the standard ROSAT PSPC data analysis procedures to process the data by using XSELECT (version 2.3) and FTOOLS (version 6.0.3). We also analyzed the VLA 20 cm (L-band) observations of HCG 62 obtained on June 16, 2001 by using the Astronomical Image Processing System (AIPS) of NRAO following the standard procedures. Absolute flux density was calibrated by the use of the 3C 48 data, whose flux density was set to be 15 Jy at the selected wavelength. The calibration error is less than 5% in the VLA data reduction.
3 X-Ray Imaging Spectroscopy
3.1 Morphology and Surface Brightness Profiles
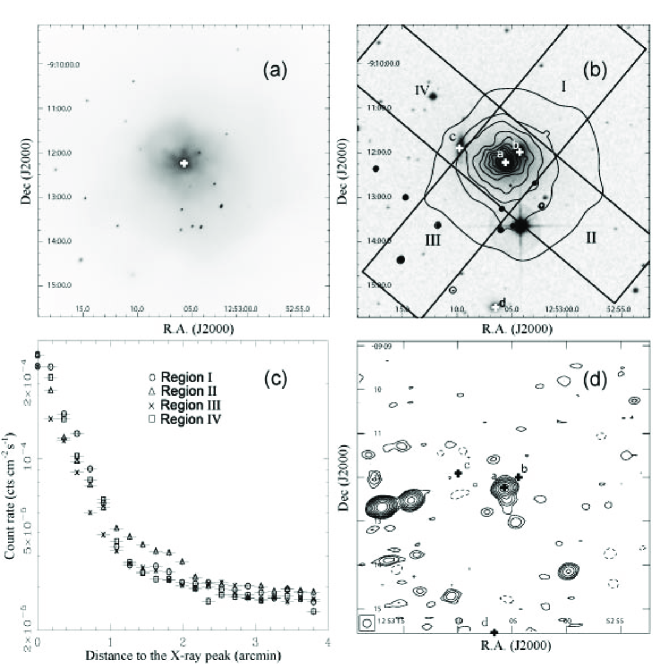
In Figure 1a we show the smoothed 0.7–7 keV Chandra ACIS S3 image of HCG 62 in square-root scale, which has been corrected for exposure but not for background. We find that the position of the X-ray peak (RA=12h53m05.7s Dec=-09d12m15.2s J2000) is consistent with the optical center of the dominating galaxy NGC 4778 (RA=12h53m05.9s Dec=-09d12m16.3s J2000; Hickson et al. 1989) to within about . The strong diffuse X-ray emission covers the whole S3 chip, and is roughly symmetric within the central region that is straddled by double-sided X-ray cavities aligned in the northeast-southwest direction. The two cavities have similar sizes with a projected linear extent of about ( kpc) for each. Except for the cavities no other apparent X-ray substructure is identified. To study the X-ray morphology more quantitatively we extracted the counts in four strip regions (Fig. 1b) and plotted the exposure-corrected count distributions in Figure 1c. We find that in about from the X-ray peak the counts are higher in southwest than in other directions at the 90% confidence level. We will discuss the possible origin of this surface brightness excess in §4.
About 20 point sources can be resolved visually on the Chandra image, of which 18 sources are detected at the confidence level of with the CIAO tool celldetect and wavdetect. One of them is detected at the center of NGC 4776 to within 0.5″, which is possibly a low-luminosity AGN hosted in NGC 4776, and one other is identified with a foreground star (HD 111960; Hog et al. 1998). No optical or radio counterpart of the rest detected X-ray point sources can be found in available literatures.
In Figure 1d we show the 1.43 GHz intensity contour map of HCG 62. The core of HCG 62 is identified as an extended, weak radio source that has a flux density of mJy/b. The emission distribution is roughly round within about 0.3′, which extends farther towards the south so as to form a jet-like structure that tends to link to a weak radio component located at about south of NGC 4778. We notice that the jet-like structure coincides with one of the X-ray cavity exactly, suggesting that the cavities may be fossil radio bubbles. This supports the conclusion of Coziol et al. (1998) that NGC 4778 is an AGN in relatively quiescent state, although we failed to detect the central point source in either the X-ray band or the radio band at a significance of 3 (see also Morita et al. 2006).
3.2 Spectral Properties and Abundance Distribution
3.2.1 Background
By studying the ROSAT PSPC surface brightness profile in keV we find that the diffuse X-ray emission of HCG 62 extends outwards to at least where the count rate is about above the mean background value. To construct the local Chandra S3 background spectrum, we extracted the spectrum of a region at the boundary of the S3 chip that is adjacent to the S4 (CCD 8) chip, and then subtracted the contaminating gas component from it. We modeled the gas emission with an absorbed APEC component, whose temperature (=1.4 keV) and abundance (=0.45 ) are obtained from the ROSAT PSPC spectral analysis for roughly the same region. We find that the obtained S3 background has a spectral energy distribution consistent with that of the source-free region on the S1 chip and that used in Morita et al. (2006). In 0.2–2 keV, where the particle and instrument components are minor, the count rate of the obtained S3 background ( cts s-1 arcmin-2) is close to the average X-ray background count rate calculated from the ROSAT All-Sky Survey diffuse background maps ( cts s-1 arcmin-2). We also have crosschecked our spectral fittings either by choosing background regions with different boundary locations or by applying the Chandra blank field spectra alternatively, and obtained essentially the same best-fit spectral parameters. This is not surprising because our source spectra were extracted in relative inner () regions where the X-ray background is overwhelmed by the emission of the galaxy in the selected bandpass.
3.2.2 Azimuthally Averaged Analysis
After removing all the detected point sources we first performed both the projected and deprojected analysis of the Chandra spectra extracted in 6 annular regions, which span over and are all centered on the X-ray peak. We limited the fittings to 0.7–7 keV to minimize the effects of the instrumental background at higher energies and the calibration uncertainties at lower energies. To compensate for the degradation of the ACIS energy resolution we included an additional 5% systematic error in the spectral fittings. We fitted the spectra by using a model that consists of an APEC (gas) and a power-law (unresolved low-mass X-ray binaries and background sources) component, both subjected to a common absorption. In the deprojected analysis, we used the XSPEC model projct to evaluate the influence of the outer spherical shells onto the inner ones. Since allowing the absorption to vary did not improve the fit, we fixed it to the Galactic value (Dickey & Lockman, 1990). We find that the contribution of the hard component is generally less than 10% of the total flux, if the photon index is fixed to 1.7, the typical value for the point source population in early-type galaxies. The fittings are marginally acceptable or poor for the two innermost annuli in the projected analysis, while for all the annuli the fittings are acceptable in the deprojected analysis (Table 1). The best-fit deprojected gas temperature increases steadily from about keV at the X-ray peak to keV in , suggesting the group origin of gas in the outer regions. In both the projected and deprojected analysis the obtained average abundances are nearly consistent with a constant, except that in ( kpc) and ( kpc) the abundances are significantly higher at the 90% confidence level; the deprojected abundances of these two regions are and , respectively. We notice that in general our results agrees nicely with those obtained with Chandra and XMM-Newton by Morita et al. (2006) at the 90% confidence level.
3.2.3 2-Dimensional Gas Temperature and Abundance Distributions
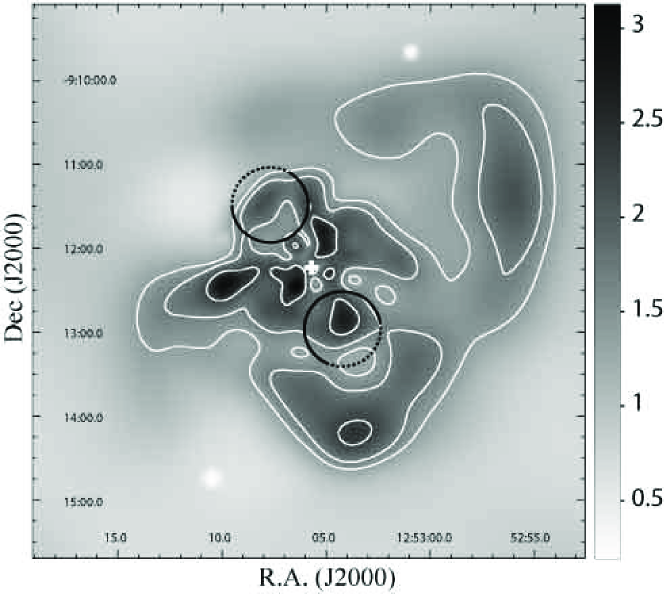
In order to get more insight into the abundance gradient we first plot the 2-dimensional distribution of the hardness ratio of the emission in keV, a significant part of which is from the blended Fe-L lines, to the continuum emission extracted in 0.3-0.65 keV and 1.4-5 keV (Fig. 2). We find that at the 90% confidence level the hardness ratio distribution is highly asymmetric; the relative iron emissions is significantly enhanced in two regions at about southwest and northeast of the X-ray peak, respectively. The two regions are linked together by an arc-like region showing high hardness ratios, a part of which roughly coincides with the outer edge of the southwest X-ray cavity with the jet-like radio structure pointing towards it. We notice that the arc structure approximately lies within the annulus where a high abundance value is found in the azimuthally averaged analysis. In the central region where the average abundance is found high as well, the iron line emissions also shows remarkable, spatially asymmetric dominance over the continuum emissions.
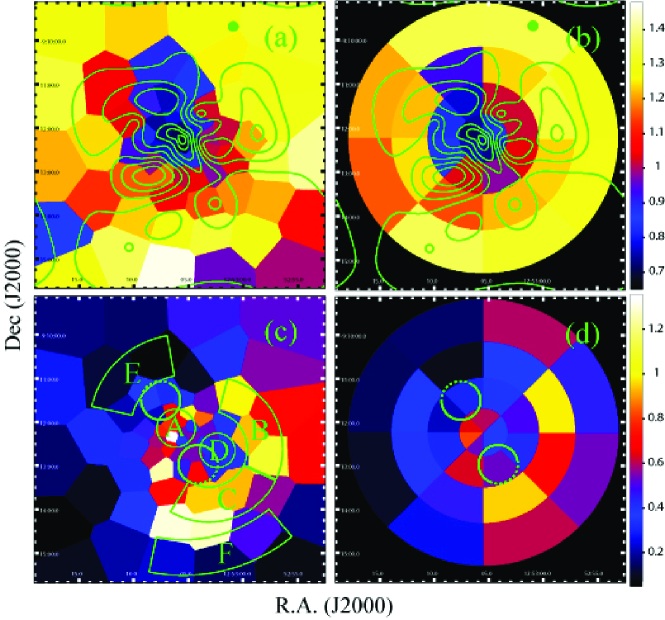
Since the high iron line-to-continuum emission ratios can be ascribed to variations in either gas abundance, or temperature, or both of them, we then probed the 2-dimensional distributions of the gas temperature and abundance simultaneously via direct spectral modelings utilizing both the Centroidal Voronoi Tessellation (CVT) algorithm with a conservative threshold of 800 photon counts per cell and the pie-binning algorithm. Since the contribution of the hard spectral component is expected to be rather weak, we fitted the keV spectra extracted in each CVT and pie cell by using a single absorbed APEC model with the absorption fixed to the Galactic value; allowing the absorption to vary or choosing an absorbed APEC + power-law model does not improve the fittings or change the best-fits significantly. When it is necessary we used the gehrels weight for small number statistics, which is defined as (Gehrels 1986). The obtained temperature and abundance maps are shown in Figure 3. To examine if these results are biased by the degeneracy of temperature and abundance in the spectral fittings, on the temperature maps we also overlaid the contours of the exposure-corrected hardness ratio of the emission in 1.4–5 keV to that in 0.3–0.65 keV, which are both continuum-dominated and thus can be used to trace the temperature gradients. We find that the obtained temperature distribution in the CVT bins is consistent with that obtained in the pie bins, both approximately following distribution of the continuum hardness ratio contours. The temperature maps show that the 2-dimensional temperature distribution in the group is roughly symmetric, exhibiting a relatively cold core and a tendency for slightly higher values at in the south and west of NGC 4778.
The 2-dimensional abundance maps obtained with the two binning methods agree with each other as well. At the 90% confidence level we find that there is an asymmetric high-abundance arc region, which spans over about 120 degrees azimuthally from south to northwest of the X-ray peak and roughly coincides with the outer edge of southwest X-ray cavity in part. The high-abundance arc approximately matches the region that shows high iron line-to-continuum emission ratios (Fig. 2), indicating that the enhanced iron emissions is mostly caused by an increase in the iron abundance. The width of the arc is , and the average projected distance of the arc to the X-ray peak is about ( kpc). In the arc the abundance shows apparent spatial variations ranging from 0.9 to 1.3 , while the abundance averaged over the whole arc is . There is also an asymmetric high-abundance region located close to the X-ray peak, where the iron line-to-continuum intensity ratio is high (Fig. 2), too. In the innermost regions and the regions show high abundances, the typical abundance errors are about %. In the outer regions the errors increase to about %.
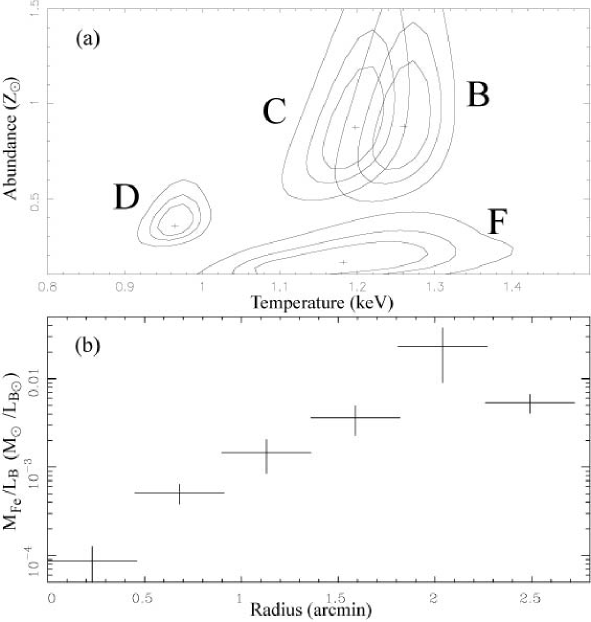
To crosscheck our results further we extracted the spectra from 6 circular or pie regions as are defined in Figure 3c and fitted them with the same spectral model as is used above. We find that the results (Table 1) are generally consistent with those implied in the 2-dimensional temperature and abundance maps. If we lower the abundances of the arc (regions B and C) or the central region (region A), the fits become significantly worse and unacceptable. By studying the two-dimensional fit-statistic contours of temperature and iron abundance at the 68%, 90% and 99% confidence levels for the high-abundance arc (region B+C) and its surrounding regions (regions D and F) we are confident that the iron abundance in the arc region is higher than those of their neighboring regions at a significance of 90% (Fig. 4a).
4 Discussion and Conclusion
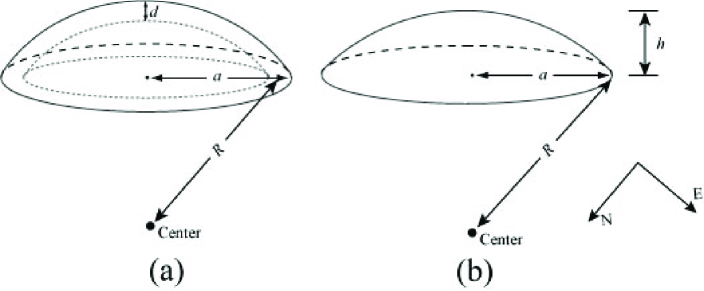
We find that there is a remarkable high-abundance arc region at about ( kpc) from the X-ray peak of HCG 62, which spans from south to northwest. The average abundance in the arc is higher than that in its neighboring regions by a factor of about 2. A part of the high-abundance arc roughly coincides with the outer edge of the southwest X-ray cavity, while with the current data no other particular structure such as a cold front can be identified as associated with the arc. Nor is there significant gas pressure variations across the arc. This arc may be caused by the project effect of a part of an optically thin spherical shell that has been excessively metal-enriched. By studying its geometry (Fig. 5) we estimate that the part shell may has an inclination angle (the angle between the axis of the shell and line of sight) of 40 degrees, a thickness of kpc, a base radius of kpc, and a radius of kpc. The iron mass involved in such a part shell is calculated to be . It is also possible that the geometry is a spherical cap (Fig. 5) with roughly the same inclination angle, whose height, base radius and radius are kpc, kpc and kpc, respectively. In this case the calculated iron mass is . Alternatively, if the high-abundance arc is a ring with a cross-section radius of kpc and a radius of kpc, the calculated iron mass is reduced to . Note that without further observational constraints it is difficult to figure out the actual 3-dimensional geometry of the high-abundance region. However, since the calculated iron mass is proportional to the square root of the assumed volume, the bias of the estimated iron mass should be relatively small. The involved iron mass shall have a conservative lower limit of about , which accounts for about 3% of the iron that has been synthesized in NGC 4778 assuming an age of 10 Gyr.
The off-center, asymmetric iron concentrations also have been revealed in a few other systems with a large scatter in the deduced iron mass involved in the high-abundance regions. In a Chandra observation of the Perseus Cluster Sanders et al. (2005) reported a high-abundance shell at about 93 kpc from the central nucleus, which is located at the edge of a radio mini-halo with two Hα filaments pointing towards it. The authors argued that this shell may be a remnant of a metal-enriched bubble lifting from the cluster core. Based on their data we estimate that the iron mass in the high-abundance shell is . In the relaxed cluster Abell 1060 Hayakawa et al. (2006) found that there is a high-abundance flat “blob” northeast of the central bright galaxy. The iron mass deduced with the XMM-Newton dataset is . This value, however, is larger than that obtained by Hayakawa et al. (2004) with the Chandra observation by about one order of magnitude, which was ascribed to the relatively low effective area of Chandra for the Fe-K photons. In the rich cluster Abell 2199 Johnstone et al. (2002) found that the abundance is higher in a north-northeast region about ( kpc) from the center. In the poor cD cluster AWM 7 Furusho et al. (2003) showed that the spatial distribution of the hardness ratio of the counts in keV to that in keV infers the existence of two high-abundance structures where the abundance has the peak values. The two structures are located at about 7 kpc northeast and southwest of the clusters center, containing about of iron. In these systems it is estimated that the mass of iron in the high-abundance regions account for about 0.02% to 4% of the total mass of iron that has been synthesized in the past.
The off-center high abundance values may be interpreted as a central abundance dip that can be caused by the resonance scattering (e.g., Gil’fanov et al. 1987; Matsushita et al. 2003). However, by modeling the resonance scattering in the Centaurus cluster and Abell 2199 Sanders and Fabian (2006b) found that the degradation effect of the resonance scattering on the Fe-L and Fe-K lines are only about 10% and 30%, respectively, which is insufficient to cause the observed central abundance dip. Similarly, in HCG 62 the estimated column density of the hot gas is 3.851020 cm-2 in the direction of of the group center, which is too small to weaken the intensities of the Fe-L lines with large oscillator strengths in the line of sight. Thus the contribution of the resonance scattering should be negligible.
By modeling the spectra extracted from the high-abundance arc, we obtained the average metal abundances = , = , = and = (90% confidence level). After comparing the measured metal abundance ratios with the theoretical supernova synthesis models (the W7 model and the weighted SN II model in Nomoto et al. 1997), we find that the SNe Ia contribute about (90% confidence level) of the iron in the high-abundance arc. For the innermost ( kpc) region the obtained abundances are = , = , = and = , which infers a rather consistent SN Ia contribution fraction of for iron. We notice that the high SN Ia contribution fractions in the high-abundance regions in HCG 62 are very close to those found in the central regions of clusters and groups (Wang et al. 2005 and references therein). Moreover, in HCG 62 we find that the iron mass-to-optical light ratio is significantly higher in the high-abundance arc than in other regions (Fig. 4b). So it is natural to speculate that the high-abundance gas may have been enriched in the group’s core region and then been moved outwards to the present position.
The high-abundance arc could have been formed during the previous episodes of AGN activities that might also create the two X-ray cavities, since a part of the arc roughly coincides with the outer edge of the southwest cavity, inferring that the metal-enriched gas was pushed outwards as the cavity expanded. However, we notice that there are several facts that cannot be explained naturally with the AGN scenario. First, the X-ray cavities are similar in size and luminosity, and have nearly the same distances to the NGC 4778’s nucleus. This strongly suggests symmetrical AGN outbursts in the past, if the origin of the cavities is indeed related to the AGN. However, the high-abundance arc and the gas emission excess (Fig. 1c) are only detected in the southwest. No hint for the existence of similar structures in the northeast direction is found within the Chandra ACIS field, or in even outer regions (out to about ) based on the 2-dimensional mappings with the ROSAT PSPC data. Second, a close examination shows that the high-abundance arc spans over a region that is much larger and wider than the outer edge of the southwest cavity (Fig. 2 and 3). Third, unlike in the Perseus Cluster (Sanders et al. 2005) where a high-abundance shell is detected at the edge of a radio mini-halo, no such direct radio evidence for recent AGN activities is found on the 1.4 GHz map of HCG 62 at the 90% confidence level. Forth, results of recent N-body simulation works cast some doubts on the efficiency of metal transport via AGN activities. For example, it is concerned that the buoyant bubbles and/or the energetic jets alone may not be capable of transporting and diffusing materials of the inner regions outwards with a sufficiently high efficiency (Churazov et al. 2001; Vernaleo & Reynolds 2005; Heath et al. 2006) to create a structure like the perfectly shaped high-abundance arc seen in HCG 62. Finally, it should also be noticed that multi-band observations show that there is no evidence for a currently active AGN at the center of NGC 4778, and the AGN origin of the X-ray cavities has been questioned by Morita et al. (2006) based on their thermal dynamic analysis as well.
Still, the possibility of the AGN origin of the high-abundance arc cannot be completely ruled out with the current data quality and simulation techniques, despite of the uncertainties mentioned above. It is expected that some of these uncertainties will be carefully inspected in the next-generation simulations with or particles by fully taking into account additional complexities such as the large-angle jet precession and gas turbulence. On the other hand, it is worthy to investigate the possible impacts of other mechanisms on metal transport and redistribution, primarily including the supernova-driven winds, starburst-driven winds, and galaxy mergers and collisions. By adopting a B-band luminosity of (Hickson et al. 1989) for NGC 4778 and recent supernova rates (e.g., Sharon et al. 2006), we find that the dynamic power of the supernova events temporally averaged over the past few Gyr is erg s-1. Obviously, the metal-enriched gas in the high-abundance arc in HCG 62 could have been lifted to the present location from inner regions by the supernova winds, if only 10% of the total supernova dynamic energy accumulated in the past 1 Gyr was used. However, this mechanism has the difficulty to account for the asymmetric geometry of the high-abundance arc, unless a rather anisotropic distribution of supernova winds is reasonably introduced to create a major concentration of iron in the southwest direction. A similar conclusion can be applied to the galactic winds driven by recent or ongoing starbursts as well, for which no positive observational evidence is found in literatures.
It is also possible that the high-abundance arc was formed in a recent merger event. Since in a merger metals in the infalling galaxy is expected to form a stripe behind it due to the ram-pressure stripping (Schindler et al. 2005), according to the geometry of the high-abundance arc we suspect that most metals in the arc is likely to originate in the central metal accumulation of the primary galaxy (NGC 4778). Roettiger et al. (1997) showed that, if the velocity of the infalling galaxy exceeds the speed of sound, a bow shock will form to inhibit the ram-pressure stripping of the infalling gas, which helps a significant amount of the infalling gas penetrate the core of the primary galaxy. A large fraction of the metal-enriched gas originally accumulated in the inner regions of the primary galaxy is expected to be expelled outwards in an anisotropic way during such a supersonic core passage. On the other hand, if the speed of the infalling galaxy is subsonic, the infalling gas may have been completely stripped before or during the core passage (Fabian & Daines 1991). In this case a metal outflow in the primary galaxy may also have the chance to arise due to the momentum transfer from the infalling galaxy to the primary galaxy. The impact of mergers on metal redistribution depends not only on the masses and velocities of the colliding galaxies, but also on the collision angle, as well as other complicated effects caused by, e.g., gas turbulence and magnetic field. So far these effects have not been fully understood, and have not been fully accessed in the numerical studies, but they are potentially crucial in the dense environment in and around the group’s core where the gas density is much higher than the gas density of the cluster halo. In-depth numerical simulations taking into these effects are invoked to inspect whether a high-abundance arc can be created in the hot gas during a merger with the size and geometry comparable to what are observed in HCG 62.
On the observational aspect, there are indeed some hints for a recent minor merger in HCG 62. First, the excess gas emission observed in in the southwest of the X-ray peak, which roughly coincides with the inner edge of the high-abundance arc, can be ascribed to an excess in gas density since there is no particular temperature or abundance variations associated with this feature (§3). A recent minor merger may be a reasonable explanation for such a gas excess. Second, the optical kinematic study of NGC 4778 by Spavone et al. (2006), who used a long-slit positioned approximately in the east-west direction, revealed both the twisting in the position angle of isophotes and the nuclear counterrotation in the innermost region of the galaxy, apparently inferring that there is a pc core decoupled from the whole galaxy. The authors also showed that the velocity dispersion distribution of the outer halo is strongly distorted in the southwest direction, which cannot be interpreted naturally in terms of a projection effect due to the presence of NGC 4776. Based on these peculiarities the authors argued that the group must have suffered a recent minor merger. It is possible that the same merger event triggered AGN activities to create the low-density regions shown as the X-ray cavities, whose age is estimated to be Myr (Morita et al. 2006). However, the case may be more complicated, since by using the X-ray and radio data we failed to detect any distinct evidence for either the distortion of gas morphology, or the existence of a bow shock or a front, which are expected to be visible on Gyr timescales since the merger occurred (e.g., Roettiger et al. 1997).
By taking into account both the iron directly blown into the intra-group medium during the SN Ia explosions and the iron lost in the stellar winds, we estimate the enrichment times (Böhringer et al. 2004) using the method that was described in details in Wang et al. (2005). We find that the times needed to enrich the high-abundance arc and the innermost region are Gyr and Gyr, respectively. If metals in the innermost region does have been accumulating continuously since the destruction of the original central metal accumulation, we estimate that the average speed of the metal outflow is km s-1. Thus, the energy needed to blast the high-abundance gas outwards is estimated to be erg.
5 Summary
We identify a remarkable high-abundance arc region at about ( kpc) from the center of NGC 4778, the dominating galaxy of HCG 62. In the arc the average abundance is higher than that in the neighboring regions by a factor of about 2 with the measured metal abundance ratios nicely consistent with the dominance of the SN Ia yields. The arc contains of iron, or about % of the cumulative mass of iron that has been synthesized in the galaxy, which is rather high comparing with the clusters of galaxies that exhibit similar high-abundance structures. A part of the high-abundance arc roughly coincides with the outer edge of the southwest X-ray cavity. With current data quality it is difficult to determine the origin of this high-abundance arc. The optical photometric and kinematic evidence suggests that the structure is likely to be formed in a recent merger, whereas the AGN origin still cannot be completely ruled out.
References
- (1) Arimoto, N., Matsushita, K., Ishimaru, Y., Ohashi, T., & Renzini, A. 1997, ApJ, 477, 128
- (2) Böhringer, H., Matsushita, K., Churazov, E., Finoguenov, A., & Ikebe, Y. 2004, A&A, 416, L21
- (3) Brighenti, F., & Mathews, W. G. 2005, ApJ, 630, 864
- (4) Buote, D. A. 2002, ApJ, 574, 135
- (5) Coziol, R., Ribeiro, A. L. B., de Carvalho, R. R., & Capelato, H. V. 1998, ApJ, 493, 563
- (6) Churazov, E., Brüggen, M., Kaiser, C. R., Böhringer, H., & Forman, W. 2001, ApJ, 554, 261
- (7) Dickey, J. M., & Lockman, F. J. 1990, ARA&A, 28, 215
- (8) Fabian, A. C., & Daines, S. J. 1991, MNRAS, 252, 17
- (9) Furusho, T., Yamasaki, N. Y., & Ohashi, T. 2003, ApJ, 596, 181
- (10) Gehrels, N. 1986, ApJ, 303, 336
- (11) Gil’fanov, M. R., Syunyaev, R. A., & Churazov, E. M., 1987, Soviet Astr. Lett., 13, 3
- (12) Grevesse, N., & Sauval, A. J. 1998, Space Sci. Rev., 85, 161
- (13) Hayakawa, A., Furusho, T., Yamasaki, N. Y., Ishida, M., & Ohashi, T. 2004, PASJ, 56, 743
- (14) Hayakawa, A., Hoshino, A., Ishida, M., Furusho, T., Yamasaki, N. Y., & Ohashi, T. 2006, PASJ, 58, 695
- (15) Heath, D., Krause, M., & Alexander, P. 2006, MNRAS, in press (astro-ph/0610309)
- (16) Hickson, P., Kindl, E., & Auman, J. R. 1989, ApJS, 70, 687
- (17) Hickson, P., Mendes de Oliveira, C., Huchra, J. P., & Palumbo, G. G. 1992, ApJ, 399, 353
- (18) Hog, E., Kuzmin, A., Bastian, U., Fabricius, C., Kuimov, K., Lindegren, L., Makarov, V. V., & Roeser, S. 1998, A&A, 335, L65
- (19) Humphrey, P. J., & Buote, D. A. 2006, ApJ, 639, 136
- (20) Irwin, J. A., Sarazin, C. L., & Bregman, J. N. 2002, ApJ, 570, 152
- (21) Johnstone, R. M., Allen, S. W., Fabian, A. C., & Sanders, J. S. 2002, MNRAS, 336, 299
- (22) Mathews, W. G., Brighenti, F., Buote, D. A., & Lewis, A. D. 2003, ApJ, 596, 159
- (23) Matsushita, K., Finoguenov, A., & Böhringer, H. 2003, A&A, 401, 443
- (24) Morita, U., Ishisaki, Y., Yamasaki, N. Y., Ota, N., Kawano, N., Fukazawa, Y., & Ohashi, T. 2006, PASJ, 58, 719
- (25) Nomoto, K., Iwamoto, K., & Kishimoto, N. 1997, Science, 276, 1378
- (26) O’Sullivan, E., & Ponman, T. J. 2004, MNRAS, 349, 535
- (27) Pildis, R. A., Bregman, J. N., & Evrard, A. E. 1995, ApJ, 443, 514
- (28) Ponman, T. J., Bourner, P. D. J., Ebeling, H., & Bohringer, H. 1996, MNRAS, 283, 690
- (29) Rampazzo, R., Covino, S., Trinchieri, G., & Reduzzi, L. 1998, A&A, 330, 423
- (30) Roettiger, K., Loken, C., & Burns, J. O. 1997, ApJS, 109, 307
- (31) Sanders, J. S., Fabian, A. C., & Dunn, R. J. H. 2005, MNRAS, 360, 133
- (32) Sanders, J. S., & Fabian, A. C. 2006a, MNRAS, 371, 1483
- (33) Sanders, J. S., & Fabian, A. C. 2006b, MNRAS, 370, 63
- (34) Sarazin, C. L., Irwin, J. A., & Bregman, J. N. 2001, ApJ, 556, 533
- (35) Schindler, S., Kapferer, W., Domainko, W., Mair, M., van Kampen, E., Kronberger, T., Kimeswenger, S., Ruffert, M., Mangete, O., & Breitschwerdt, D. 2005, A&A, 435, L25
- (36) Sharon, K., Gal-Yam, A., Maoz, D., Filippenko, A. V., & GuhaThakurta, P. 2006, ApJ, submitted (astro-ph/0610228)
- (37) Spavone, M., Iodice, E., Longo, G., Paolillo, M., & Sodani, S. 2006, A&A, in press (astro-ph/0606730)
- (38) Trinchieri, G. 1995, ASPC, 80, 409
- (39) Vernaleo, J. C. & Reynolds, C. S. 2006, ApJ, 645, 83
- (40) Wang, Y., Xu, H., Zhang, Z., Xu, Y., Wu, X., Xue, S., & Li, Z. 2005, ApJ, 631, 197
- (41) Xu, H., Kahn, S. M., Peterson, J. R., Behar, E., Paerels, F. B. S., Mushotzky, R. F., Jernigan, J. G., Brinkman, A. C., & Makishima, K. 2002, ApJ, 579, 600
| Projected | Deprojected | notes | ||||||
|---|---|---|---|---|---|---|---|---|
| Region No. | kT(keV) | () | kT(keV) | () | ||||
| Annular RegionsaaSpectra were extracted in six annular regions (No.) spanning over 0′-0.44′, 0.44′-0.88′, 0.88′-1.33′, 1.33′-1.77′, 1.77′-2.21′ and 2.21′-2.65′, respectively. For the second annulus, we also fitted the spectrum extracted when the two X-ray cavities were excluded and the spectra of the northeast and southwest cavities, respectively. Errors are quoted at the 90% confidence level. | ||||||||
| 1 | 143.6/117 | 1412.1/1213 | ||||||
| 2 | 223.4.5/138 | |||||||
| 71.1/64 | without cavities | |||||||
| 67.3/57 | NE cavity only | |||||||
| 48.9/53 | SW cavity only | |||||||
| 3 | 37.38/46 | |||||||
| 4 | 174.5.2/163 | |||||||
| 5 | 147.1.2/138 | |||||||
| 6 | 140.14/150 | |||||||
| Selected Circular and Pie RegionbbSpectra were extracted in the circular and pie regions defined in Figure 3c. | ||||||||
| A | 143.6/111 | |||||||
| B | 53.3/46 | |||||||
| C | 72.5/46 | |||||||
| B+C | 68.1/46 | |||||||
| D | 67.6/46 | |||||||
| E | 77.6/46 | |||||||
| F | 74.6/94 | |||||||