Observations of the 599 Hz Accreting X-ray Pulsar IGR J00291+5934 during the 2004 Outburst and in Quiescence
Abstract
We report on optical and near-infrared observations obtained during and after the 2004 December discovery outburst of the X-ray transient and accretion-powered millisecond pulsar IGR J00291+5934. Our observations monitored the evolution of the brightness and the spectral properties of IGR J00291+5934 during the outburst decay towards quiescence. We also present optical, near-infrared and Chandra observations obtained during true quiescence. Photometry of the field during outburst reveals an optical and near-infrared counterpart that brightened from to and from to . Spectral analysis of the broadband photometry shows excess in the near-infrared bands that may be due to synchrotron emission. The H emission line profile suggests the orbital inclination is . The preferred range for the reddening towards the source is , which is equivalent to cm-2 cm-2. The Chandra observations of the pulsar in its quiescent state gave an unabsorbed 0.5-10 keV flux for the best-fitting power-law model to the source spectrum of () ergs cm-2 s-1 (adopting a hydrogen column of cm-2). The fit resulted in a power-law photon index of . The color observed during quiescence supports an irradiated donor star and accretion disk. We estimate a distance of 2 to 4 kpc towards IGR J00291+5934 by using the outburst X-ray light curve and the estimated critical X-ray luminosity necessary to keep the outer parts of the accretion disk ionized. Using the quiescent X-ray luminosity and the spin period, we constrain the magnetic field of the neutron star to be Gauss.
1 INTRODUCTION
Most known pulsars are isolated neutron stars characterized by pulse (spin) periods of about 0.5 s that increase at a rate of s/s as the rotational kinetic energy is carried away by magnetic dipole radiation (see e.g. Lorimer 2005 and references therein). This implies young neutron stars with characteristic ages of years and a magnetic field strength of Gauss. However, a small fraction of this pulsar population has millisecond periods with rotation periods ranging from 1.5 to 30 ms and s/s. They are thought to be old neutron stars ( years) with magnetic fields of Gauss. Binary evolution theory predicts that millisecond pulsars are spun-up during mass transfer from the companion star onto the neutron star during the low-mass X-ray binary phase (see e.g. Alpar et al. 1982; Radhakrishnan & Srinivasan 1982; Bhattacharya & van den Heuvel 1991). This prediction agrees with the wealth of millisecond pulsars found in binary systems ( of the current sample compared to of the young pulsars). Additionally, eight low-mass X-ray binaries have been found (to date) to harbor an accretion-driven millisecond X-ray pulsar (see e.g. Wijnands 2005a). All eight were discovered as X-ray transients when they underwent an outburst caused by an episode of intense mass transfer onto the neutron star via an accretion disk.
The accretion-driven millisecond X-ray pulsar IGR J00291+5934 was first detected in outburst on 2004 December 2 during Galactic plane scans with INTEGRAL (Eckert et al. 2004). Reanalysis of the Rossi X-Ray Timing Explorer (RXTE) All-sky Monitor (ASM) data archive showed that the source was likely active during 1998 November and 2001 September, leading to a tentative recurrence time of approximately 3 years (Remillard 2004). Follow-up observations with the RXTE Proportional Counter Array (PCA) revealed that IGR J00291+5934 (hereinafter J00291) has a 147.4 min binary orbit and harbors a neutron star spinning at 599 Hz (1.7 ms). To date this is the fastest neutron star spin observed for an accretion-powered X-ray pulsar (Markwardt et al. 2004a,b).
Outburst spectra obtained by INTEGRAL and RXTE are consistent with an absorbed power-law, yielding a photon index of and a hydrogen column density of cm-2 (Shaw et a. 2005; Galloway et al. 2005). The INTEGRAL spectrum was also well fitted by a thermal Comptonization model with electron temperature of 50 keV and Thomson optical depth (Falanga et al. 2005; Shaw et al. 2005). In addition, the RXTE PCA data could be fitted with a two component model: an absorbed power-law and a thermal component with keV (Paizis et al. 2005), with the thermal component being interpreted as emission originating on a hot spot on the neutron star surface. Whereas the power-law photon index showed no evolution during the outburst decline (), the thermal component decreased to the point that it could not be constrained with the data acquired 10 days after the outburst onset. A simultaneous RXTE PCA/Chandra observation acquired on 2004 December 14 revealed a spectrum in accordance with a 0.4 keV thermal component (likely associated with emission from the accretion disk) and a power-law component with a similar index as above (Paizis et al. 2005). The PCA data also revealed that J00291 showed atypical behavior compared to other neutron star low-mass X-ray binaries during outburst: the power spectra showed broad-band flat-top noise with very low break frequencies (0.01-0.1 Hz) as well as the highest integrated fractional variability ( %) found to date in neutron star systems. These properties are more similar to those detected in low-hard states of black-hole systems than neutron star systems (Linares, van der Klis & Wijnands 2006). J00291 was observed during quiescence on three occasions with Chandra. The first observation was taken a month after its discovery; the second and third observations were taken 12 and 36 days after the initial Chandra observation. The analysis of the X-ray spectrum showed clear evidence of X-ray variability during quiescence (Jonker et al. 2005).
The optical and near-infrared counterparts to J00291 were identified with a and mag variable star (Fox & Kulkarni 2004; Steeghs et al. 2004) coincident with the reported radio counterpart (Pooley 2004, Fender 2004). The first spectrum of the optical counterpart indicated the presence of broad emission lines of Heii and H (Roelofs et al. 2004; see also Filippenko et al. 2004). A binary system with inclination degrees was supported by the lack of eclipses or dips in the X-ray light curve (Galloway et al. 2005). The donor star in J00291 is likely a hot (irradiated) brown dwarf and not a fully degenerate star given the orbital parameters of the system (Galloway et al. 2005, Falanga et al. 2005) and the presence of hydrogen emission lines in the optical spectrum (Roelofs et al. 2004).
The organization of the paper is as follows: we begin by describing in detail the data acquisition and reduction steps (Section 2). The whole outburst light curve from the monitoring campaign together with photometric observations during quiescence is presented in Section 3. In Section 4 we obtain constraints on the photometric variability of J00291 during outburst and quiescence and in Section 5 we derive a refined astrometric position for the source. The optical spectrum in outburst is analyzed in Section 6. In Section 7 we constrain the reddening towards J00291 and in Section 8 we obtain the optical to near-infrared spectral energy distribution during outburst. Section 9 presents a detailed analysis of a new Chandra observation of J00291 in quiescence. The results are discussed in section 10 where we examine key questions such as the orbital parameters and distance towards J00291. Our conclusions are summarized in Section 11.
2 OBSERVATIONS AND DATA REDUCTION
2.1 Optical Photometry
Optical photometry of J00291 was obtained with the following telescopes (see also Table 1):
-
•
The 1.2 m telescope at the Fred Lawrence Whipple Observatory (FLWO) in Arizona. The Minicam mosaic camera was in place and J00291 was imaged with the FLWO Harris -band filter, which closely approximates the Johnson-Cousins broad-band filter.
-
•
The 0.82 m IAC80 telescope at the Observatorio del Teide on Tenerife using the -band Johnson filter and the Thomson 1024 x 1024 pixel CCD camera.
-
•
The 4.2 m William Herschel Telescope (WHT) at the Observatorio del Roque de los Muchachos on La Palma using the Aux Port imager which carries a TEK CCD. The source was observed with the Harris and -band filters with filter transmissions similar to that of Cousins filters.
-
•
The 2.5 m Isaac Newton Telescope (INT) at La Palma using the Wide Field Camera (WFC), the four thinned EEV 2k4k CCDs and the Harris -band filter.
-
•
The 3.5 m Telescopio Nazionale Galileo (TNG) at La Palma. Cousins and -band filters were used to acquire images with the DoLoReS instrument equipped with a Loral CCD.
-
•
The MMT 6.5 m telescope at Mt. Hopkins. Data were obtained with the Sloan filter and the MegaCam CCD mosaic camera (McLeod et al. 2000).
-
•
The 4.2 m WHT using the Prime Focus Imaging Camera (PFIP) which carries two EEV CCDs. Time-resolved photometry of J00291 in quiescence was acquired in the (Harris) -band.
Integration times ranged from 100 s to 10 min depending on telescope size, atmospheric conditions and target brightness (see Table 1). The images were corrected for bias and flat–fielded in the standard way using iraf111iraf is distributed by the National Optical Astronomy Observatories.. We performed PSF-fitting photometry (Stetson 1987) on J00291 and several nearby comparison stars. We also performed a photometric calibration of a set of stars in the field of view of J00291 using several standard stars from Landolt plates (Landolt 1992) that were observed with the WHT, the 2.0m Liverpool telescope on La Palma and the FLWO 1.2 m telescope. The magnitudes for J00291 were obtained with differential photometry relative to these local comparison stars.
2.2 Optical Spectroscopy
Ten red and ten blue spectra were acquired on the night of 2004 December 5 using the ISIS double-arm spectrograph attached to the WHT telescope. J00291 was observed using a 1.5 arcsec wide entrance slit with the CCDs on each spectrograph arm binned by two in the spatial direction. The blue arm was used with the R600B grating and the EEV12 CCD array to yield an useful wavelength coverage of with a dispersion of 0.86 Å pix-1. The red arm was used with the R600R grating and the MARCONI2 CCD. The useful wavelength range covered the interval with a dispersion of 0.88 Å pix-1. The spectral resolution was about pixels FWHM for both arms.
The raw CCD frames were bias and flat-field corrected with standard iraf routines. The spectra were extracted from each frame with the iraf kpnoslit package. The pixel-to-wavelength calibration was derived from a cubic spline fit (blue spectrum) and a fifth order Legendre polynomial fit (red spectrum) to Copper-Argon and Copper-Neon arc lamp spectra taken at each CCD. The root-mean square () deviation of the fit was Å and Å for the data acquired with the blue and red arms respectively. No absolute flux calibration was attempted as the weather conditions were poor. The individual spectra were re-binned into a uniform velocity scale of 60.23 km s-1 pix-1 (blue) and 41.92 km s-1 pix-1 (red) to be rectified subsequently by fitting a spline function to the continuum after masking the emission lines.
2.3 Near-infrared photometry
Infrared photometry during the X-ray outburst was obtained from 2004 December 8 to 11 with the 1.3 m Peters Automated Infrared Imaging Telescope (PAIRITEL) at FLWO (Bloom et al. 2006). The camera on PAIRITEL consists of three NICMOS3 arrays which image simultaneously a field of view in the , and photometric bands. The observations consisted of a large number of dithered 7.8 s exposures on source. The dithered exposures were first bias and flat-field corrected to be mosaiced together for each individual visit (see e.g. Blake et al. 2005). Total integration times per visit ranged between 3 to 15 minutes. For each visit, instrumental magnitudes were extracted and consequently calibrated relative to the same nearby 2MASS sources for all exposures. Photometric error estimates on the infrared magnitudes are based on a combination of Poisson statistics and the error contribution of the comparison stars used for each observation.
J00291 was also observed on two nights with the 3.8m United Kingdom Infrared Telescope (UKIRT) on Mauna Kea. On December 28 the telescope was equipped with the UKIRT 1-5 micron Imager Spectrometer (UIST; Ramsay Howat et al. 2004). , and -band images were obtained on the InSb array. Observations consisting of a single 9 point jitter pattern with a 30s exposure at each offset position were performed using the K98 and J98 broad-band filters, giving a total of 4.5 min on source. The same pattern was used with exposures of 60s when using the J98 broad-band filter, yielding 9 min on source. The J98, H98 and K98 filters are the Mauna Kea Observatory NIR Photometric System filters (see Simons & Tokunaga 2002 and Tokunaga et al. 2002 for more details). -band observations were made on 2005 January 24 using the UKIRT Fast-Track Imager (UFTI; Roche et al. 2003) equipped with a HgCdTe array. The observations were obtained by jittering the image on 9 different positions. Exposures were 30s at each position and the jitter pattern was repeated six times yielding 27 minutes of total on-source observing time. The standard star FS103 from the set of UKIRT faint standards was observed for photometric calibration. During both nights a dark frame was obtained in each filter at the start of each set of observations. The data were reduced through the automated ORAC-DR pipeline222http://www.oracdr.org/ (Allan et al. 2002): the individual frames from each filter were bad-pixel masked, dark subtracted, flat-fielded (a flat-field was made using the target frames) and combined to form mosaics. Absolute calibration of the -band mosaic obtained with UFTI was performed with the standard star using a median extinction value of 0.088 mag airmass-1 at the Mauna Kea summit. The resulting absolute magnitudes for the 2MASS stars in the field differed by mag. The small discrepancy is consistent with the expected differences between magnitudes obtained by calibrating with 2MASS and UFTI standard stars (Hodking, Irwin & Hewett 2006; Nikolaev et al. 2000). J00291 was not detected in any of the UIST mosaic frames. These frames were calibrated using 2MASS stars in the field and 3- upper limits to the near-infrared magnitudes of the source were derived from aperture photometry made to the field stars.
Details of all the observations are summarized in Table 1.
2.4 X-ray data: Observations and reduction
We observed J00291 with the backside-illuminated ACIS-S3 CCD on board the Chandra satellite. The observation (ObsID 6570) started on 2005 November 24 09:49:44 UT. The total on-source time was 24671.5 s. We limited the read-out area of the S3-chip to 1/8th of its original size yielding a smaller exposure time per CCD frame in order to avoid pile-up. The data were reprocessed in a standard way using the ciao 3.3.0 software. We searched the data for periods of enhanced background radiation, but none were found. Hence, all the data were used in our analysis. Following Jonker et al. (2005), we extracted the spectrum of J00291 from a circular region with a 3 pixels radius centred on the best-fit source position as provided by wavdetect, whereas the background spectrum was extracted using an annulus centred on the source position with inner and outer radius of 10 and 30 pixels, respectively. We detect a total of 143 counts in the source region and 296 in the background region. This yields 0.3-10 keV background subtracted source count rates of () counts per second. This rate is so low that pile-up is negligible. The expected background count rate in the source region was % of the total counts in the source region.
3 The Outburst Light Curve
Fig. 1 presents the overall optical/infrared light curve. Each data point represents the mean magnitude per night at each respective band-pass. The discovery optical magnitude (; Fox & Kulkarni 2004) and the -band photometry reported in Biknaev et al. (2004) have also been included. Note that the follow-up of J00291 could not be continuous as it was hampered by poor weather conditions during the winter season in the Northern Hemisphere.
Our first images were taken on 2004 December 8, and showed the source at mag, mag, , and . We fitted an exponential to our first eight -band data points, which describes well the decline in brightness (the from the fit was 0.11 mag). From the fit we infer a rate of decline of d mag-1 and thereby an e-folding time of d in flux. Assuming the transient started to decay with the same trend after the outburst peak, the extrapolation of the exponential fit to the time of the discovery by INTEGRAL (Eckert et al. 2004, Shaw et al. 2005) yields a peak optical brightness of mag. Our -band coverage is not sufficient to determine the flux decay rate at near-infrared wavelengths.
In Fig. 2 we plot the -band magnitudes during the initial decay together with the RXTE PCA outburst light curve. A first account of the PCA light curve is given by Galloway et al. (2005) and Paizis et al. (2005). We digitized their data and plotted them on a logarithmic scale in Fig. 2. This figure shows that the X-ray light curve decays exponentially with an initial e-folding time of d. An exponential decay is expected to happen in short-orbital period binaries such as J00291 because the X-ray irradiation is strong enough to ionize the entire accretion disk (King & Ritter 1998; see also discussion). The decay becomes faster after 2004 December 10.2 when the e-folding time becomes d. INTEGRAL/ISGRI observations (10-100 keV) also show a change in the rate of decline in the light curve close to 2004 December 10, when the initial 6.6 d e-folding time decreases to 2.2 d (Falanga et al. 2005). The optical light curve does not show such a change until 2004 December 15, when there is indication of a steeper decline in the optical brightness. The optical data are consistent with a decay with rate d mag-1 (e-folding time of d).
On 2004 December 19, J00291 was found to be at mag and it is difficult to assess the light curve morphology due to the lack of coverage after that date. It is possible that the brightness decline slowed down or/and the source underwent mini-outbursts/re-flares in the optical before it reached quiescence. In this regard, the magnitudes reported by Bikmaev et al. (2005; open triangles in Fig. 1) together with our data seem to be consistent with what could have been an optical mini-outburst with amplitude mag starting about 2005 January 7 and lasting for about a week. At that time J00291 had definitely ceased its X-ray activity and settled down into quiescence at X-ray wavelengths (Jonker et al. 2005). The unreddened colour during the outburst decline was mag (2004 December 8), mag (2004 December 30) and mag (2005 January 7). We cannot draw any conclusion about the evolution of the color index given the large error bars, which were calculated by adding quadratically the uncertainties on the and -band photometry.
By the end of the possible optical mini-outburst and our outburst follow-up (2005 January 14), the optical magnitude had declined to . Ten days later, J00291 was imaged with UKIRT to derive a magnitude for its near-infrared counterpart in quiescence. Finally, we observed J00291 with the WHT on 2005 October 25/26 to measure a mean magnitude of for the optical counterpart in quiescence. This yields a total amplitude for the optical outburst of mag ( mag from the above extrapolation) and mag.
4 Photometric Variability
Time-resolved photometry of J00291 over the course of the outburst decline suggested significant variability on time scales of tenths of minutes to hours with amplitude mag (Bikmaev et al. 2005; Reynolds et al. 2005), but gave no indication of the orbital period. Our photometric data sets were also searched for short-term photometric variability when more than four data points per night were available. Quantifying the variability of J00291 requires care, since some of our data were acquired under variable weather conditions. We have dealt with this by carrying out photometry of field stars with similar brightness to J00291 or fainter in order to determine the significance of our photometry through the standard deviation on their magnitudes.
Seven images in the band-passes were made with PAIRITEL on 2004 December 10. The root-mean-square () of the J00291 magnitudes is mag, not different from the comparison stars in the field of view. Any flux variations of J00291 over the observing interval cannot be much greater than .
We obtained seven -band images during 2004 December 30 with the WHT and six -band images during 2005 January 7 with the TNG. We constrain the flux variation in J00291 to be and during the small fraction of the orbit covered during the observations (0.15 and 0.087 orbital cycles for the WHT and TNG respectively).
Time-resolved photometry of J00291 in quiescence was acquired on 2005 October 25 with the WHT. We obtained five 300s and twenty 600s -band frames. The deviation in the photometry over the 1.41 orbital cycles covered by the 600s images (the data with higher s/n ratio) is 0.25 mag, two times larger than the observed for two fainter comparison stars. The intrinsic flux variability of J00291 in the -band light curve is constrained to be by subtracting in quadrature the flux variation of the comparison stars from the variability observed in J00291. To examine the variability we used both PSF and optimal aperture techniques to determine the magnitudes which gave similar values. We do not see any evidence for orbital modulation in the photometric variability.
5 Astrometry
The position of J00291 was determined using the higher resolution images acquired at different epochs during the outburst decline. These were the images obtained with UKIRT/UFTI (pixel scale of 0.091 ′′/pix), WHT/Aux Port (0.237′′/pix), TNG/DoLoReS (0.551′′/pix) and MMT/MegaCam (0.160′′/pix). The transformation from pixel to sky coordinates was computed using the iraf tasks ccmap and cctran on 6 to 12 bright stars whose PSFs were not corrupted by CCD oversaturation effects. The positions for these internal astrometric reference stars were taken from 2MASS and they have an accuracy of (Skrutskie et al. 2006). The errors of the astrometric fit were 0.05′′ and 0.01′′ (UKIRT), 0.02′′ and 0.07′′ (WHT), 0.05′′ and 0.06′′ (TNG), and 0.06′′ and 0.07′′ (MMT) for right ascension and declination respectively. The error on the position of J00291 provided by the imcentroid task was always . Using the mean of the four measurements we determined a refined position for J00291 of (J2000)=00h29m03s.05 0s.01 and (J2000)=+59o34′18′′.93 0′′.05. The errors represent the of the measurements. The above value is in good agreement with the positions reported for the optical and X-ray counterparts (Fox & Kulkarni 2004; Paizis et al. 2004). It differs from the position for the radio counterpart (Rupen et al. 2004) by 3.2- in right ascension, corresponding to an angular offset between both positions of .
6 The Averaged Spectrum
As indicated in Fig. 1, our spectroscopic observations took place on 2004 December 5 during the initial decline of the outburst when the optical brightness was R= according to our exponential fit to the optical light curve (Section 3). The data cover 4.5 contiguous hours of spectroscopy representing 1.8 orbital cycles. The individual spectra have a signal-to-noise ratio (s/n) at 4500 Å and s/n at 6300 Å. We produced an average spectrum by assigning optimal weights to the individual spectra to maximize the s/n of the sum. Fig. 3 presents the weighted sum. The spectra show the presence of broad Balmer lines up to likely H in emission. The line profile for H is double-peaked. An F-test gives a probability % confidence that a double-Gaussian fit is better representation of the H profile than a single Gaussian fit. Due to the low s/n it is difficult to assess wheter or not the H and H profiles are double-peaked as well. The high-excitation Heii 4686 emission line is present, but we do not detect the Bowen blend (at ). In Table 2 we list the measured line profile parameters: the velocity shift of each line respect to the rest wavelength, the centroid of the line and the peak-to-peak separation (for H only), the FWHM, the full width zero intensity (FWZI) and the equivalent width (EW). The values reported are the mean of the measurements obtained by selecting different wavelength intervals to set the underlying continuum and the uncertainties correspond to the standard deviation. Table 2 shows that the emission line profiles are blue-shifted respect to their rest wavelength. This shift more likely reflects the systemic radial velocity (neutron star systems tend to have high systemic velocities; see e.g. White & van Paradijs 1996) and/or the presence of a precessing accretion disk (as observed in short-orbital period X-ray transients in outburst; see e.g. Torres et al. 2002, 2004 and references therein). H is the dominant emission line in the spectrum with a FWHM of km s-1 and EW= Å. The velocity separation of the peaks in the averaged profile is km s-1. Hei 5875 in emission seems to be detected. In this regard, Hei 6678 was reported from a single 300s spectrum obtained on 2004 December 12 (Filippenko et al. 2004) when the source brightness was . A visible inspection of this spectrum (see Fig. 1 in Reynolds et al. 2005) shows that Hei 5875,7065 emission lines were also present. We measured the EW and radial velocity of the individual H and Heii emission line profiles. Neither the EW nor the radial velocities showed significant modulation with the orbital motion.
The main interstellar features detected are the partially resolved atomic Na D doublet at (total EW of Å) and the Caii lines (EWs of Å and Å respectively). The spectra show also the presence of diffuse interstellar bands at (EW= Å), (EW= Å) and (EW= Å). The broad 6284 Å band profile is contaminated with telluric O2. Longward of Å, the spectra are also contaminated by telluric features.
7 Reddening towards J00291
Knowledge of the interstellar extinction is necessary in order to determine the distance to the source and its spectral energy distribution. can be estimated in a number of different ways. From its location in the Galaxy (, ), the expected color excess is mag according to the average Hi column () obtained by weighting the values within one degree along the line of sight to the source with the inverse of the distance from the source position ( cm-2; Dickey & Lockman 1990). Here we adopt cm-2 (Bohlin, Savage & Drake 1978). mag using the all-sky reddening maps based on far-infrared emission at 100 m and 240 m from dust (Schlegel, Finkbeiner & Davis 1998). Note that both radio and dust maps integrate along the whole line of sight through the Galaxy and that the reddening maps are expected to have reduced accuracy for . Fits to the X-ray spectra acquired with Chandra and RXTE during the X-ray outburst (Paizis et al. 2004) provided cm-2 (High Energy Transmission Grating Spectrometer spectrum - HETGS) and cm-2 (combined Chandra HETGS and RXTE PCA spectrum). These values imply a range of mag in extinction. Finally, a reddening of mag can be derived from the calibration between reddening and the EW for the 5780 diffuse interstellar band (Herbig 1993). Note that we use only this interstellar band as it shows a better correlation with reddening than the other diffuse interstellar bands in our spectrum (see Herbig 1975). Based on the above four independent results, we adopt ( cm-2 cm-2) as a likely range of the extinction by giving a lower weight to the result from the 5780 DIB, which is the least precise method for deriving the reddening given the uncertainties in the E(B-V)/EW relationship and the errors in the EW measured for this DIB. The lower limit on yields a dereddened color of (; Section 3), indicating a temperature of the order of 5000 K when assuming a thermal origin for the optical flux. This temperature is lower than the K temperatures expected in the outer parts of the accretion disk during outburst (see e.g. Hynes 2005) and suggests that is likely larger than 0.7 mag.
8 Spectrophotometric Energy Distribution during Outburst
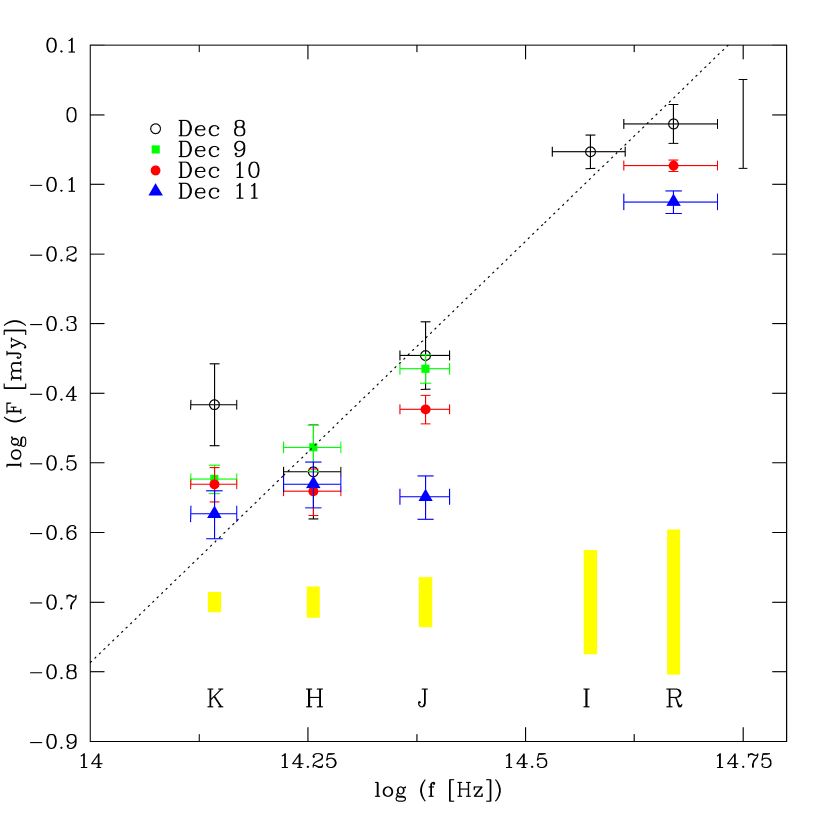
We acquired simultaneous -band images of J00291 with PAIRITEL during 2004 December 8 to 11. On December 8, 10 and 11 we also obtained -band photometry with the 1.2m at FLWO and observed the source in the -band on December 8. To create spectral energy distributions (SEDs), the optical and infrared magnitudes were dereddened using mag, mag, mag, mag and mag according to the Cardelli, Clayton & Mathis (1989) extinction law and assuming a reddening of 0.8 mag (as discussed in Section 7). Fluxes were calculated from the magnitudes using the flux calibrations and effective wavelengths specifications for each filter (Bessel 1990; Cohen, Wheaton & Megeath 2003). In Fig. 4 we plot the infrared to optical SED for three nights. We have also included the near-infrared data acquired on 2004 December 9 for comparison. The errors show the uncertainties in the photometry. The -band photometry was not simultaneous to the near-infrared observations and to account for this we have overplotted a bar representing the upper limit on the source variability at this bandpass ( mag; Section 4). The uncertainty in the reddening correction also contributes to the uncertainty in the SED. The error bars in the bottom of Fig. 4 account for the effect in the flux at each bandpass due to the mag uncertainty in the reddening.
In X-ray transients in outburst the continuum emission will fall gradually from optical to infrared wavelengths when the thermal spectrum of the X-ray and/or viscously heated accretion disk dominates the flux output at these wavelengths (see e.g. Beall et al. 1984, Vrtilek et al. 1990, Hynes 2005, Russell et al. 2006). Our SEDs show a break in the expected trend at infrared wavelengths where there is significant excess flux in the -band during the four nights and likely in the -band on December 11 as well. This supports the presence of another source of near-infrared flux in the spectrum. This source cannot be emission from the donor star as its contribution to the near-infrared flux is during outburst. This estimation is based on the -band magnitudes measured during outburst and in quiescence (Section 3). The near-infrared excess can be explained by invoking optically-thin synchrotron emission, which is expected to contribute to the SED with a component with spectral index (see Fender 2006 and references therein). This non-thermal component has been claimed to explain the excess of optical/near-infrared flux observed during the outburst of the accreting millisecond X-ray pulsars SAX J1808.4-3658 (=2 hr, Wang et al. 2001; Greenhill, Giles & Coutures 2006), XTE J0929-314 (= 43.6 min, Giles et al. 2005) and XTE J1814-338 (=4.3 hr, Krauss et al. 2005). The detection of mid-infrared optically-thin synchrotron emission from a jet in the neutron star 4U 0614+091 (Migliari et al. 2006) adds support to the above claim. For illustration purposes, we show in Fig. 4 a power-law fit () to the 2004 December 8 data performed after excluding the flux at the -band. It is clear that the fit is a poor description of the data: and furthermore we cannot exclude the very likely presence of flux excess at , -bands and shorter (optical) wavelengths due to the non-thermal (jet) component that will make the SED flatter (redder). The near-infrared unabsorbed flux measured on December 9 ( mJy at m, mJy at m and mJy at m) lies above the radio flux of mJy at a frequency of 4.86 GHz measured that day by Rupen et al. (2004; see also Fender et al. 2004). This suggests a spectrum with spectral index (), implying a flat or slightly inverted synchrotron optically thick spectrum.
9 X-ray Data: Analysis
A month after J00291 went into outburst a 4.7 ks Chandra ACIS-S observation detected the source at an unabsorbed flux of ergs cm-2 s-1 (0.5-10 keV). A serendipitous 18 ks observation by ROSAT obtained over 1992 July 26 - August 4 also showed J00291 at a similar flux level, confirming its return to quiescence within a month. Additional 9 ks and 12.9 ks Chandra observations obtained on 2005 January 13 and 2005 February 6 showed the source at an unabsorbed flux of ergs cm-2 s-1 and ergs cm-2 s-1, revealing that J00291 is variable in quiescence (see Jonker et al. 2005 for more details).
In this section, we analyze an additional 24.6 ks Chandra observation acquired on 2005 November 24. We performed a similar spectral analysis to that presented in Jonker et al. (2005) using xspec (v11.3; Arnaud 1996). We rebinned the source spectrum such that each bin contains at least 10 counts and used data in the energy range 0.5-10 keV. Due to the low number of source counts per bin, we also checked the spectral fitting results using the Cash statistic (Cash 1979), the results were consistent with those found using chi–squared fitting. For all spectral fits the hydrogen column density towards J00291 was held fixed at cm-2, a likely value of the hydrogen column density as derived in this paper (Section 7). Note also that the X-ray light curve shows no significant variability. A Kolmogorov-Smirnov test gives a probability of 25 % for the count rate of the source to be constant.
We began by fitting the spectrum using single component models: a power-law model, a neutron star atmosphere (NSA) model, and a black-body model. For the NSA model we fixed the neutron star magnetic field, its radius and mass at 0 Gauss, 10 km and 1.4 M⊙, respectively. The temperature and normalization were the only allowed free parameters. The results of these fits are shown in Table 3. As can be seen in Table 3, the single-thermal models did not provide an adequate fit to the data () and yield a temperature for J00291 considerably higher than the temperature observed for other neutron star X-ray transients in quiescence. We reject these models on this basis. A single power-law model was statistically acceptable with =1.2 for 11 degrees of freedom. In Fig. 5 we have plotted the spectrum showing the power-law fit. The absorbed 0.5-10 keV source flux from the best-fitting power-law model is () ergs cm-2 s-1, whereas the unabsorbed flux is () ergs cm-2 s-1. We also list in Table 3 the unabsorbed 0.5-10 keV flux derived from other models fit to the data. Note here that the X-ray spectrum of the transient millisecond X-ray pulsars SAX J1808.4-3658 (Campana et al. 2002) and XTE J0929-314 (Wijnands et al. 2005b) are also consistent with an absorbed power-law spectrum. The source flux from the best-fitting power-law model is consistent with the values found using previous Chandra and ROSAT observations of J00291 during quiescence (Jonker et al. 2005)333Note that Jonker et al. (2005) used cm-2 in their work. This value of was derived from preliminary analysis of a 18 ks Chandra observation acquired at the end of the X-ray outburst (Nowak et al. 2004) and it has been extensively used in the literature. In the present work, the power-law index and temperature model parameters obtained using cm-2 are consistent within the errors with those obtained using cm-2, whereas the unabsorbed flux is smaller. For comparison, the absorbed and unabsorbed fluxes are () ergs cm-2 s-1 and () ergs cm-2 when was frozen to cm-2 during the fit..
Several quiescent neutron star X-ray transients display a soft thermal component plus a hard power-law tail in their spectrum (see e.g. Campana et al. 1998). Our data do not require a two-component model. In order to obtain upper limits on the contribution to the total flux from a possible thermal component, we fitted the data with this model, consisting of a blackbody or NSA component and the power-law component, both of them modified by the effects of interstellar absorption. We fixed the best fit power law and used 0.2 keV ( K) for the blackbody (NSA) temperature as in Jonker et al. (2005). In this way we find a 95 per cent upper limit to the fraction of the 0.5-10 keV flux due to a thermal component of ().
10 DISCUSSION
10.1 The Outburst Light Curve: Comparison with other Sources
Fig. 2 shows that the X-ray light curve decays exponentially with a break or “knee” where the e-folding time becomes faster. A similar break has clearly been observed in the decay X-ray light curves of three other millisecond pulsars: SAX J1808.4-3658 (=2 hr; Wijnands & van der Klis 1998, Gilfanov et al. 1998, Wijnands 2005a and references therein), XTE J1751-305 (=42 min, Markwardt et al. 2002, Gierliński & Poutanen 2005) and XTE J0929-314 (=43.6 min; Giles et al. 2005, Powell, Haswell & Falanga 2006). In the three systems the break was from an exponential decay to a linear decay (see Powell et al. 2006). A break from a slow to a fast exponential decay has been observed in the light curves of the neutron star X-ray transients Aquila X-1 (=18.95 hr; Maitra & Bailyn 2004) and Centaurus X-4 (=15.1 hr; Evans, Belian & Conner 1970, Kaluzienski et al. 1980; Chen, Shrader & Livio 1997, Shahbaz et al. 1998). The initial exponential decay in the light curves of X-ray transients has been explained by assuming that the evolution of the mass in an irradiated disk is described as , where is the central mass accretion rate. Thus where is the initial mass of the irradiated disk. A faster decay phase (steeper light curve) is expected to occur when the central accretion rate (and thus the X-ray flux) has decreased below the critical X-ray luminosity necessary to keep the outer parts of the disk ionized. Then a cooling front (previously inhibited by X-ray irradiation) will move inwards the disk and switch off the outburst. The rate of decay in the light curve during the propagation of the cooling front has been observed to be either linear or exponential, sometimes showing departures due to one or more secondary maxima that appear during the outburst decline. Details on models for the understanding of the outburst light curves and the outbursts themselves can be found in King & Ritter (1998); Dubus, Hameury & Lasota (2001); Lasota (2001) and Powell et al. (2006).
The ratio of the optical exponential decay time to the X-ray exponential decay time () is expected to be for X-ray transients when the optical flux is dominated by X-ray reprocessing on the disk (King & Ritter 1998). Observational evidence supporting this prediction is that in X-ray novae (Chen et al. 1997). This ratio is before the knee in the X-ray light curve of J00291. Apart from J00291, SAX J1808.4-3658 is the only millisecond pulsar for which well-sampled optical and X-ray light curves are available (1998 outburst). For this system we derive444 d and d. These values were obtained using the photometric data from Table 1 in Wang et al. (2001). Only data until MJD 50932.7 were used. d (Powell et al. 2006). . The fact that the decay in the optical light curve of J00291 is faster than observed in X-ray irradiated systems suggests that X-ray heating is insufficient to be the dominant source of optical emission and that viscous dissipation in the disk may make a significant contribution to the optical flux. For instance, the optical light curves of dwarf novae in outburst follow the soft X-rays after the outburst peak () to decline slower than the X-rays a few days later (Jones & Watson 1992, Mauche, Mattei & Bateson 2001, Wheatley, Mauche & Mattei 2003).
The knee in the optical light curve of J00291 is delayed d with respect to the knee in the X-ray light curve (Fig. 2). A delay of d was observed in SAX J1808.4-3658 (Wang et al. 2001). After the knee, the optical and X-ray light curves of J00291 decay faster with a similar e-folding time, . This was not the case during the 1998 outburst of SAX J1808.4-3658, when the flux at optical wavelengths reached a plateau that lasted one month (Wang et al. 2001). The optical decay in J00291 ( d mag-1; Section 3) is slower than the d mag-1 rate predicted by the relationship for dwarf novae (non-magnetic CVs) between the rate of the decay and the orbital period (Bailey 1975). This is given by Smak (1999) as . In order to use it we have assumed during the decline of J00291. It is interesting to note that a few intermediate polars (CVs where the accretion disk is disrupted by the magnetic field of the white dwarf as expected in millisecond pulsars) have shown dwarf-nova like outbursts which decay faster than the Bailey’s relationship. Examples of these are DO Dra (=3.96 hr, imon 2000) and HT Cam (=1.35 hr, Ishioka 2002). In summary, J00291 seems to show during the late decline a longer decay time compared to dwarf novae as has been observed in other X-ray transients. For instance, the optical flux of the neutron star transient XTE J2123-058 (=5.96 hr) decayed with a rate of d mag-1 in the -band and d mag-1 in the -band at the end of the 2000 outburst (Soria, Wu & Galloway 1999, see also Zurita et al. 2000).
10.2 The nature of the donor star
The lack of eclipses or dips in the outburst X-ray light curve imply an inclination . This limit combined with the mass function derived from X-ray data ( M⊙; Galloway et al. 2005) implies a donor star mass M (0.05) M⊙ for assumed neutron star mass M1 of 1.4 (2.0) M⊙. Assuming that the inclination of J00291 is drawn from an isotropic distribution of inclination angles, using the mass function and applying the requirement that the companion fits within its Roche lobe lead to the expectation that the donor star is a M⊙ (95 % confidence) low-mass star, most likely a brown dwarf bloated by the pulsar X-ray emission (Galloway et al. 2005).
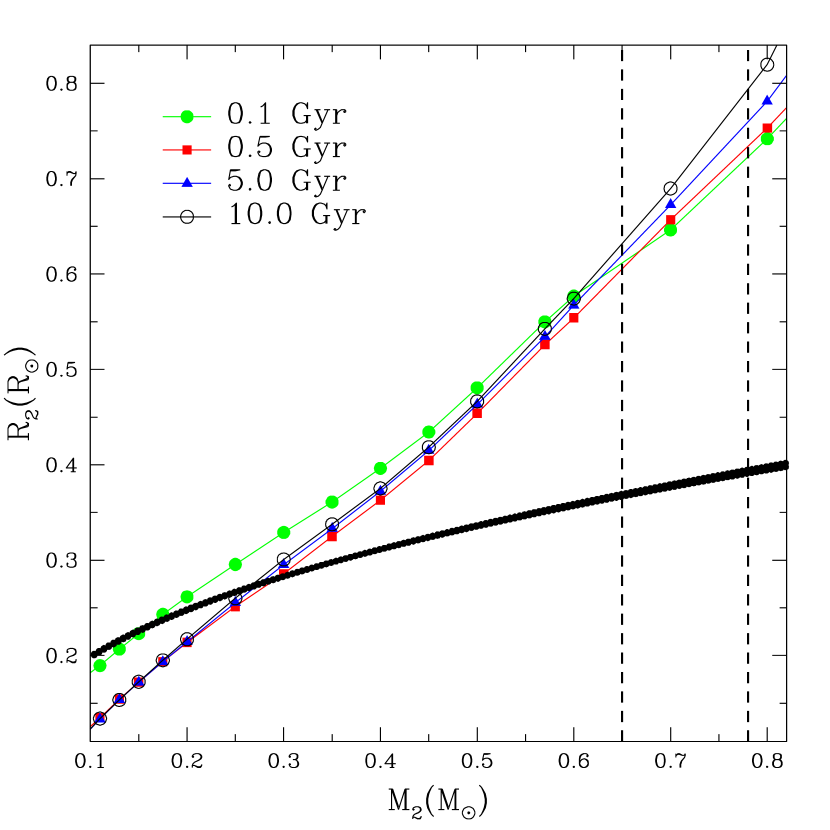
We can use the peak-to-peak separation in the H emission profile ( km s-1) to estimate the inclination of the system by assuming that the peaks in the averaged profile represent emission from gas orbiting in the outer radius of the disk with a Keplerian motion. In such a case with being the outer disk radius. We take to be between the tidal radius (at which the tidal forces of the donor star cut the disk off) and the radius of the 3:1 Lindblad resonance radius (at which orbits in the disk resonate with the donor-star orbit, driving the disk elliptical). where is the volume radius of the Roche lobe of the compact star, where and is the separation between both stellar components (see e.g. Whitehurst & King 1991). The orbital parameters measured for J00291 allow us to estimate as a function of the mass for the stellar components and (Eggleton 1983). Using Kepler’s third law together with the constraints on the donor and neutron star mass we obtain and . From and we estimate a system inclination of . This range of inclinations implies a donor star with mass M M⊙ for a M1=1.4 (2.0) M⊙ neutron star when using the mass function of the pulsar derived from X-ray data.
Similarly, an upper limit to the inner radius of the H-emitting regions during outburst () can be obtained by assuming Keplerian motion for the gas. From the maximum velocity extent of the H line profile ( km s-1) we derive cm. This is times the corotation radius ( cm, where is the neutron star spin period.
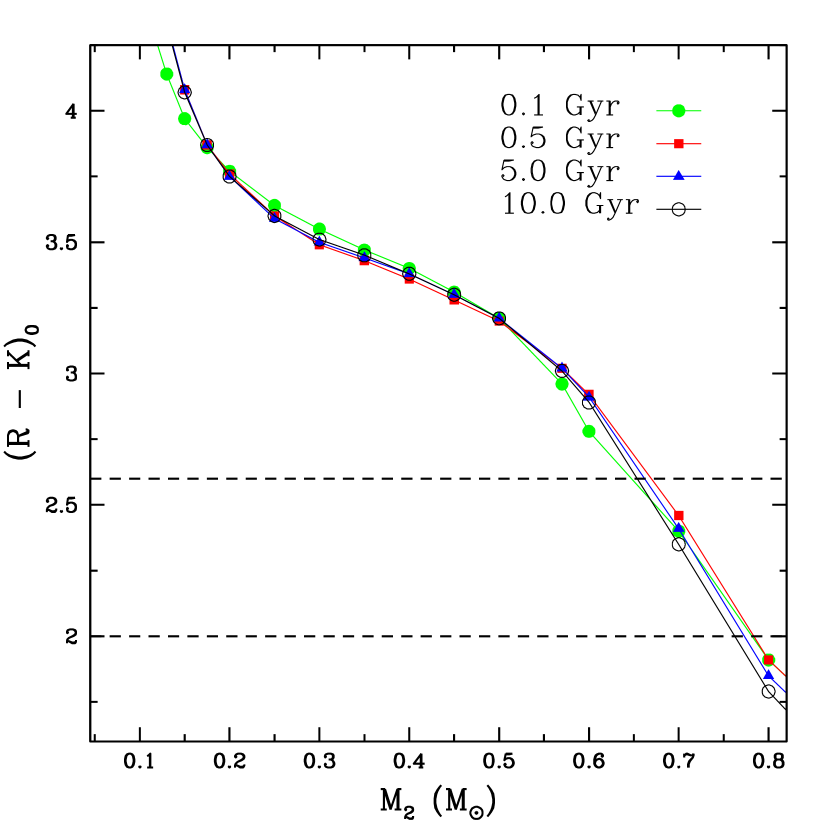
From our photometry during quiescence we find mag, which corrected from extinction corresponds to an unabsorbed color of mag. We plot in Fig. 6 the theoretical mass- color tracks for low-mass stars with solar metallicity and ages of 0.1 to 10 Gyr (Baraffe et al. 1998). The Gigayear tracks intersect the mass vs diagram at . For these masses the inclination derived using the mass function is which is highly unlikely given the FWHM and the double-peaked profiles of the emission lines, and the fact that the donor star will be much larger than its Roche lobe (Fig. 6). This discrepancy can be explained if the donor star and accretion disk are irradiated by a relativistic particle wind from the pulsar which resumes activity during quiescence (see e.g. Campana et al. 2004) or by residual accretion onto the neutron star suface and by thermal X-ray emission from the pulsar surface which is heated during outbursts (see e.g. Bildsten & Chakrabarty 2001).
10.3 The distance towards J00291
Different methods have been used to constrain the distance. First, Galloway et al. (2005) estimated a lower limit of kpc by assuming that the 2004 outburst fluence is typical for the system and that the mass transfer rate is driven by gravitational radiation. These authors suggested that the distance cannot be much larger based on the fact that thermonuclear bursts were not detected during the outburst event. Secondly, Jonker et al. (2005) derived a distance of kpc by assuming that the quiescent X-ray luminosity of J00291 is similar to that measured for the millisecond pulsars SAX J1808.4-3658 and XTE J0929-314 in quiescence. Using SAX J1808.4-3658 alone (for which kpc, Galloway & Cumming 2006) and the unabsorbed flux of J00291 during quiescence measured in Section 8, we roughly estimate the distance towards J00291 to be kpc.
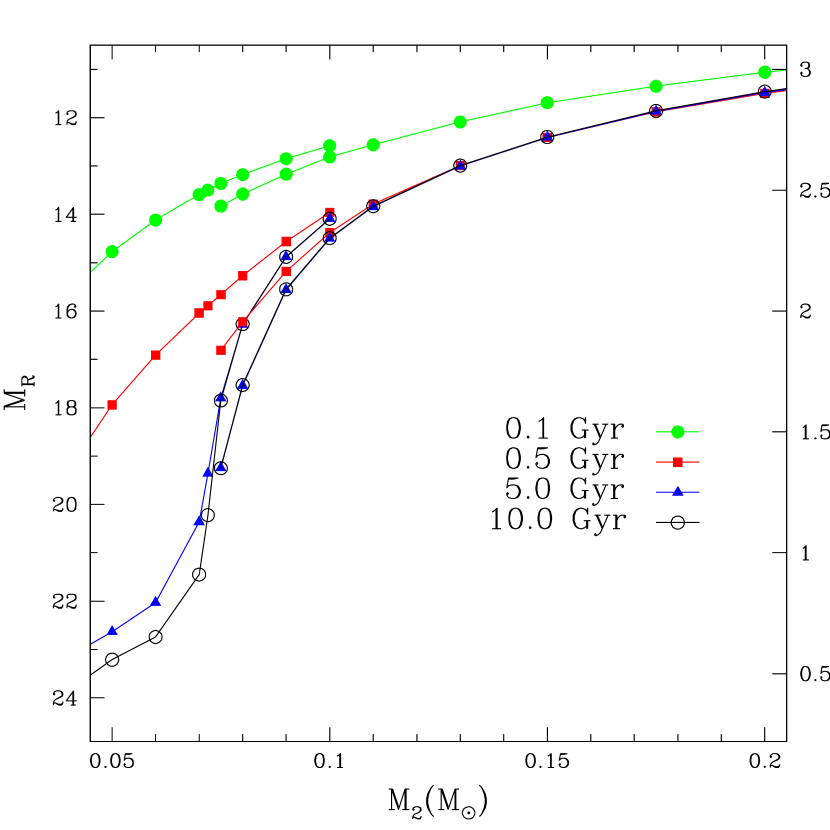
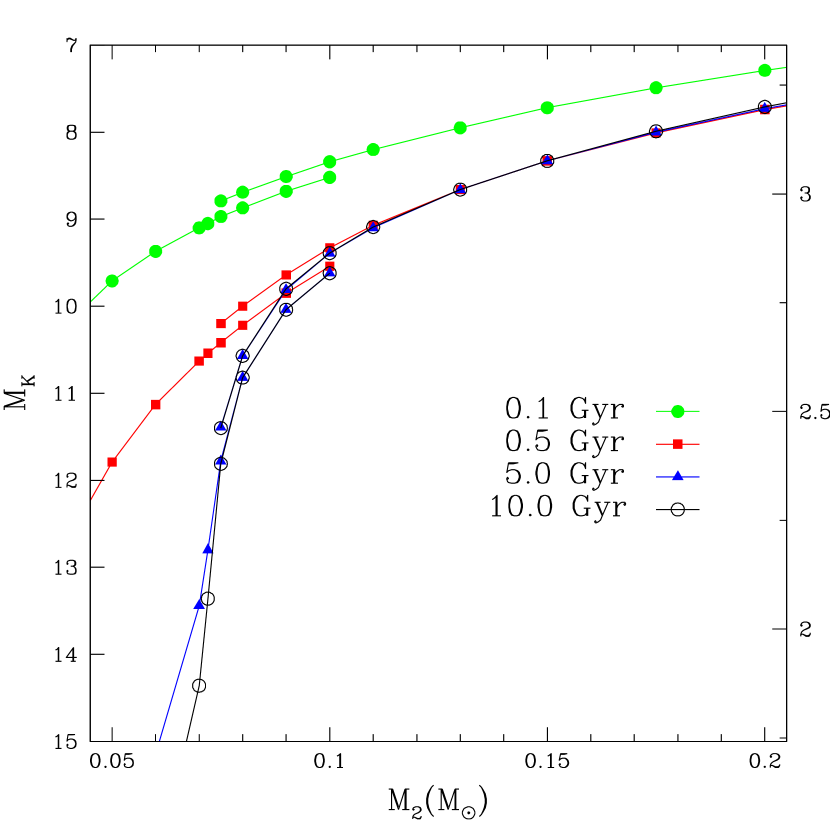
The distance to J00291 can also be constrained using the critical X-ray luminosity necessary in a neutron-star X-ray transient to heat the disk and produce an exponential decay light curve. We can estimate the distance to J00291 by assuming that the X-ray irradiation was until the knee high enough to ionize the whole disk. Shahbaz et al. (1998) following King & Ritter (1998) derived expressions for the critical X-ray luminosity necessary to keep the disk ionized everywhere. For a neutron star system they found ergs s-1 where is the ionized disk radius in units of cm. The disk radius will be between and the circularization radius as most of the disk mass will be accreted during the outburst event. The circularization radius is given by (see e.g. Frank et al. 1992) where is the distance between the center of the compact object and the inner Lagrangian point for the donor star. can be approximated in function of (see e.g. Warner et al. 1995). Using our constraints on and we obtain . From and we estimate ergs s-1 and from our fit to the X-ray light curve we derive an unabsorbed X-ray flux of ergs cm-2 s-1 at the time of the knee. Combining both results we find a distance of 1.8 to 3.8 kpc, in line with previous estimates by Jonker et al. (2005). Taking the apparent - and -band magnitudes during quiescence (Section 3) and the reddening at these band passes (Section 8), we derive from the distance module and . These are lower limits to the distance towards J00291 as both donor star and disk are irradiated by the pulsar. In Fig. 7 we show the predicted mass-absolute magnitude diagram for low-mass stars with ages of 0.1 to 10 Gyr and the mass-distance diagram derived from the distance module.
10.4 Constraints on the neutron star magnetic field
Following Burderi et al. (2002) and Di Salvo & Burderi (2003), we can place constraints on the neutron star magnetic momentum and thereby the magnetic field strength by comparing the X-ray luminosity measured in quiescence with the expected X-ray luminosity due to residual accretion onto the neutron star or magnetic dipole radiation. The X-ray luminosity originating in these processes depends on both the pulsar spin frequency and (see Burderi et al. 2002). Thermal emission from the neutron star may also contribute to the quiescent X-ray emission (section 9) and therefore these constraints represent upper limits only. The spin period of the pulsar in J00291 is 1.67 ms (Galloway et al. 2005). The 0.5-10 KeV quiescent X-ray luminosity is ergs s-1 (range due to our uncertainty in the distance). Considering the above processes and using the equations derived in Di Salvo & Burderi (2003), the neutron star magnetic field is most likely less than Gauss (a neutron star with mass 1.4 M⊙ and a radius 10 km was adopted). For comparison, the magnetic field of the neutron stars in the millisecond pulsars SAX J1808.4-3658 ( ms), XTE J1751-305 ( ms) and XTE J0929-314 ( ms) are constrained to be Gauss, (d/10 kpc) Gauss and (d/8 kpc) Gauss respectively (Di Salvo & Burderi 20003, Wijnands et al. 2005b).
11 CONCLUSIONS
In this paper we have presented multiwavelength observations of the millisecond pulsar IGR J00291+5934. The best source position derived from the optical and near-infrared images is (J2000)=00h29m03s.05 0s.01 and (J2000)=+59o34′18′′.93 0′′.05. From the spectral analysis of our broadband photometry we found strong evidence for excess in the near-infrared bands that may be due to synchrotron emission. We find that the most likely range for the reddening towards J00291 is ( cm-2 cm-2). The X-ray spectrum of the source is well-fitted with a power-law model with photon index . The unabsorbed quiescent 0.5-10 keV flux is () ergs cm-2 s-1 for cm-2. At least 81 % of the flux in the 0.5-10 keV range is due to this model. The color index observed during quiescence supports an irradiated low-mass donor star and accretion disk contribution. We estimate an inclination of based on the H emission line profile and we constrain the distance towards J00291 from 2 to 4 kpc. The magnetic field of the neutron star is most likely Gauss.
In contrast with the longer recurrence times for X-ray novae, several millisecond pulsars undergo outbursts in an interval of a few years. This fact opens the opportunity of obtaining a large sample of multiwavelength outburst light curves for these X-ray sources, making possible a future statistical analyses of their light curves as it has been done for the dwarf novae outbursts. The outburst light curves of millisecond pulsars may clarify the role that X-ray irradiation plays in the framework of the thermal instability model both for neutron star and black hole X-ray transients. Finally, the monitoring of an outburst should span a large spectral range to allow us to understand the emission mechanisms in these systems.
References
- (1) Allan, A., Jenness, T., Economou, F., Currie, M. J, & Bly, M. 2002, Astronomical Data Analysis Software and Systems XI, ASP Conference Proceedings, Vol. 281, eds. D. A. Bohlender, D. Durand, & T. H. Handley (San Francisco:ASP), 311
- (2) Alpar, M. A., Cheng, A. F., Ruderman, M. A., Shaham, J. 1982, Nature, 300, 728
- (3) Bailey, J. 1975, Brit. astr. Ass., 86, 30
- (4) Baraffe, I., Chabrier, G., Allard, F., Hauschildt, P. H. 1998, A&A, 337, 403
- (5) Baraffe, I., Chabrier, G., Barman, T. S., Allard, F., Hauschildt, P. H. 2003, A&A, 402, 701
- (6) Beall, J. H., Knight, F. K., Smith, H. A., Wood, K. S., Lebofsky, M., Rieke, G. 1984, ApJ, 284, 745
- (7) Bessell, M. S. 1990, PASP, 102, 1181
- (8) Bhattacharya, D. & van den Heuvel, E. P. J. 1991, PhR, 203, 1
- (9) Bikmaev, J. et al. 2004, ATel 395
- (10) Bildsten, L. & Chakrabarty D. 2001, ApJ, 557, 292
- (11) Blake, C. E. et al. 2005, Nature, 435, 181
- (12) Bloom J. S., Starr D. L., Blake C. H., Skrutskie M. F., Falco E. E. 2006, in Astronomical Data Analysis Software and Systems XV, ASP Conference Series, Vol. 351, C. Gabriel, C. Arviset, D. Ponz and E. Solano, eds.
- (13) Bohlin, R. C., Savage, B. D. & Drake, J. F. 1978, ApJ, 224, 132
- (14) Burderi et al. 2002, ApJ, 574, 930
- (15) Campana, S., Colpi M., Mereghetti, S., Stella, L., Tavani, M. 1998, A&ARv, 8, 279
- (16) Campana et al. 2002, ApJ, 575, 15
- (17) Campana et al. 2004, ApJ, 614, 49
- (18) Campana, S., Ferrari, N., Stella, L., Israel, G. L. 2005, A&A, 434, 9
- (19) Cardelli, J. A., Clayton, G. C., Mathis, J. S. 1989, ApJ, 345, 245
- (20) Cash W. 1979, ApJ, 228, 939
- (21) Cohen, M., Wheaton, WM. A., Megeath, S. T. 2003, AJ, 126, 1090
- (22) Chabrier, G., Baraffe, I., Allard, F., Hauschildt, P. 2000, ApJ, 542, 464
- (23) Chen, W., Shrader, C. R., Livio, M. 1997, ApJ, 491, 312
- (24) Di Salvo, T. & Burderi, L. 2003, A&A, 397, 723.
- Dickey & Lockman (1990) Dickey, J. M., & Lockman, F. J. 1990, ARA&A, 28, 215
- (26) Dubus, G., Hameury, J.-M., Lasota, J.-P. 2001, A&A, 373, 251
- (27) Eckert et al. 2004, ATel 352
- (28) Eggleton, P. P. 1983, ApJ, 268, 368
- (29) Evans, W. D., Belian, R. D. & Conner, J. P. 1970, ApJ, 159, L57
- (30) Falanga et al.. 2005, A&A, 444, 15
- (31) Fender, R., De Bruyn, G., Pooley, G., Stappers, B. 2004, ATel 361
- (32) Fender, R. 2006, in Compact Stellar X-ray Sources , eds. W. H. G. Lewin and M. van der Klis, in press (astro-ph/0303339)
- (33) Filippenko, A. V., Foley, R. J. & Callanan, P. J. 2004. ATel 366
- (34) Fox, D. B. & Kulkarni, S. R. 2004, ATel 354
- (35) Frank, J., King, A. & Raine, D. 1992, Accretion Power in Astrophysics (Cambridge: Cambridge Univ. Press)
- (36) Galloway, D. K., Markwardt, C. B., Morgan, E. H., Chakrabarty, D. & Strohmayer, T. E. 2005, ApJ, 622, L45
- (37) Galloway, D. K., Cumming, A. 2006, ApJ, 652, 559
- (38) Gierliński, M. &. Poutanen, J. 2005, MNRAS, 359, 126
- (39) Giles, A. B., Greenhill, J. G., Hill, K. M., Sanders, E. 2005, MNRAS, 361, 1180
- (40) Gilfanov, M., Revnivtsev, M., Sunyaev, R., Churazov, E. 1998, A&A, 338, L83
- (41) Greenhill, J. G., Giles, A. B. Coutures, C. 2006, MNRAS, 370, 1303
- (42) Herbig, G. H. 1975, ApJ, 196, 129
- (43) Herbig, G. H. 1993, ApJ, 407, 142
- (44) Hodkin, S., Irwin, M. & Hewett, P. 2006, CASU WFCAM/VISTA documentation. No VDF-TRE-IOA-00011-00001
- (45) Hynes, R. 2005, ApJ, 623.1026
- (46) Ishioka, R., Kato T., Uemura, M., Billings G. W., Morikawa K., Torii K., Tanabe K., Oksanen A., Hyv nen H., Itoh H. 2002, PASJ, 54, 5811
- (47) Jones, M. H. & Watson, M. G. 1992, MNRAS, 257, 663
- (48) Jonker, P. G., Wijnands, R., van der Klis, M. 2004, MNRAS, 349, 94
- (49) Jonker, P. G., Campana, S., Steeghs, D., Torres, M. A. P., Galloway, K. K., Markwardt, C. B. & Chakrabarty, D. 2005, MNRAS, 361, 511
- (50) Jonker P. G., Galloway D. K., McClintock J. E., Buxton M., Garcia M., Murray S. 2004, MNRAS, 354, 666
- (51) Kaluzienski, L. J., Holt, S. S., Swank, J. H. 1980, ApJ, 241, 779
- (52) King A., & Ritter, H. 1998, MNRAS, 293, 42
- (53) Krauss et al. 2005, ApJ, 627, 910
- Landolt (1992) Landolt, A. U. 1992, AJ, 104, 340
- (55) Lasota, J.-P. 2001, NewA Rew, 45, 449
- (56) Linares, M., van der Klis, M., Wijnands, R. 2007, ApJ, 660, 595
- Lorimer (2005) Lorimer, D. R. 2005, Living Reviews in Relativity, vol. 8, no 7
- (58) Maitra, D. & Bailyn, C. 2004, ApJ, 608, 444
- (59) Markwardt, C. B., Swank J. H., Strohmayer, T. E., Zand, J. J. M int, Marshall, F. E. 2002, ApJ, 575, 21
- (60) Markwardt, C. B., Swank, J. H. & Strohmayer, T. E. 2004a. ATel 353
- (61) Markwardt, C. B., Galloway, D. K., Chakrabarty, D., Morgan, E. H. & Strohmayer, T. E. 2004b. ATel 360
- (62) Mauche, C. W., Mattei, J. A., Bateson, F. M. 2001, ASP Conf. Ser. 229, in Evolution of Binary and Multiple Stars, ed. P. Podsiadlowski et al. (San Francisco: ASP), 367
- (63) McLeod, B. A., Conroy, M., Gauron, T. M., Geary, J. C., & Ordway, M. P. 2000. Further Developments in Scientific Optical Imaging, 11
- (64) Migliari, S., Tomsick, J. A., Maccarone, T. J., Gallo, E., Fender, R. P., Nelemans, G., Russell, D. M. 2006, ApJ, 643, 41
- (65) Nikolaev, S., Weinberg, M. D., Skrutskie, M. F., Cutri, R. M., Wheelock, S. L., Gizis, J. E., Howard, E. M. 2000, AJ, 120, 3340
- (66) Nowak et al. 2004, ATel 369
- (67) Paizis, A., Nowak, M. A., Wilms, J., Courvoisier, T. J-L., Ebisawa, K., Rodriguez, J. & Ubertini, P. 2005, A&A, 444, 357
- (68) Pooley, G. 2004, ATel 355
- (69) Powell, C. R., Haswell, C. A., Falanga, M. 2006, MNRAS, 374, 466
- (70) Radhakrishnan, V. & Srinivasan, G. 1982, Curr. Sci., 51, 1096
- (71) Ramsay Howatt, S. K et al. 2004, in Proc Spie 5492, UV and Gamma-Ray Space Telescope Systems, eds. Hasinger G, Turner M.J., p.1160
- (72) Remillard, R. 2004, ATel 357
- (73) Reynolds, M. T. et al. 2006, in Populations of High Energy Sources in Galaxies. Proceedings of the 230th Symposium of the IAU, ed. E. J. A. Meurs, G. Fabbiano, Cambrdige: Cambridge University Press. 230, 80
- (74) Roche, P.F. et al. 2003, Proc Spie 4841, Instrument Design and Performance for Optical/IR Ground-Based Telescopes, eds. M Iye and A.F Moorwood)
- (75) Roelofs, G., Jonker, P. G., Steeghs, D., Torres, M. & Nelemans, G. 2004, ATel 356
- (76) Rupen, M. P., Dhawan, V., Mioduszewski, A. J. 2004, ATel 364
- (77) Russell, D. M., Fender, R. P., Hynes, R. I., Brocksopp, C., Homan, J., Jonker, P. G., Buxton, M. M. 2006, MNRAS, 371, 1334
- (78) Schlegel, D. J., Finkbeiner, D. P., Davis, M. 1998, ApJ, 500, 525
- (79) Shahbaz, T., Charles, P. A., King, A. R. 1998, MNRAS, 301, 382
- (80) Shaw, S. E., Mowlavi, N., Rodriguez, J. et al. 2005, A&A, 432, L13
- (81) Simons, D. A. & Tokunaga, A. 2002, PASP, 114, 169
- (82) imon, V. 2000, A&A, 360, 627
- (83) Skrutskie, M. F. et al. 2006, AJ, 131, 1163
- (84) Smak, J. 1999, AcA, 49, 391
- (85) Soria, R., Wu, K., Galloway, D. K. 1999, MNRAS, 309, 528
- (86) Steeghs, D., Blake, C., Bloom, J. S., Torres, M. A. P., Jonker, P. G., Starr, D. 2004, ATel 363
- (87) Stetson, P. B. 1987, PASP, 99, 191
- (88) Tokunaga, A. T., Simos, D. A. & Vacca, W. D. 2002, PASP, 114, 180
- (89) Torres et al. 2002, ApJ, 569, 423
- (90) Torres et al. 2004, ApJ, 612, 1026
- (91) Vrtilek, S. D., Raymond, J. C., Garcia, M. R., Verbunt, F., Hasinger, G., Kurster, M. 1990, A&A, 235, 162
- (92) Wang et al. 2001, ApJ, 563, L61
- (93) Warner, B. 1995 in Cataclysmic Variable Stars, (Cambridge University Press: Cambridge)
- (94) Wheatley, P. J., Mauche, C. W., Mattei, J. A. 2003, MNRAS, 345, 49
- (95) White, N. E. & van Paradijs, J. 1996, ApJ, 473, 25
- (96) Whitehurst, R. & King, A. 1991, MNRAS, 249, 25
- (97) Wijnands, R. & van der Klis, M. 1998, ApJ, 507, 63
- (98) Wijnands, R., Homan, J., Heinke, C. O., Miller, J. M., Lewin, W. H. G. 2005b, ApJ, 619, 492
- (99) Wijnands, R., Homan, J., Miller, J. M., Lewin, W. H. G. 2005, ApJ, 606, 61
- (100) Wijnands, R. 2005a, in Pulsars New Research (NY: Nova Science Publishers), in press, astro-ph/0501264
- (101) Zurita, C., Casares, J., Shahbaz, T., Charles, P. A., Hynes, R. I., Shugarov, S., Goransky, V., Pavlenko, E. P., Kuznetsova, Y. 2000, MNRAS, 316, 137
- (102) Zurita, C. et al. 2002, MNRAS, 334, 999


| Date | HJD start–end | Telescope | Bandpass/ | No. | Exp. time | seeing |
| (UT) | (+2,453,000.) | Spectral range (Å) | Images/Spectra | (s) | (arcsec) | |
| OUTBURST | ||||||
| 04 Dec 5 | 345.39379-345.58101 | WHT | 3500-5200 | 10 | 830-1500 | |
| ,, | ,, | 5400-7100 | 10 | ,, | ,, | |
| 04 Dec 8 | 347.50266-347.51439 | IAC80 | R | 3 | 300 | 2.1 |
| 347.75290-347.76292 | 1.2m | R,I | 2,2 | 60,60 | 3.2,3.7 | |
| 347.71597-347.72639 | PAIRITEL | J,H,K | 1 | 439 | ||
| 04 ,, 9 | 348.56496-348.63947 | PAIRITEL | ,, | 3 | 188,424,926 | 2.7 |
| 04 ,, 10 | 349.60736-349.62958 | 1.2m | R | 4 | 300 | 2.4 |
| 349.55555-349.69166 | PAIRITEL | J,H,K | 7 | 267-463 | 2.7 | |
| 04 ,, 11 | 350.62887-350.63983 | 1.2m | R | 3 | 300 | 2.6 |
| 350.55347-350.56666 | PAIRITEL | J,H,K | 1 | 392 | ||
| 04 ,, 12 | 351.61066-351.62334 | 1.2m | R | 3 | 300 | 2.3 |
| 04 ,, 13 | 352.74011-352.75118 | 1.2m | ,, | ,, | ,, | 2.0 |
| 04 ,, 14 | 353.62542-353.63682 | 1.2m | ,, | ,, | ,, | 3.0 |
| 04 ,, 15 | 354.68723-354.69858 | 1.2m | ,, | ,, | ,, | 2.5 |
| 04 ,, 16 | 355.59923-355.61018 | 1.2m | ,, | ,, | ,, | 2.8 |
| 04 ,, 18 | 358.32018-358.32590 | INT | R | 3 | 120 | 2.0 |
| 04 ,, 28 | 367.68095-367.69778 | UKIRT | J,H,K | 1 | 270,270,540 | 1.4,1.2,1.1 |
| 04 ,, 30 | 370.32417-370.34623 | WHT | R,I | 7,3 | 180 | 1.2,1.3 |
| 05 Jan 7 | 378.45825-378.46899 | TNG | R,I | 6,2 | 100 | 1.5,1.3 |
| 05 ,, 14 | 384.57788-384.59612 | MMT | 3 | 300 | 1.0 | |
| QUIESCENCE | ||||||
| 05 ,, 24 | 394.68693-394.71399 | UKIRT | K | 1 | 1620 | 0.7 |
| 05 Oct 25 | 669.32713-669.51805 | WHT | R | 5,20 | 300,600 | 1.4,1.2 |
| 05 Nov 24 | 698.90954-699.19509 | Chandra | 0.3-10 keV | 1 | 24672 | N/A |
| Emission lines | (Vb+Vr)/2 | VVb | FWHM | FWZI | EW | |
|---|---|---|---|---|---|---|
| (km s-1) | (km s-1) | (km s-1) | (Å) | (Å) | (Å) | |
| H | ||||||
| H | — | — | ||||
| Heii | aaAfter masking the emission spike on top of the line profile. | — | — | |||
| H | — | — | ||||
| H | — | — |
| Model | Temp./PL index | Unabsorbed 0.5-10 keV fluxes | (d.o.f) | n.h.p |
|---|---|---|---|---|
| BB(keV), NSA () | (10-14 ergs cm-2 s-1) | (per cent) | ||
| BB | 3.8 | 3.4 (11) | 0.01 | |
| NSA | 3.9 | 3.2 (11) | 0.02 | |
| PL | 7.0 | 1.2 (11) | 28 |