Internal Properties of Ultra-Compact Dwarf Galaxies
in the Virgo Cluster
Abstract
We present new imaging and spectroscopic observations of six ultra-compact dwarf (UCD) galaxies in the Virgo Cluster, along with re-analysed data for five Fornax Cluster UCDs. These are the most luminous UCDs: mag. Our Hubble Space Telescope imaging shows that most of the UCDs have shallow or steep cusps in their cores; only one UCD has a flat “King” core. None of the UCDs show tidal cutoffs down to our limiting surface brightness. Spectroscopic analysis shows that Virgo UCDs are old (older than 8 Gyr) and have metallicities in the range from [Z/H] = -1.35 to +0.35 dex. Five Virgo UCDs have super-solar [/Fe] abundance ratios and one Virgo UCD has a solar abundance ratio. The super-solar [/Fe] abundances are typical of old stellar populations found in globular clusters and elliptical galaxies. We find that Virgo UCDs have structural and dynamical properties similar to Fornax UCDs. The Virgo and Fornax UCDs all have masses and mass-to-light ratios . The dynamical mass-to-light ratios for Virgo UCDs are consistent with simple stellar population model predictions: the Virgo UCDs do not require dark matter to explain their mass-to-light ratios. We conclude that the internal properties of Virgo UCDs are consistent with them being the high-mass/high-luminosity extreme of known globular cluster populations. We refrain from any firm conclusions on Fornax UCD origins until accurate age, metallicity and -abundance estimates are obtained for them. Some of our results, notably the fundamental plane projections are consistent with the formation of UCDs by the simple removal of the halo from the nuclei of nucleated dwarf galaxies. However the ages, metallicities and abundances for Virgo UCDs are not consistent with this simple stripping model. It might be consistent with more sophisticated models of the stripping process that include the effects of gas removal on the chemical evolution of the nuclei.
1 Introduction
Recent spectroscopic surveys of the Fornax and Virgo galaxy clusters have revealed a new class of compact stellar system, “ultra-compact dwarf galaxies” (UCDs) with properties intermediate between the larges globular clusters and the smallest dwarf galaxies. The defining properties of the first UCDs found are that they are significantly more luminous than most known globular clusters (), but they are mostly unresolved in ground-based sky survey images. In this paper we present detailed observations of a new sample of UCDs in the Virgo cluster in order to test hypotheses for the formation of these objects.
The Fornax Cluster UCD objects were discovered independently in studies of globular cluster systems around the central galaxy NGC 1399 (Minniti et al. 1998, Hilker et al. 1999) and in studies of compact dwarf galaxies in the cluster (Drinkwater et al. 2000, Phillipps et al. 2001). Confirmed UCDs have subsequently been found in the Virgo Cluster (Haşegan et al. 2005, Jones et al. 2006) and UCD candidates identified in the more distant cluster Abell 1689 (Mieske et al. 2004). At low luminosities () the distinction between UCDs and globular clusters is not clear (see discussions in Drinkwater et al. 2004, Mieske et al. 2006), but in this paper we focus on the most luminous objects ().
Given their intermediate nature, most formation hypotheses for UCDs relate them to either globular clusters or dwarf galaxies. They could be highly luminous intra-cluster globular clusters (e.g. Mieske et al. 2002). Alternatively, UCDs may result from the tidal disruption of nucleated dwarf elliptical galaxies. This process can leave the nucleus intact on intra-cluster orbit (Bekki et al. 2001, 2003) as a UCD. Other formation scenarios include UCDs being the evolved products of massive super starclusters formed in galaxy mergers (Fellhauer & Kroupa 2002), or primordial objects (Phillipps et al. 2001).
It is hard to provide definitive observational tests of these different scenarios for UCD formation. This is partly because the various scenarios do not always make very different predictions, but the observational picture also remains far from complete. The observational tests can broadly be divided into statistical population studies (e.g. the distribution of UCDs compared to other objects) and detailed studies of the internal properties (e.g. internal velocity dispersion) of the UCDs. In this paper we focus on the latter.
Our previous investigations have focused on the Fornax Cluster UCDs. We used Hubble Space Telescope (HST) imaging and ESO Very Large Telescope spectroscopy to compare the five original UCDs to globular clusters and nucleated dwarf galaxies (Drinkwater et al. 2003). We concluded that UCDs were distinct from known globular cluster populations as they followed a different relation between internal velocity dispersion and luminosity. The UCD properties were, however consistent with the threshing model in which the dwarf galaxy nuclei survived tidal disruption with no significant change to their luminosity or velocity dispersion.
The tidal disruption hypothesis was also supported by Haşegan et al. (2005) in their analysis of 10 compact “dwarf-globular transition objects” found in HST images of Virgo Cluster galaxies. The transition objects of Haşegan et al. have slightly lower luminosities () than the Fornax UCDs, but the brighter ones were found to be significantly different to globular clusters, both in size and in following galaxy scaling relations. Haşegan et al. suggest that “bona fide” UCDs are also distinguished by the presence of dark matter as some of their objects have .
A detailed analysis of the stellar populations of compact objects in the Fornax Cluster (Mieske et al. 2006) has reached quite different conclusions. They measured spectroscopic metallicities for 26 compact objects with luminosities spanning both UCDs and globular clusters and found a break in the distribution at about . The more luminous objects have a narrow metallicity distribution with mean [Fe/H], whereas the less luminous objects show a much broader range of metallicity and a significantly lower mean (0.56 dex lower). There is a break in the size-luminosity relation for these objects at the same luminosity. Mieske et al. note that the metallicity of the dwarf galaxy nuclei in their sample is significantly lower than that of the UCDs which, in turn, are better matched by models of massive young star clusters. They therefore suggest that the UCDs in the Fornax Cluster are formed as a result of galaxy mergers, but note that the properties of the Virgo Cluster UCDs are more consistent with the stripping model.
In this paper we present new imaging and spectroscopic observations of the Virgo Cluster UCDs listed by Jones et al. (2006). These are analysed along with existing data for the luminous Fornax Cluster UCDs (Drinkwater et al. 2003). In Section 2 we describe the high-resolution spectroscopic observations, and in Section 3 we describe the corresponding HST imaging. We present an overview of our results in Section 4 by comparing the UCDs with other objects in various projections of the fundamental plane. In Section 5 we investigate the UCD dynamics in more detail, calculating their mass-to-light ratios, and in Section 6 we examine the ages and chemical composition of their stellar populations. Our main results and conclusions are given in Section 7. We use distance moduli of 30.92 mag and 31.39 mag for the Virgo and Fornax Clusters respectively (Freedman et al. 2001).
2 Spectroscopy
Observations of the six Virgo UCDs, a comparison M87 globular cluster (Strom417), a comparison dwarf galaxy nucleus (VCC417) and the NGC4486B galaxy (its central part) were carried out on 2003 April 6–7 with the Echelle Spectrograph and Imager (ESI) on the Keck II telescope in the echellette mode (Table 1). A slit width of 075 was used, providing an instrumental resolution of 50 km s-1 (FWHM) or 6,000. The wavelength range is , distributed over 10 echelle orders, with a dispersion of 11.4 km s-1 pixel-1. The exposure times are given in Table 1. In addition, standard stars of spectral types in the range between G8III and M0III (Table 2) were observed for use as templates for the radial velocity and velocity dispersion measurements and line index calibrators. The standard stars were observed in two ways: held centered in the slit, and also moving perpendicularly across the slit (“smeared”) to simulate the appearance of extended sources which overfill the slit and consequently have slightly lower spectral resolution. The seeing was a stable 08 the first night, and ranged from 08 to 11 the second. The first night was photometric; the second had occasional light cirrus.
The data were reduced using scripts in IRAF and IDL specifically written to handle the ESI data format and idiosyncrasies, but otherwise are standard procedures for CCD data. Spectra were extracted over a 15 aperture centered on the peak, taking in nearly all the light from the UCDs and globulars. The relative flux scale was determined using nightly observations of Feige 34. The S/N for each integration ranges from to 25 per pixel, yielding final S/N of 30 to 50 after coadding the multiple observations of each target.
The radial velocity and velocity dispersion of our objects were determined using two different techniques: the direct-fitting method (as described and implemented by van der Marel 1994) and the cross-correlation method (Tonry & Davis 1979, as implemented in RVSAO/IRAF). In the direct-fitting method the template star spectrum (Table 2) is broadened with Gaussian functions of variable in velocity space. The resulting set of spectra are then compared with the object spectrum. The best-fitting Gaussian function is determined by minimization in pixel space. The second method is to cross-correlate the object spectrum with the stellar template spectrum to determine the width of the cross-correlation peak and the redshift. The correlation width is used to estimate the velocity dispersion by comparison with results from artificially broadening the template stars by convolution with Gaussian functions of known width. This method is less sensitive to the exact match between template and object spectra, than the direct-fitting method.
Velocities and velocity dispersions were obtained from the CaT () and Mgb () regions. The measured values are given in Tables 3 & 4 and are consistent, within the measurement errors, for the two techniques and the two wavelength regions. The exception is VUCD3. In the following discussion, we use values obtained as the mean of the two wavelength regions and the direct-fitting method as it gives smaller measurement errors. The adopted velocities and velocity dispersions for the observed objects are shown in Table 5. Our measurements for NGC4486B are in good agreement with Bender et al. (1992).
There were almost no differences in velocity and velocity dispersion measurements obtained with smeared and unsmeared stellar templates.
The two wavelength regions give significantly different velocity dispersions for VUCD3: 49 km s-1 for the Mgb region, but only 38 km s-1 for the CaT region. This discrepancy appears to be real. We suspect this may be because the ratio of giant to dwarf population contributions to the continuum is varying rapidly in this object compared to the other UCDs. This might be expected because this object also has a much higher metallicity than the other UCDs (see Section 6 below), so that the relative contribution of the higher gravity dwarf stars to the blue-green (Mgb) region of the spectrum is greater, leading to broader lines in this region compared to the other UCDs. The CaT region is dominated by giant stars, no matter what the metallicity of the UCDs. Modeling of this effect could lead to a better understanding of the stellar populations, but a more extensive library of stars is required.
3 Imaging
We obtained images of the Virgo UCDs in the course of HST snapshot program 10137. The data were taken with the Advanced Camera for Surveys (ACS), High Resolution Channel (HRC) through the F606W and F814W filters. Exposure times were 870 sec in F606W and 1050 sec in F814W. The HRC scale is pixel-1. For the image analysis we used MultiDrizzle111http://stsdas.stsci.edu/multidrizzle (mdz) files retrieved from the HST archive.
To measure the total magnitudes, we plotted curves of growth (integrated magnitude versus circular aperture radius) to find an aperture radius large enough to enclose all the light from an object. The instrumental F606W and F814W magnitudes were transformed into Landolt and band following Sirianni et al. (2005). The resulting magnitudes and colors are listed in Table 6.
We have also used HST imaging data (program 8685) for Fornax UCDs and a dE,N (FCC303), initially presented in Drinkwater et al. (2003), as one of the aims of this work is to compare Virgo UCDs with Fornax UCDs and dwarf nuclei. The data consist of 1960 sec exposures taken with the Space Telescope Imaging Spectrograph (STIS) in unfiltered mode (50CCD). The STIS has a scale of pixel-1. We re-processed the STIS images with MultiDrizzle to ensure that the data reduction method for the Fornax UCD images was consistent with that of the Virgo UCD images. The instrumental AB magnitudes were transformed into band using the relation (H.Ferguson, private communication; see also Gregg & Minniti 1997). We used colors for UCDs and FCC303 from Karick et al. (2003). The total magnitudes for Fornax UCDs and FCC303 are presented in Table 7.
The images of Virgo and Fornax UCDs were modeled using two-dimensional fitting algorithm GALFIT (Peng et al. 2002) and assuming empirical King, Sersic and Nuker models for the luminosity profile.
The King profile is characterized by the core radius, , and the tidal radius, , and has the following form:
| (1) |
where I0 is the central surface brightness. We tried both the standard model with and generalized model with variable . The King model provides a good fit to globular cluster luminosity profiles when the concentration index and to elliptical galaxy luminosity profiles if (Mihalas & Binney 1981).
The Sersic power law is often used to fit luminosity profiles of galaxies and has the following form:
| (2) |
where is the half-light (effective) radius, is surface brightness at the effective radius, n is the concentration parameter (n=4 for de Vaucouleurs profile and n=1 for exponential profile) and k is a constant which depends on n.
The Nuker law is as follows:
| (3) |
It is a double power law, where is the outer power law slope, is the inner slope, and controls the sharpness of the transition (at the “break” radius ) from the inner to the outer region. . The Nuker law was introduced by Lauer et al. (1995) to fit galaxy centers.
GALFIT convolves the analytic profile with the PSF and determines the best-fitting model parameters by minimizing residuals between the model and original two-dimensional image.
We derived artificial PSFs for ACS/HRC images in the F606W and F814W filters using the TinyTim software222http://www.stsci.edu/software/tinytim and MultiDrizzle as follows. First we generated ACS/HRC PSFs with TinyTim; these include all the distortions, so they represent the PSF in raw images. We then implanted these PSFs in empty distorted images (flt files), at the location of each target observed, and passed them through MultiDrizzle using the same parameters as were used for the data. This produces model PSFs that are processed the same way as the real data. For the STIS imaging, the generation of the PSF is more straight-forward and is achieved through a single pass of TinyTim.
The quality of the GALFIT model fits in the inner regions of each object is shown in Figures 1 & 2. These Figures present residual maps after subtracting the (PSF-convolved) model from each object. The quality of the models in the outer regions is better shown in Figures 3 & 4. For these figures we used the ELLIPSE task in IRAF to produce one-dimensional surface brightness profiles for the objects and (PSF-convolved) GALFIT models.
The values of the fits (see Peng et al. 2002) are shown in Tables 8 & 9. We use values to choose the best model for each object (see the last row of Tables 8 & 9).
From Figures 1-4 and the values in both filters we can see that the Virgo UCDs are poorly fitted with the standard King model (), but are very well fitted with the Nuker law – a double power law (except VUCD7 which requires a two-component model). King models predict a truncation radius, beyond which stars are stripped from the cluster by the galactic tidal field. None of the UCDs show this tidal cutoff down to our limiting surface brightness. Also, a main feature of King models is their central cores—the regions of constant surface brightness. We have found from Nuker models that only one UCD has a flat core (VUCD5), all other UCDs have shallow or steep cusps in the center (Table 8).
Generalized King models (with a variable parameter) provide better fits to the data than standard King models. The parameter controls both the slope of the profile, and the transition from the main body into . When we relax the parameter, we can better fit the extended outer parts of the UCDs. However, King models have a tidal cutoff and do not fit the data as well as untruncated Nuker models do.
To fit a standard King model to the F606W data for VUCD3, we had to fix at 1 pixel (1.9 pc). There is no convergency if we leave as a free parameter (perhaps because becomes too small, 1 pixel). The lack of a good King fit to the F606W data for VUCD3 is seen in Figure 3. We also failed to fit any of the King models to the F814W data for this object. There was no convergency with either fixed or relaxed.
Sersic models do not provide good fits to the Virgo UCDs either. In the majority of cases, the model profiles drop faster than the data. The fit seems good in the case of VUCD3, but this object has a very steep profile (a very high index n). Models with a Sersic index n 2 become very sensitive to the sky determination, flatfielding, the accuracy of the PSF being used, and how well the assumed profile agrees with the data (see on-line GALFIT manual333http://zwicky.as.arizona.edu/cyp/work/galfit/TFAQ.html). The more centrally concentrated a galaxy profile is (the larger the Sersic index n is), the more extended outer wing it has. Because of this behavior, if (for example) a profile already has a high intrinsic index n, a small underestimation of the background can make n even higher and can cause large errors in the magnitude and size. When fitting VUCD3 data in the two passbands, we obtained quite different parameters: e.g. the difference in was 39 %. This could be due to the above reasons.
We conclude that the Nuker law appears to be the best model for all Virgo UCDs except VUCD7, in which case the King core + Sersic halo model is the best one.
The situation is different for the Fornax UCDs. There is no universal model for them. Two objects (UCD3 and UCD5) are best fitted by two-component models. The other three have very steep profiles which are hard to model. In the case of UCD1 the best model is Sersic. The best model for UCD2 is the generalized King law and in the case of UCD4 it is the Nuker law.
The residual maps of Fornax UCD3 reveal faint structure to the North-West of the core. This is very likely a background spiral galaxy along the line of sight. This structure affected the profile fits to UCD3 to the extent that the two-component models gave very inconsitent results. For this object we therefore restricted the model fits to the bottom half of the image. The model parameters for UCD3 in all the tables are from these fits to half the images, although we show the images and plots in Figures 2 & 4 for the whole-image fits to reveal the background object.
The UCD structural parameters obtained from the fits are summarized in Tables 8 & 9. The Nuker fits gave us the outer power law slope , the inner slope , parameter, the “break” radius , the surface brightness of the profile at the “break” radius and ellipticity (b/a is the minor-to-major axial ratio). From Sersic models, we obtained the half-light radius , Sersic index n, ellipticity and the integrated magnitude . The King fits gave us the core radius , tidal radius , concentration parameter , central surface brightness and ellipticity . All the GALFIT models assume a constant ellipticity which is fitted at the same time as the other parameters. The values and the integrated magnitudes for the King and Nuker models were obtained via numerical integration of the luminosity profiles (defined by formulae 1 and 3). We also obtained half-light radii from the observational data directly (). In this case the data were not PSF-deconvolved and the half-light radii may be overestimated. The structural parameters for Virgo UCDs were averaged between the two filters.
For further analysis we had to decide what to choose for our objects. We could not take just the best model because, for example, in the case of Virgo UCDs the best model is Nuker. For all the Nuker models in Tables 8 & 9 (except for VUCD1 & VUCD5) the total volume under the profile (the integrated luminosity) converges very slowly. It makes estimations uncertain and results in unphysically large values. This is why we chose generalized King values. The generalized King models fit the Virgo UCD data better than standard King and Sersic models, and they are finite in extent. In addition to this, generalized King values are consistent with the observational half-light radii ().
In the case of the Fornax UCDs we also chose the generalized King for one-component UCDs and the King for the cores of the two-component objects. The Sersic fits seem unreliable as all of the models have very high index n (see above). Nuker models are not good for estimation because of the reason explained above.
We list the best values of the various parameters of the Virgo and Fornax objects in Table 10. These are used in the following section for analysis of the scaling relations. In Table 10 we quote three values of effective radius in the case of two-component objects (VUCD7, UCD3, UCD5 & FCC303): the total, only the core, and only the halo. These were obtained via numerical integration of the model luminosity profiles. Table 10 also contains the total V band apparent magnitude , the mean surface brightness within the effective radius and ellipticity . The values are observational values copied from Tables 6 & 7 except for the core and halo magnitudes of the two-component objects, which are model values taken from Tables 8 & 9 (King+Sersic models). The values were derived from and as follows:
| (4) |
where is measured in arcsec. The figures are the best model values from Tables 8 & 9.
The ellipticities of the UCDs given in Table 10 show that some of the objects are significantly non-circular; the maximum (core) ellipticity is 0.24 for Fornax UCD5. We have compared the distribution of UCD ellipticities with those reported for globular clusters in NGC 5128 (Harris et al. 2002) and the Milky Way (Harris 1996; online catalogue version of 2003 February). The two-sample Kolmogorov-Smirnov test indicates that the UCD ellipticities are consistent with both the MW GC distribution—the significance level444By significance level we mean the (percentage) probability that the K-S test statistic is as large as measured for the null hypothesis that the data sets are drawn from the same distribution. Small values of the significance indicate that the distributions differ significantly. is 53% or 66% (depending on the ellipticity used for two-component UCDs: core or halo)—and the NGC 5128 GC distribution—the significance level is 38% or 63%. The Wilcoxon test gives similar results: the UCD ellipticities are consistent with the MW GC distribution at the 42% or 36% significance level and with the NGC 5128 GC distribution at the 27% or 46% significance level.
4 Fundamental plane relations
In this section we compare UCDs with globular clusters and galaxies by their position in both the luminosity–velocity dispersion plane and -space (the fundamental plane as defined by Bender et al. 1992).
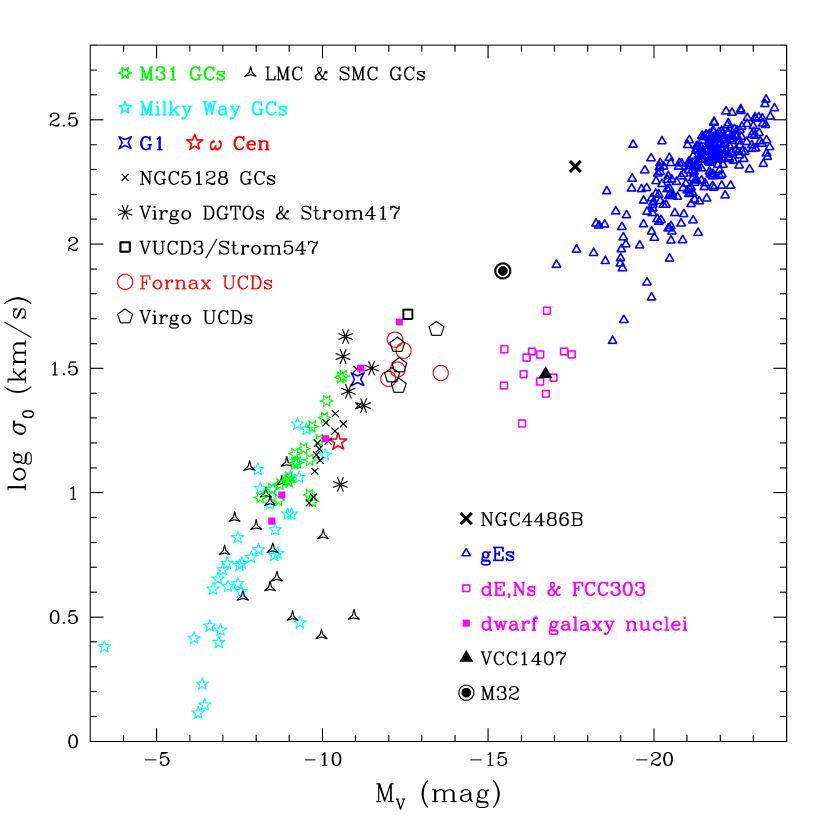
First we revise the luminosity-velocity dispersion correlation for UCDs and other types of stellar systems proposed in Drinkwater et al. (2003). Figure 5 represents the absolute V magnitude vs. central velocity dispersion relation for Fornax and Virgo UCDs, globular clusters (including the most massive and luminous ones: G1 in M31, the Galactic globular cluster Cen, and NGC5128 massive GCs) and galaxies. The UCD data were obtained in the present work (Tables 10 & 12), except central velocity dispersions for Fornax UCDs, which were taken from Hilker et al. (2006). The velocity dispersion for Fornax UCD1 was derived from CaT region using the cross-correlation method and only one stellar template (G6/G8IIIw type)555The UCD1 velocity dispersion was measured and used by Drinkwater et al. (2003).. The data for globular clusters are from: M31 GCs – Djorgovski et al. (1997) and references therein; G1: Djorgovski et al. (1997) and references therein, except half-light radius (required for Figure 6), which was taken from Barmby et al. (2002); Milky Way GCs, Cen, LMC and SMC GCs (most of which have old ages) – McLaughlin & van der Marel 2005 (photometry is based on Wilson models); NGC5128 GCs – Martini & Ho (2004); Strom417: spectroscopy – this work (Table 12), photometry – Haşegan et al. (2005). We also plot “dwarf-globular transition objects” from Haşegan et al. (2005). Data for galaxies were obtained from: giant ellipticals – Faber et al. (1989); NGC4486B: spectroscopy – our data, Bender et al. (1992), photometry – Faber et al. (1989); the compact elliptical galaxy M32 – Faber et al. (1989), Bender et al. (1992); dE,Ns and dwarf nuclei – Geha et al. (2002, 2003); FCC303: photometry – this work, spectroscopy – Hilker et al. (2006); VCC1407: velocity dispersion – this work, magnitude – NED. All the magnitudes were dereddened and all the velocity dispersions for GCs and UCDs were aperture-corrected to give standard values (the central velocity dispersions) used in the literature for the comparison with Galactic GCs.
From Figure 5 we can see that there is no gap between bright GCs and UCDs and that the Virgo UCDs have velocity dispersions and luminosities similar to the Fornax UCDs. VUCD3/Strom547 and Strom417 were previously considered to be M87 GCs (Strom et al. 1981). These are the two brightest M87 GCs according to Hanes et al. (2001) list. Now we see that these GCs lie in the same part of plane as UCDs and can be equally considered as UCDs. The UCDs, along with transition objects of Haşegan et al., appear to follow approximately the same relation between luminosity and velocity dispersion as old globular clusters. To make a firm conclusion if the UCDs lie on the extrapolation of the GC relation or not, more data on the velocity dispersions for bright GCs (such as NGC5128 and M31 globulars) or fainter UCDs (e.g. recently discovered in the Fornax Cluster, Drinkwater et al. 2004) are required. There is an overlap in luminosities and velocity dispersions of the dE,N nuclei and the properties of bright GCs, transition objects of Haşegan et al. and UCDs, which is consistent with the stripping hypothesis for GC, transition object and UCD formation.
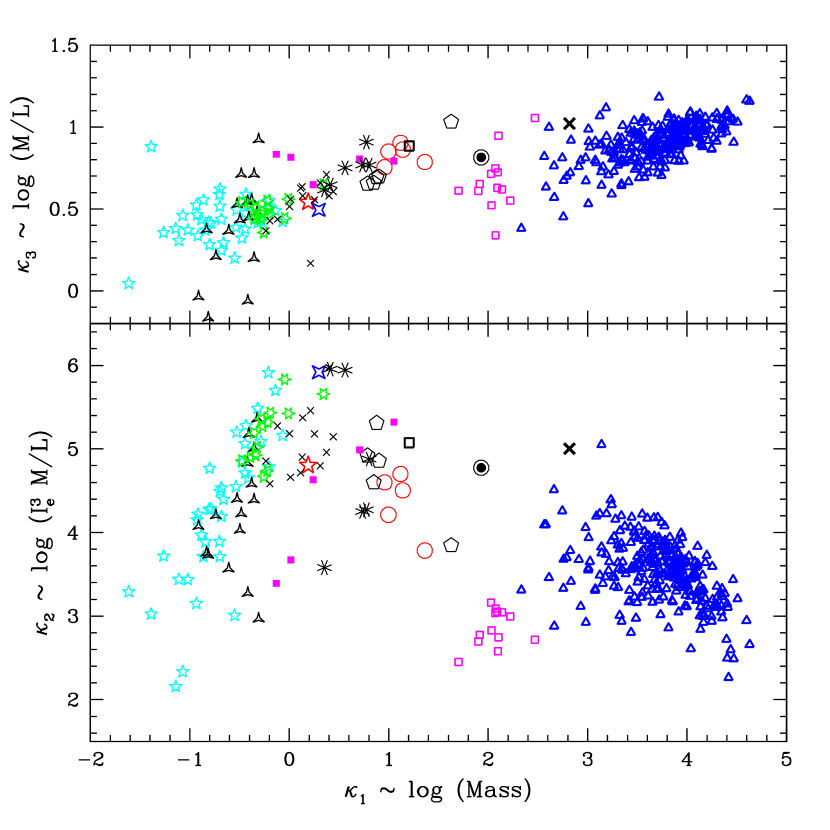
Next we consider the location of UCDs relative to other stellar systems in the -space (Figure 6). The -space is a space in which axes are combinations of three observable parameters (central velocity dispersion, effective radius and mean intensity inside effective radius) into physically meaningful parameters. The -space parameters as defined by Bender et al. (1992) are as follows:
| (5) |
| (6) |
| (7) |
where is the central velocity dispersion in , is the half-light radius in kpc, is the mean intensity inside , defined as and measured in V-band solar luminosities pc-2. The variables have the following physical meanings: is proportional to the logarithm of the mass, is proportional to the logarithm of the surface brightness cubed times the mass-to-light ratio, and is proportional to the logarithm of the mass-to-light ratio.
As expected, objects are distributed more widely in the - plane, the face-on projection of the fundamental plane, than in the - , the edge-on projection. In the - plane we show that the UCDs lie on the same tight correlation between mass and mass-to-light ratio as the bright GCs and transition objects of Haşegan et al., but the fainter GCs () show little if any correlation in this plane. This corresponds approximately to a mass of M⊙ at which Haşegan et al. (2005) also find a turn-over in scaling relations for GCs and other low-mass systems in other projections of the fundamental plane. Consistent with previous discussions (e.g. Burstein et al. 1997) we find that this relation does not intersect that of giant elliptical galaxies in the same - plane.
By contrast, in the - plane we find that the UCDs are clearly not on the main GC relation (as defined by the Milky Way and M31 GCs). The UCDs lie in a region away from this sequence in the direction of increasing mass (). The NGC5128 GCs also lie off the main GC relation between it and the UCDs. We must note here that the UCDs are from magnitude-limited samples (equivalent to ), so these data do not actually provide evidence for a gap between UCDs and GCs. There is a relatively empty region in the plane at () values of around (0,3.5–4.5) at masses intermediate between GCs and UCDs but low values. According to Bastian et al. (2006), young massive star clusters, if evolved to ages of 10 Gyr, would occupy this region of the fundamental plane. Bastian et al. note that not many of these are expected to survive to such ages, but even those not disrupted would be unlikely to appear in the existing observational data sets due to the following selection effects. First, there are no UCDs in this region as our UCD samples are limited to higher masses (luminosities strictly speaking). Secondly, GCs in this region would have high mass and presumably would only be found in external galaxies like the NGC5128 objects, but they would have much lower surface brightness values, so it would not be possible to measure their velocity dispersions even if they could be detected.
It is interesting to note that the more massive objects () show the opposite correlation between and to the lower-mass systems in Figure 6. Since () is increasing for the high-mass objects, it must be that is decreasing for these objects. This agrees with the mass-size relation observed for objects in this mass range (e.g. Kissler-Patig et al. 2006 and Haşegan et al. 2005).
In both the fundamental plane projections we also show the parameters of the nuclei of a sample of nucleated dwarf elliptical galaxies in the Virgo Cluster (Geha et al. 2002). The nuclei with similar masses to the UCDs lie in the same region of both plots as the UCDs. This is consistent with the threshing hypothesis for UCD formation from disrupted dwarf elliptical galaxies. The UCDs are mostly well-separated from complete dwarf elliptical galaxies in the fundamental plane; the closest galaxy to UCDs is M32, the prototype “compact elliptical” galaxy which is also thought to have formed through a disruptive process (e.g. Choi et al. 2002).
5 Masses and Mass-to-Light Ratios
In this section we estimate the masses of the UCDs using dynamical models. The masses and mass-to-light ratios of the UCDs are important physical parameters for the understanding of their origin. In particular, the mass-to-light ratio () is an indicator for possibly existing dark matter and/or violation of dynamical equilibrium or isotropy of stellar orbits. If UCDs were the counterparts of globular clusters, one would expect values as predicted by simple stellar population models (e.g. Bruzual & Charlot 2003, Maraston 2005). If UCDs were of “galaxian origin”—formed in dark matter halos—they might still be dominated by dark matter and show high values. Mass-to-light ratios larger than expected from simple stellar populations can, however, also be caused by objects that are out of dynamical equilibrium, e.g. tidally disturbed stellar systems (Fellhauer & Kroupa 2006).
5.1 Method
The UCD masses were estimated from the measured velocity dispersions and their structural parameters. We showed in Section 3 that the UCD light profiles can be fitted by various functions. A simple King profile often is not the best choice to represent UCD surface brightness profiles. However, most mass estimators available in the literature are based on the assumption of a King profile. In order to be not restricted to King profiles, we used a more general approach, using software developed by H. Baumgardt (see Hilker et al. 2006).
The first stage is to deproject the observed density profile (either King, generalized King, Sersic, Nuker, or King+Sersic), calculate its distribution function under the assumption of spherical symmetry and an underlying isotropic velocity distribution, and finally create an -body representation of the UCD. It is assumed that mass follows light (e.g. mass segregation is neglected). Besides the projected profile parameters, the total mass of the stellar system and the number of test particles are needed. The resulting model is a list of , and positions and , and velocities for all particles that correspond to the specified structural parameters and the given mass. From this model, the central as well as global projected velocity dispersion can be calculated. The projected half-mass radii for all the models were also derived and were in very good agreement with the half-light radius values in Tables 8 & 9.
In the second stage, the velocity dispersion seen by an observer is simulated. In order to do this, all test particles are convolved with a Gaussian whose full-width half-maximum (FWHM) corresponds to the observed seeing. The fraction of the light (Gaussian) falling into the slit at the projected distance of the observed object (the size of the slit in arcsec and the distance to the object in Mpc are input parameters) is then calculated. These fractions are used as weighting factors for the velocities. The weighted velocities of all particles whose “light” falls into the slit region are then used to calculate the mimicked observed velocity dispersion .
The total “true” mass of the modelled object, , that corresponds to the observed velocity dispersion, is not known a priori. One has to start with a first guess of the total mass, , from which the “true” mass can be calculated as .
In the case of the Nuker and Sersic functions, the models were truncated at large radii to avoid the unphysical infinite extensions of UCD light profiles. The truncation radius of the Nuker model was fixed to 2 kpc. The truncation radius of the Sersic model was set to 20 times the effective radius, thus ranging between a few hundred parsecs and a few kiloparsecs for the UCDs in our sample. The true tidal radii of the UCDs depend on their distances to the cluster center and the enclosed mass of the potential they are living in. They can be estimated by the formula: , where is the circular velocity of the cluster potential and is the gravitational constant. The estimated tidal radii of the UCDs range between 1 and 4 kpc, thus justifying the chosen truncation radii.
A more detailed description of the mass determination process and mass values for Fornax UCDs are presented in Hilker et al. (2006). In this paper the discussion will be focused on the Virgo UCDs.
5.2 Uncertainty analysis
The uncertainties of the modelled masses were estimated from the uncertainty in the observed velocity dispersion, and the differences of the model parameters for surface brightness profiles in the and band. On one hand, maximum and minimum model masses were simulated that correspond to the observed velocity dispersion of and , respectively. The average of the differences and defines the first mass uncertainty. On the other hand, models were created that simulate from the profile parameters in and separately as well as from combinations of their parameters (i.e. of and of ) to mimic the uncertainties in the profile parameters. The maximum and minimum mass deviations from define the second uncertainty. Both uncertainties then were summed to derive the total mass uncertainty.
The uncertainties for the mass-to-light ratios were propagated from the mass uncertainties and the uncertainty in the luminosity (assumed to be 0.05 mag in the absolute magnitude). The luminosities were derived from the apparent magnitudes given in Table 10, the distance to the Virgo Cluster as mentioned in the introduction and a solar absolute magnitude of mag.
The uncertainty of the central velocity dispersion was estimated from the observational uncertainty plus the scatter of modelled velocity dispersions in annuli of 0.5 parsec within the central 5 pc for each object. The uncertainty of the global velocity dispersion is the sum of the observational uncertainty and the uncertainties as propagated from the mass uncertainty of the profile fitting parameters.
5.3 Results
The results of the modelled object masses and velocity dispersions for the King, generalized King, Sersic, Nuker and King+Sersic functions are presented in Table 11. These results are based on the surface brightness profile parameters in Table 8 and the observed velocity dispersions in Table 5. For Strom417 we used surface brightness profile parameters obtained by Haşegan et al. (2005) from King model fits.
The masses and values of the different models in general agree with each other within the uncertainties. On average, the masses of the Nuker profile models are slightly higher than those derived from the other profiles, whereas the masses of the Sersic profile models are on the low side. As discussed in Section 3, the generalized King models give the most stable estimates in the case of one-component profile fits. Therefore, the masses from the generalized King models and from the King core plus Sersic halo models in the case of VUCD7 were adopted for further analyses (see Table 12).
The Virgo UCDs have masses and mass-to-light ratios in the range and . The Fornax UCD masses and mass-to-light ratios are in the same range (Hilker et al. 2006).
In order to compare our results with other dynamical mass estimators we calculated masses using the King mass estimator (e.g. Queloz et al. 1995) and the virial mass estimator (Spitzer 1987). Both methods assume a constant ratio as function of radius, an isotropic velocity distribution and that the object is in virial equilibrium. We consider the UCDs are in virial equilibrium as their ages (estimated in the following section) are much greater than their crossing times ( Myr).
The King mass estimator takes the form:
| (8) |
where is the central projected velocity dispersion (from Table 11, standard King model), is the core radius (from Tables 8 & 9, standard King model), is the gravitational constant and , and are constants which depend on the concentration, , and are tabulated in King (1966) and Peterson & King (1975). , and are the mean of the two passbands for Virgo UCDs, except for VUCD6. In the case of VUCD6 we used passband only, passband gives unreasonably high mass estimate. , , and for Strom417 were taken from Haşegan et al. (2005).
The virial mass estimator is as follows:
| (9) |
where is the global projected velocity dispersion (from Table 12) and is the half-light radius (from Table 10). for Strom417 was taken from Haşegan et al. (2005).
The results of these two mass estimators are given in Table 13. The uncertainties of the calculated masses were propagated from the uncertainties in and for the King mass estimator and the uncertainties in and for the virial mass estimator where the uncertainty in was estimated from the difference of in the and profile.
Both the King and virial masses are consistent with the masses and mass-to-light ratios indicated in Figure 6 and with the masses derived from the dynamical models (Table 12). The exception is VUCD7 for which the virial mass estimate is 1.8 times larger than the dynamical model mass. This may be due to the inability of the simple virial estimator to correctly model the prominent core structure of this object, but the difference is not significant given the large uncertainty in the virial mass estimate for this object.
In Table 14 we compare the dynamical estimates for Virgo UCDs with the predicted stellar mass-to-light ratios of simple stellar population (SSP) models by Maraston (2005). To obtain the SSP model values, we used UCD ages and metallicities derived in the following section (Figure 9). The uncertainties of the values are based on the age and metallicity ranges. The dynamical values are consistent with the SSP model predictions within the uncertainties for both Salpeter and Kroupa IMF. It implies that Virgo UCDs do not require dark matter to explain their mass-to-light ratios. This conclusion applies to the central region where we have velocity dispersion data covered by our spectroscopic observations. An increasing dark matter contribution towards larger radii can not be ruled out with the present data.
The mass-to-light ratios of Fornax UCDs are discussed in Hilker et al. (2006).
The mass-to-light ratio of Strom417 () is larger than the value predicted by the SSP models with Kroupa IMF, but is in agreement (within the uncertainties) with the predictions from the models with Salpeter IMF. This mass-to-light ratio is consistent with the high value reported for this object by Haşegan et al. (2005), but our result is based on their King model fit to this object. For this reason our measurement is not an independent confirmation of their result.
6 Ages and Chemical Compositions
In this section we estimate the ages, metallicities, and abundances of our objects using the Lick/IDS index analysis. Lick/IDS absorption-line indices were measured as defined by Worthey et al. (1994) in the wavelength region . We could not use the spectral region due to low S/N. The line indices H, Mgb, Fe5270, and Fe5335 together with uncertainties are listed in Table 15. Before measuring the indices we shifted the spectra to the rest frame wavelengths. Since our spectra have much higher resolution ( in the blue wavelength range) than the Lick/IDS system ( at the H - Fe5335 wavelength range), we smoothed our spectra to the resolution of the Lick data with a Gaussian of dispersion . The estimated size of the smoothing kernel is 17 ESI pixels (Gaussian sigma). After broadening, the Lick indices for our objects and for the Lick/IDS standards (9 stars) were measured as described in Worthey et al. (1994). The uncertainties on the indices were calculated according to Cardiel et al. (1998) based on the noise spectrum of each galaxy/GC.
To check the agreement between our instrumental system and Lick/IDS system, we calculated the difference between measured and published (Worthey et al. 1994) indices for all observations of the 9 calibration stars. Figure 7 shows our standard star measurements versus the published values (Worthey et al. 1994). The mean offsets between our instrumental system and the Lick/IDS system are listed in Table 16. The index measurements were corrected for the offsets.
The Lick index measurements for the NGC4486B galaxy were also corrected for the effects of internal velocity dispersion as described in Davies et al. (1993). UCDs, GCs and dE,Ns have small internal velocity dispersions compared to the Lick/IDS broadening function. There is no need to apply velocity dispersion correction for these objects.
We have not corrected the dE,N (VCC1407) spectrum for any halo contribution because the nuclear light dominates in the central 15 of our extraction; this object is already on the old envelope and its indices agree well with the other Virgo dwarf elliptical galaxies measured by Geha et al. (2003).
The N4486B galaxy does not have a distinct halo, like the dEs do and the problem is the opposite of the dE problem. When subtracting “sky” from along the short slit like ESI (), one really subtracts a component of galaxy light from farther out, so then one ends up subtracting too much stellar light, which then alters the actual physical extent of what one samples. However, since ellipticals (especially the likes of N4486B) are very peaked in the center and have very modest (if any) line strength gradients, the error in the measured indices is very small.
To translate measured line indices into age and metallicity estimates, we used the SSP models of Thomas et al. (2003). These models predict Lick indices for a wide range of ages (1-15 Gyr) and metallicities ([Z/H] = -2.25,-1.35,-0.33,0.0,+0.35,+0.67 dex), and are tabulated for several different abundance ratios ([/Fe] = -0.3,0.0,+0.3,+0.5).
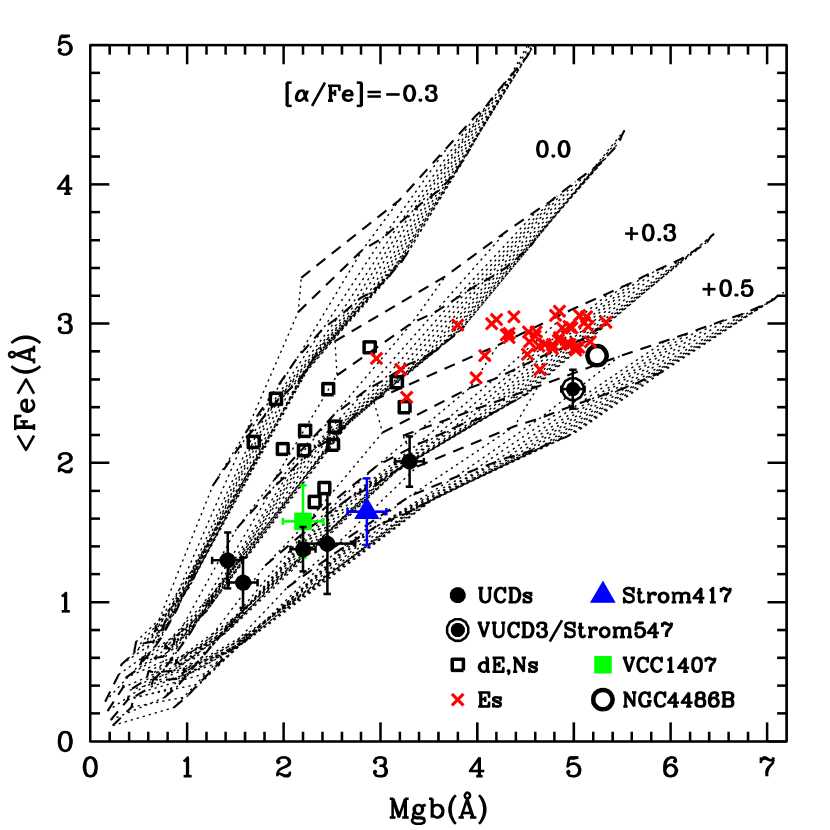
To estimate [/Fe] for the UCDs we plot Mgb (an indicator of –elements) versus Fe (an average of the indices Fe5270 and Fe5335) in Figure 8, overlaid with isochrones and isometallicity lines from Thomas et al. (2003). Five UCDs and Strom417 (a GC) have super-solar abundance ratio, [/Fe] +0.3 – +0.5, and one UCD appears to have solar abundances, [/Fe] 0.0. The super-solar abundances ([/Fe] +0.3) are typical of old stellar populations like globular clusters and elliptical galaxies. [/Fe] traces the timescale of star formation activity in galaxies. The majority of -elements is produced rapidly by Type II supernovae, while Fe is produced by Type Ia SNe on longer timescales. Supersolar [/Fe] indicates rapid enrichment from Type II supernovae and implies that the galaxy/GC has undergone a short burst of star formation activity. The solar and subsolar abundance ratios indicate slower chemical enrichment or a more quiescent star formation history (van Zee, Barton & Skillman 2004).
The nuclei of nucleated dwarf ellipticals, taken from Geha et al. (2003), are also shown in the same plot. The majority of the dE nuclei data are consistent with solar [/Fe] abundance ratios, while the majority of UCDs have super-solar [/Fe] abundances. This provides evidence that the Virgo UCDs and typical dE,N nuclei are different in that they have different formation histories. Our dE,N (VCC1407) lies, however, along the UCD relation together with two dE,Ns from Geha et al. (2003).
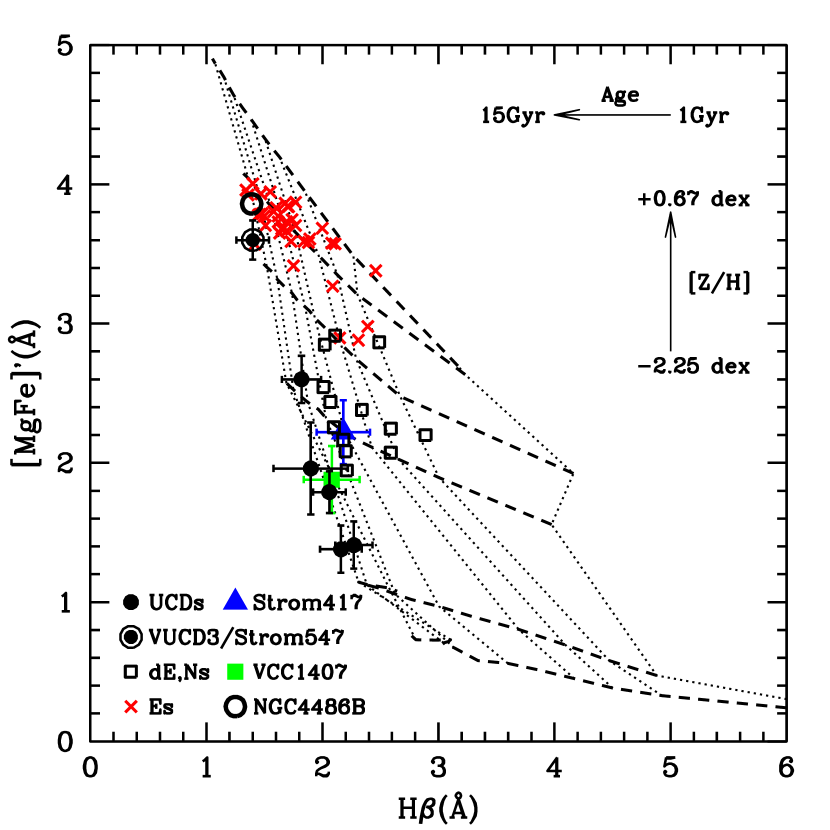
In Figure 9 we show the age-sensitive H index versus the metallicity sensitive [MgFe]’ index ([MgFe]’=) and compare them with the SSP models of Thomas et al. (2003). [MgFe]’ is largely independent of [/Fe] and serves best as a tracer of total metalicity (Thomas et al. 2003); and H is less [/Fe]-sensitive than other Lick Balmer line indices (Thomas et al. 2004). As we can see from the plot, the Virgo UCDs are old (older than 8 Gyr) and have metallicities between [Z/H] = -1.35 and +0.35 dex. The SSP models in Figure 9 are shown for the abundance ratio [/Fe] = +0.3. The conclusion about UCD ages and metallicities remains the same if we use [/Fe] = 0.0 and +0.5 models.
As a consistency test, we used the Virgo UCD ages and metallicities derived from Figure 9 and Maraston (2005) SSP models to predict photometric colors and to compare them with the observed ones. The results are summarized in Table 14. The observed colors of Virgo UCDs are in very good agreement with the colors predicted from the derived ages and metallicities.
The ages, metallicities and abundances of Virgo UCDs are similar to those found for GCs in the galaxies M49 and M87 in the Virgo Cluster by Cohen et al. (2003, 1998). According to Cohen et al. (2003), the M49 GCs have metallicities in the range from [Z/H] = -1.3 to +0.5 dex and in mean are older than 10 Gyr. The metallicity and age parameters for M49 and M87 GCs are basically identical. The GC systems of both of these galaxies are -enhanced by a factor of about 2 above the solar value.
We also find that the Virgo UCDs have older integrated stellar populations on average than the present-day dE,N nuclei. However we note that UCDs are not distinct from the oldest dE,N nuclei of Geha et al. (2003) and our dE,N, VCC1407, lies with the UCDs.
The general trend of UCDs to lower metallicities and older ages than the dE nuclei in Figure 9 is not consistent with the naive threshing model in which UCDs are identical to the present-day nuclei of dE galaxies. These results may, however, be consistent with variations of the threshing hypothesis in which the parent objects are disrupted at an early time when star formation is still going on and gas is present (e.g. Miske et al. 2006). In this scenario, the stripping selectively halts the star formation in the stripped objects (UCDs) giving them the lower metallicities and older ages compared to the nuclei which continue to form stars. However this may not be consistent with the [/Fe] abundances found in Virgo UCDs: their super-solar abundances imply rapid enrichment in a short burst of star formation. This seems to be inconsistent with gas stripping over an extended period, unless the stripping process caused a very sudden halt to the star formation.
We also measured the near-infrared Ca II triplet (CaT) index for Virgo UCDs (as defined in Cenarro et al. 2001) to compare it with the metallicity derived from the Lick indices above. SSP models predict a strong dependence of the CaT index on metallicity for sub-solar metallicities (Vazdekis et al. 2003, Maraston 2005). Globular clusters are found to follow the model predictions very well for the metallicities typical of Galactic GCs – up to about a solar metallicity (Saglia et al. 2002, Maraston 2005), whereas normal and dwarf elliptical galaxies deviate from SSP model predictions (Saglia et al. 2002, Michielsen et al. 2003). Michielsen et al. (2003) obtained CaT values for a sample of dEs and found that four of five dEs with independent metallicity estimates have CaT , which is much higher than expected from their low metallicities (-1.5[Z/H]-0.5). Saglia et al. (2002) found that the CaT values for bright ellipticals () are lower than predicted by SSP models for their ages and metallicities (0.0[Z/H]+0.7).
The CaT index values for our Virgo objects are listed in Table 17. The uncertainties were calculated based on the noise spectrum of each object. The resolution of the Cenarro et al. stellar library is very close to our spectral resolution, so no correction for resolution was needed. The measured indices for stars in common with the Cenarro et al. library showed good agreement between our instrumental system and Cenarro et al. system. The CaT index for the NGC4486B galaxy was corrected for the effects of internal velocity dispersion using a K-type stellar template (see Cenarro et al. 2001).
Figure 10 presents [Z/H] metallicity vs. CaT index for the Virgo UCDs, Strom417 (a GC), VCC1407 (a dE,N) and the NGC4486B galaxy. The metallicities were derived from the Lick indices (Figure 9). In Figure 10 we also plot Maraston (2005) SSP model predictions with a Salpeter IMF for ages 4, 9 and 15 Gyr. It is hard to make any strong conclusions from this figure due to the large uncertainties in the data, but it appears that for sub-solar metallicities the Virgo UCDs and Strom417 follow the SSP model predictions (within the uncertainties). VUCD3 deviates strongly from the model predictions. It has super-solar metallicity and lies in the plot with NGC4486B and other Es from Saglia et al. (2002). There are no CaT data for GCs at these metallicities available in the literature yet, so we can not conclude if VUCD3 is globular-like or not. Our dE,N (VCC1407) lies with the UCDs in the [Z/H] vs. CaT plot. The CaT value for VCC1407 is consistent with the SSP model predictions (within the uncertainties). However, as we already mentioned above, one of the five dEs studied by Michielsen et al. (2003) also have CaT in agreement with the model predictions for its metallicity, but all the rest do not. Given that globular clusters are known to follow SSP model predictions (for sub-solar metallicities), whereas dE and E galaxies do not (Saglia et al. 2002, Michielsen et al. 2003), then Figure 10 suggests that the Virgo UCDs have CaT indices more like globular clusters than galaxies.
7 Summary and Conclusions
In this paper we have presented new imaging and spectroscopic observations of six Virgo Cluster UCDs (discovery reported by Jones et al. 2006), along with re-analysed data for five Fornax Cluster UCDs (initially presented by Drinkwater et al. 2003). These are the most luminous UCDs: . The main results of our analysis of these data are as follows.
-
1.
From the HST imaging we find that most of the UCDs have shallow or steep cusps in their cores; only one UCD has a flat “King” core. We also find that none of the UCDs show tidal cutoffs down to our limiting surface brightness. These properties are not consistent with the standard King models with flat cores and tidal cutoffs used for most globular clusters. However, recent work has shown that GCs can have such parameters. Noyola & Gebhart (2003) obtained inner logarithmic slopes of profiles for 28 Galactic GCs and found that the slopes span a continious range from zero to 0.6 featuring central cusps as well as flat King cores. It is known that young GCs can have extended halos (e.g. Elson et al. 1987), but McLaughlin & van der Marel (2005) have now shown that extended halos are a generic characteristic of massive GCs—both young and old—in the Magellanic Clouds.
-
2.
Fundamental plane projections reveal a) that Virgo UCDs have properties similar to Fornax UCDs and b) that UCDs and transition objects of Haşegan et al. appear to follow the same relation between luminosity and velocity dispersion as old globular clusters.
In the - plane the UCDs lie on the same tight correlation between mass and mass-to-light ratio as the bright GCs and transition objects of Haşegan et al., but the fainter GCs () show little if any correlation in this plane. This corresponds to a mass of at which Haşegan et al. (2005) find a turn-over in scaling relations for low-mass systems in other projections of the fundamental plane.
In the - plane the UCDs are not on the main GC relation as defined by the MW and M31 GCs, but the available data do not provide any evidence for a gap between UCDs and GCs in this plane.
The dE,N nuclei in the Virgo Cluster with similar masses/luminosities to the UCDs lie in the same region of all fundamental plane projections as the UCDs. This is consistent with the threshing hypothesis for UCD formation from early-type dwarf galaxies by the removal of low surface brightness envelope.
-
3.
The age and metallicity analysis shows that Virgo UCDs are old (older than 8 Gyr) and have metallicities ranging from [Z/H] = -1.35 to +0.35 dex.
The observed colors of Virgo UCDs are in agreement with the colors predicted from the derived ages and metallicities.
Five UCDs and Strom417, a GC, have super-solar abundance ratio, [/Fe] +0.3 – +0.5, and one UCD has solar abundance ratio, [/Fe] 0.0. The super-solar [/Fe] abundances are typical of old stellar populations found in globular clusters and elliptical galaxies.
Virgo UCDs and typical present-day dE,N nuclei are different in that they have different [/Fe] abundance ratios and, therefore, have different formation histories.
The ages, metallicities and abundances of Virgo UCDs are similar to those found for GCs in the galaxies M49 and M87 in the Virgo Cluster.
UCDs generally have lower metallicities and older ages than dE nuclei: this is not consistent with the naive threshing model in which UCDs are identical to the present-day nuclei of dE galaxies.
Measurements of the near-IR CaT index suggest that Virgo UCDs have stellar populations more like those found in globular clusters than in dE and E galaxies.
-
4.
The Virgo and Fornax UCDs all have masses and mass-to-light ratios .
UCDs are more massive than transition objects of Haşegan et al. and all known GCs for which dynamical mass estimates are available.666The systems with dynamical masses are G1: (Meylan et al. 2001), Cen: (Meylan et al. 1995), NGC5128 GCs: (Martini & Ho 2004), transition objects of Haşegan et al. (2005): .
Although the UCDs are more massive than known globular clusters, they are within the theoretical limits for the most massive globular clusters formed in galaxies as large as M87 and NGC 1399 (see Formula 8 of Kravtsov & Gnedin 2005)777The mass of M87 within 32 kpc is according to Wu & Tremaine (2006) and the mass of NGC1399 within 50 kpc is as found by Richtler et al. (2004).. Recent simulations (Yahagi & Bekki 2005, Bekki & Yahagi 2006) confirm that globular clusters can escape the potential of these galaxies.
The UCD masses are close to the estimated masses of some young massive GCs (YMGCs) such as NGC7252:W3, NGC7252:W30 and NGC1316:G114 (Maraston et al. 2004, Bastian et al. 2006), whose origin is suggested to be by early mergers of lower mass stellar clusters (Kissler-Patig et al. 2006). As these objects evolve they will lose mass and their structural parameters will also change (e.g. Fellhauer & Kroupa 2005). It is not clear that they will still have the same masses (and other parameters) as UCDs after the very long evolution times demanded by our old age estimates for the Virgo UCDs.
The dynamical mass-to-light ratios for Virgo UCDs are consistent with the simple stellar population model predictions (by Maraston 2005) within the uncertainties. It implies that Virgo UCDs do not require dark matter to explain their mass-to-light ratios. This conclusion applies to the central region where we have velocity dispersion data covered by our spectroscopic observations. An increasing dark matter contribution towards larger radii can not be ruled out with the present data.
Note that whilst the structural properties and internal velocity dispersions have been measured for all the UCDs, the ages and metallicities (and the interpretation of the mass-to-light ratios) are limited to the Virgo UCDs for which we have this data. The high resolution spectra for Fornax UCDs used by Hilker et al. (2006) have too low S/N for the Lick index measurements. Also, no Lick standards were observed for the calibration onto the Lick/IDS system. Mieske et al. (2006) present [Fe/H] metallicities and H indices for 26 compact objects in Fornax, including UCD2, UCD3 and UCD4 and four more objects with luminosities similar to our five Fornax UCDs. The metallicities derived for Virgo UCDs are total metallicities [Z/H]. [Z/H] and [Fe/H] are related as follows: [Fe/H]=[Z/H]-0.94[/Fe] (Thomas et al. 2003). Assuming Fornax and Virgo UCDs have similar mean -abundances, [/Fe]=+0.3, the bright Fornax compact objects in Mieske et al. (2006) have mean metallicity [Z/H] -0.34, which is similar to the mean metallicity for Virgo UCDs. The H indices in Mieske et al. (2006) are not calibrated, so no reliable conclusions can be drawn, but the appearance at least is for the Fornax objects to have higher H (), hence younger mean ages compared to the Virgo UCDs. This suggests a difference in formation time, if not mechanism, for UCDs in the two galaxy clusters. However, we prefer to refrain from any firm conclusions on Fornax UCD origins until accurate age, metallicity and -abundance estimates are obtained for them; these should in turn be compared to the properties of Fornax Cluster globular clusters and dwarf galaxy nuclei. In the following discussion, our conclusions focus mainly on the Virgo UCDs.
The common feature in all the above results is that our detailed measurements of the internal UCD properties give values consistent with observed properties of globular clusters. In all the parameters we have investigated there is no evidence for any gap between globular clusters and UCDs. The ages, metallicities and abundances of the Virgo UCDs are similar to those found for GCs in the two brightest Virgo galaxies (M49 and M87). This suggests that UCDs and GCs could have the same formation epoch and the same star formation history. Theoretical work shows that such massive objects as UCDs could form in M87 and NCG 1399 and subsequently escape the host galaxy potential (Kravtsov & Gnedin 2005; Yahagi & Bekki 2005, Bekki & Yahagi 2006). The surface brightness structure of the UCDs is not different to that of globular clusters in the Milky Way and Magellanic Clouds. The mass-to-light ratios of the Virgo UCDs are consistent with simple stellar populations as in globular clusters.
We therefore conclude that the internal properties of Virgo UCDs are consistent with them being the high-mass/high-luminosity extreme of known globular cluster populations.
Some of our results, notably the fundamental plane projections are consistent with the formation of UCDs by the simple removal of the halo from the nuclei of nucleated dwarf galaxies. However the ages, metallicities and abundances for Virgo UCDs are not consistent with this simple stripping model. It might be consistent with more sophisticated models of the stripping process that include the effects of gas removal on the chemical evolution of the nuclei.
As we have shown that the Virgo UCDs are old, we note that definitive tests of theories of their formation by stripping processes or the evolution of merger-formed massive star clusters will need to consider the effects of gas processes (especially gas removal) over these long timescales.
References
- (1) Barmby, P., Holland, S., & Huchra, J.P. 2002, AJ, 123, 1937
- (2) Bastian, N., Saglia, R.P., Goudfrooij, P., Kissler-Patig, M., Maraston, C., Schweizer, F., & Zoccali, M. 2006, A&A, 448, 881
- (3) Bekki, K., Couch, W.J., & Drinkwater, M.J. 2001, ApJ, 522, L105
- (4) Bekki, K., Couch, W.J., Drinkwater, M.J., & Shioya, Y. 2003, MNRAS, 344, 399
- (5) Bekki, K., & Yahagi, H. 2006, MNRAS, 372, 1019
- (6) Bender, R., Burstein, D., & Faber, S.M. 1992, ApJ, 399, 462
- (7) Bruzual, G., & Charlot, S. 2003, MNRAS, 344, 1000
- (8) Burstein, D., Bender, R., Faber, S.M., & Nolthenius, R. 1997, AJ, 114, 1365
- (9) Cardiel, N., Gorgas, J., Cenarro, A.J., González, J.J. 1998, A&AS, 127, 597
- (10) Cenarro, A.J., Cardiel, N., Gorgas, J., Peletier, R.F., Vazdekis, A., & Prada, F. 2001, MNRAS, 326, 959
- (11) Choi, P.I., Guhathakurta, P., Johnston, K.V. 2002, AJ, 124, 310
- (12) Cohen, J.G., Blakeslee, J.P., & Ryzhov, A. 1998, ApJ, 496, 808
- (13) Cohen, J.G., Blakeslee, J.P., & Côté, P. 2003, ApJ, 592, 866
- (14) Cottrell, P.L., & Sneden, C. 1986, A&A, 161, 314
- (15) Davies, R.L., Sadler, E.M., & Peletier, R.F. 1993, MNRAS, 262, 650
- (16) Djorgovski, S.G., Gal, R.R., McCarthy, J.K., Cohen, J.G., de Carvalho, R.R., Meylan, G., Bendinelly, O., & Parmeggiani, G. 1997, ApJ, 474, L19
- (17) Drinkwater, M.J., Jones, J.B., Gregg, M.D., & Phillipps, S. 2000, PASA, 17, 227
- (18) Drinkwater, M.J., Gregg, M.D., Hilker, M., Bekki, K., Couch, W.J., Ferguson, H.C., Jones, J.B., & Phillipps, S. 2003, Nature, 423, 519
- (19) Drinkwater, M.J., Gregg, M.D., Couch, W.J., Ferguson, H.C., Hilker, M., Jones, J.B., Karick, A., & Phillipps, S. 2004, PASA, 21, 375
- (20) Elson, R.A.W., Fall, S.M., & Freeman, K.C. 1987, ApJ, 323, 54
- (21) Faber, S.M., Wegner, G., Burstein, D., Davies, R.L., Dressler, A., Lynden-Bell, D., & Terlevich, R.J. 1989, ApJS, 69, 763
- (22) Fellhauer, M., & Kroupa, P. 2002, MNRAS, 330, 642
- (23) Fellhauer, M., & Kroupa, P. 2005, MNRAS, 359, 223
- (24) Fellhauer, M. & Kroupa, P. 2006, MNRAS, 367, 1577
- (25) Freedman, W.L., Madore, B.F., Gibson, B.K., et al. 2001, ApJ, 553, 47
- (26) Geha, M., Guhathakurta, P., & van der Marel, R.P. 2002, AJ, 124, 3073
- (27) Geha, M., Guhathakurta, P., & van der Marel, R.P. 2003, AJ, 126, 1794
- (28) Gregg, M.D., & Minniti, D. 1997, PASP, 109, 1026
- (29) Hanes, D.A., Côté, P., Bridges, T.J., McLaughlin, D.E., Geisler, D., Harris, G.L.H., Hesser, J.E., & Lee, M.G. 2001, ApJ, 559, 812
- (30) Harris, W.E. 1996, AJ, 112, 1487
- (31) Harris, W.E., Harris, G.L.H., Holland, S.T., & McLaughlin, D.E. 2002, AJ, 124, 1435
- (32) Haşegan, M., Jordán, A., Côté, P., et al. 2005, ApJ, 627, 203
- (33) Hilker, M., Infante, L., Vieira, G., Kissler-Patig, M., & Richtler, T. 1999, A&AS, 134, 75
- (34) Hilker, M., Baumgardt, H., Infante, L., Drinkwater, M., Evstigneeva, E., Gregg, M. 2006, A&A, in press
- (35) Jones, J. B., Drinkwater, M. J., Jurek, R.; Phillipps, S., Gregg, M. D., Bekki, K., Couch, W. J., Karick, A., Parker, Q. A., & Smith, R. M. 2006, AJ, 131, 312
- (36) Karick, A.M., Drinkwater, M.J., & Gregg, M.D. 2003, MNRAS, 344, 188
- (37) King, I.R. 1966, AJ, 71, 64
- (38) Kissler-Patig, M., Jordán, A., & Bastian, N. 2006, A&A, 448, 1031
- (39) Kravtsov, A.V., & Gnedin, O.Y. 2005, ApJ, 623, 650
- (40) Lauer, T.R., Ajhar, E.A., Byun, Y.-I., Dressler, A., Faber, S.M., Grillmair, C., Kormendy, J., Richstone, D., & Tremaine, S 1995, AJ, 110, 2622
- (41) Luck, R.E., & Challener, S.L. 1995, AJ, 110, 2968
- (42) Mackey, A.D. & van den Bergh, S. 2005, MNRAS, 360, 631
- (43) Maraston, C., Bastian, N., Saglia, R.P., Kissler-Patig, M., Schweizer, F., & Goudfrooij, P. 2004, A&A, 416, 467
- (44) Maraston, C. 2005, MNRAS, 362, 799
- (45) van der Marel, R.P. 1994, MNRAS, 270, 271
- (46) Martini, P., & Ho, L.C. 2004, ApJ, 610, 233
- (47) McLaughlin, D. E., & van der Marel, R. P. 2005, ApJS, 161, 304
- (48) McWilliam, A. 1990, ApJS, 74, 1075
- (49) Meylan, G., Mayor, M., Duquennoy, A., & Dubath, P. 1995, A&A, 303, 761
- (50) Meylan, G., Sarajedini, A., Jablonka, P., Djorgovski, S.G., Bridges, T., & Rich, R.M. 2001, AJ, 122, 830
- (51) Michielsen, D., de Rijcke, S., Dejonghe, H., Zeilinger, W.W., & Hau, G.K.T. 2003, ApJ, 597, L21
- (52) Mieske, S., Hilker, M., & Infante, L. 2002, A&A, 383, 823
- (53) Mieske, S., Infante, L., Benitez, N., et al. 2004, AJ, 128, 1529
- (54) Mieske, S., Hilker, M., Infante, L., & Jordán, A. 2006, AJ, 131, 2442
- (55) Mihalas, D., & Binney, J. 1981, Galactic Astronomy, San Francisco
- (56) Minniti, D., Kissler-Patig, M., Goudfrooij, P., & Meylan, G. 1998, AJ, 115, 121
- (57) Noyola, E., & Gebhardt. K. 2003, RevMexAA (Serie de Conferencias), 18, 78
- (58) Peng, C.Y., Ho, L.C., Impey, C.D., & Rix, H.-W. 2002, AJ, 124, 266
- (59) Peterson, R.C. 1978, ApJ, 224, 595
- (60) Peterson, R.C., & King, I.R. 1975, AJ, 80, 427
- (61) Richtler, T., Dirsch, B., Gebhardt, K. et al. 2004, AJ, 127, 2094
- (62) Phillipps, S., Drinkwater, M. J., Gregg, M. D., & Jones, J. B. 2001, ApJ, 560, 201
- (63) Saglia, R.P., Maraston, C., Thomas, D., Bender, R., & Colless, M. 2002, ApJ, 597, L13
- (64) Schlegel, D.J., Finkbeiner, D.P., & Davis, M. 1998, ApJ, 500, 525
- (65) Sirianni, M., Jee, M.J., Benitez, N., et al. 2005, PASP, 117, 1049
- (66) Spitzer, L. 1987, Dynamical Evolution of Globular Clusters (Princeton: Princeton Univ. Press)
- (67) Strom, S.E., Forte, J.C., Harris, W.E., Strom, K.E., Wells, D.C., & Smith, M.G. 1981, ApJ, 245, 416
- (68) Thomas, D., Maraston, C., & Bender, R. 2003, MNRAS, 339, 897
- (69) Thomas, D., Maraston, C., & Korn, A. 2004, MNRAS, 351, L19
- (70) Tonry, J., & Davis, M. 1979, AJ, 84, 1511
- (71) Trager, S.C., Faber, S.M., Worthey, G., & González, J.J. 2000, AJ, 119, 1645
- (72) Queloz, D., Dubath, P., & Pasquini, L. 1995, A&A, 300, 31
- (73) Valdes F., Gupta R., Rose J.A., Singh H.P., & Bell D.J. 2004, ApJS, 152, 251
- (74) Vazdekis, A., Cenarro, A.J., Gorgas, J., Cardiel, N., & Peletier, R.F. 2003, MNRAS, 340, 1317
- (75) Worthey, G., Faber, S.M., González, J.J., & Burstein, D. 1994, ApJS, 94, 687
- (76) Wu, X., & Tremaine, S. 2006, ApJ, 643, 210
- (77) Yahagi, H., & Bekki, K. 2005, MNRAS, 364L, 86
- (78) van Zee, L., Barton, E.J., & Skillman, E.D. 2004, AJ, 128, 2797


| Name | Object type | R.A.(J2000) | Dec.(J2000) | Exposure times |
|---|---|---|---|---|
| (h : m : s) | (::) | (s) | ||
| Strom417 | M87 GC | 12:31:01.29 | +12:19:25.6 | |
| VUCD1 | UCD | 12:30:07.61 | +12:36:31.1 | |
| VUCD3/Strom547 | UCD / M87 GC | 12:30:57.40 | +12:25:44.8 | |
| VUCD4 | UCD | 12:31:04.51 | +11:56:36.8 | |
| VUCD5 | UCD | 12:31:11.90 | +12:41:01.2 | |
| VUCD6 | UCD | 12:31:28.41 | +12:25:03.3 | |
| VUCD7 | UCD | 12:31:52.93 | +12:15:59.5 | |
| VCC1407 | dE,N | 12:32:02.70 | +11:53:25.0 | |
| NGC4486B | E | 12:30:31.92 | +12:29:27.4 |
| Template | SpType | [Fe/H] | Ref. | |
|---|---|---|---|---|
| 1 | HD040460 | K1III | -0.50 | 2 |
| 2 | HD048433 | K1III | -0.26 | 1 |
| 3 | HD137704 | K4III | -0.43 | 1 |
| 4 | HD139195 | K0III | -0.17 | 1 |
| 5 | HD139669 | K5III | -0.13 | 5 |
| 6 | HD141680 | G8III | -0.28 | 1 |
| 7 | HD142574 | M0III | … | … |
| 8 | HD143107 | K2III | -0.32 | 1 |
| 9 | HD145148 | K1.5IV | … | … |
| 10 | HD145675 | K0V | 0.31 | 3 |
| 11 | HD147677 | K0III | -0.08 | 1 |
| 12 | HD148513 | K4III | 0.04/-0.31 | 1/4 |
| 13 | HD149161 | K4III | -0.23 | 1 |
References. — (1) McWilliam 1990; (2) Cottrell & Sneden 1986; (3) Peterson 1978; (4) Luck & Challener 1995; (5) Valdes et al. 2004.
| Direct Fitting | Cross Correlation | ||||
|---|---|---|---|---|---|
| Object | vhelio | Templates | vhelio | ||
| VUCD1 | 1227.8 1.7 | 33.8 1.7 | 6 | 1225.4 3.7 | 34.0 1.6 |
| VUCD3/Strom547 | 710.6 3.5 | 37.7 1.4 | 2,8 | 711.4 3.4 | 37.8 1.6 |
| VUCD4 | 919.7 1.7 | 23.9 2.2 | 6 | 916.5 4.2 | 21.3 2.2 |
| VUCD5 | 1293.1 1.7 | 27.4 1.7 | 6 | 1290.3 3.0 | 24.9 2.0 |
| VUCD6 | 2105.3 1.7 | 24.6 1.8 | 6 | 2101.7 3.9 | 22.2 2.2 |
| VUCD7 | 988.3 2.7 | 36.7 3.7 | 6 | 985.7 5.0 | 35.6 1.6 |
| Strom417 | 1863.5 1.6 | 26.4 2.1 | 6 | 1860.6 3.0 | 25.8 2.0 |
| VCC1407 | 1018.9 3.2 | 29.3 2.5 | 1,2,3,4,6 | 1019.4 5.7 | 26.6 2.1 |
| NGC4486B | 1558.4 4.2 | 211.3 4.8 | 2,3,7,8,11,12 | 1546.9 32.8 | 198.1 15.5 |
Note. — In direct-fitting method, the best fitting template stars were used to determine velocities and velocity dispersions. The best fitting templates (as numbered in Table 2) are given in the “Templates” column. and vhelio are the mean values using all observations of the best fitting template(s). In cross-correlation method, and vhelio are the mean values using all stellar templates.
| Direct Fitting | Cross Correlation | ||||
|---|---|---|---|---|---|
| Object | vhelio | Templates | vhelio | ||
| VUCD1 | 1219.5 1.3 | 34.4 1.6 | 2 | 1225.1 9.3 | 32.8 6.1 |
| VUCD3/Strom547 | 716.4 1.2 | 46.5 1.6 | 9 | 717.4 12.7 | 51.4 4.7 |
| VUCD4 | 912.5 1.5 | 23.9 1.8 | 2 | 916.8 5.8 | 15.7 8.3 |
| VUCD5 | 1285.8 1.0 | 28.9 1.5 | 2 | 1291.8 6.3 | 26.0 6.8 |
| VUCD6 | 2096.7 1.4 | 25.7 1.8 | 2 | 2103.1 6.8 | 20.4 7.6 |
| VUCD7 | 980.7 3.5 | 39.2 4.4 | 2 | 986.6 7.7 | 33.3 6.0 |
| Strom417 | 1857.1 1.4 | 28.8 1.6 | 2 | 1863.4 6.7 | 25.1 6.9 |
| VCC1407 | 1018.8 3.3 | 31.4 2.7 | 1,2,6,11 | 1020.2 7.5 | 28.5 6.5 |
| NGC4486B | 1556.3 8.7 | 199.1 5.0 | 2,6,8,9 | 1558.7 52.1 | 230.4 26.3 |
Note. — In direct-fitting method, the best fitting template stars were used to determine velocities and velocity dispersions. The best fitting templates (as numbered in Table 2) are given in the “Templates” column. and vhelio are the mean values using all observations of the best fitting template(s). In cross-correlation method, and vhelio are the mean values using all stellar templates.
| Object | vhelio | |
|---|---|---|
| Strom417 | 1860.3 1.5 | 27.6 1.9 |
| VUCD1 | 1223.7 1.5 | 34.1 1.7 |
| VUCD3/Strom547 | 713.5 2.4 | 42.1 1.5 |
| VUCD4 | 916.1 1.6 | 23.9 2.0 |
| VUCD5 | 1289.5 1.4 | 28.2 1.6 |
| VUCD6 | 2101.0 1.6 | 25.2 1.8 |
| VUCD7 | 984.5 3.1 | 38.0 4.1 |
| VCC1407 | 1018.9 3.3 | 30.4 2.6 |
| NGC4486B | 1557.4 6.5 | 205.2 4.9 |
| Name | |||
|---|---|---|---|
| (mag) | (mag) | (mag) | |
| VUCD1 | 18.66 | -12.26 | 0.96 |
| VUCD3/Strom547 | 18.34 | -12.58 | 1.27 |
| VUCD4 | 18.62 | -12.30 | 0.99 |
| VUCD5 | 18.60 | -12.32 | 1.11 |
| VUCD6 | 18.82 | -12.10 | 1.02 |
| VUCD7 | 17.48 | -13.44 | 1.13 |
Note. — The band apparent magnitude, , is determined as described in Section 3 and is corrected for foreground dust extinction (Schlegel et al. 1998). The absolute magnitude, , is computed assuming a Virgo Cluster distance modulus of 30.92 mag (Freedman et al. 2001). The color is reddening corrected.
| Object | R.A.(J2000) | Dec.(J2000) | ||
|---|---|---|---|---|
| (h : m : s) | (::) | (mag) | (mag) | |
| UCD1 | 3:37:03.30 | -35:38:04.6 | 19.20 | -12.19 |
| UCD2 | 3:38:06.33 | -35:28:58.8 | 19.12 | -12.27 |
| UCD3 | 3:38:54.10 | -35:33:33.6 | 17.82 | -13.57 |
| UCD4 | 3:39:35.95 | -35:28:24.5 | 18.94 | -12.45 |
| UCD5 | 3:39:52.58 | -35:04:24.1 | 19.40 | -11.99 |
| FCC303 | 3:45:14.08 | -36:56:12.4 | 15.90 | -15.49 |
Note. — The band apparent magnitude, , is determined as described in Section 3 and is corrected for foreground dust extinction (Schlegel et al. 1998). The absolute magnitude, , is computed assuming a Fornax Cluster distance modulus of 31.39 mag (Freedman et al. 2001).
| VUCD1 | VUCD3 | VUCD4 | VUCD5 | VUCD6 | VUCD7 core | VUCD7 haloaaThe first number is for King+Sersic model, the second number is for Sersic+Sersic model. | |
|---|---|---|---|---|---|---|---|
| 15.4 | 28.1 | 29.4 | 22.5 | 22.1 | … | … | |
| NUKER | |||||||
| (F606W) | 0.39 | 0.41 | 0.35 | 0.38 | 0.24 | … | … |
| (F814W) | 0.38 | 0.43 | 0.34 | 0.36 | 0.27 | … | … |
| 13.3 | … | … | 19.2 | … | … | … | |
| 18.49 | … | … | 18.55 | … | … | … | |
| 6.3 | 73.3 | 9.1 | 19.3 | 5.2 | … | … | |
| 16.42 | 22.00 | 17.24 | 18.73 | 16.45 | … | … | |
| 2.52 | 1.95 | 3.92 | 0.99 | 19.48 | … | … | |
| 2.69 | 3.17 | 2.34 | 4.02 | 2.24 | … | … | |
| 0.23 | 1.53 | 0.33 | 0.00 | 0.50 | … | … | |
| 0.06 | 0.15 | 0.15 | 0.01 | 0.04 | … | … | |
| SERSIC | |||||||
| (F606W) | 0.48 | 0.42 | 0.40 | 0.39 | 0.29 | 0.37 | 0.37/0.37 |
| (F814W) | 0.44 | 0.45 | 0.38 | 0.38 | 0.31 | 0.37 | 0.36/0.37 |
| 11.1 | 64.3 | 19.3 | 18.1 | 12.9 | 9.2 | 214.1/223.4 | |
| 18.75 | 17.69 | 18.85 | 18.64 | 19.05 | 18.68 | 18.01/17.85 | |
| n | 2.2 | 10.9 | 2.1 | 1.9 | 3.1 | 2.2 | 1.4/2.1 |
| 0.07 | 0.16 | 0.16 | 0.01 | 0.04 | 0.12 | 0.05/0.05 | |
| KING, | |||||||
| (F606W) | 0.45 | 0.55 | 0.37 | 0.37 | 0.27 | 0.37 | … |
| (F814W) | 0.42 | … | 0.36 | 0.37 | 0.29 | 0.36 | … |
| 11.2 | … | 21.8 | 17.8 | 15.2 | 10.4 | … | |
| 18.66 | … | 18.54 | 18.59 | 18.93 | 18.42 | … | |
| 3.6 | 1.9 | 5.8 | 6.6 | 2.7 | 3.1 | … | |
| 124.0 | 302.7 | 172.5 | 355.6 | 130.2 | … | ||
| c | 1.54 | … | 1.71 | 1.42 | 2.12 | 1.62 | … |
| 14.91 | 13.79 | 15.96 | 15.98 | 14.98 | 14.38 | … | |
| 0.06 | 0.17 | 0.15 | 0.01 | 0.04 | 0.11 | … | |
| KING with variable : | |||||||
| (F606W) | 0.41 | 0.53 | 0.36 | 0.37 | 0.25 | … | … |
| (F814W) | 0.40 | … | 0.35 | 0.37 | 0.28 | … | … |
| 3.74 | 0.63 | 3.95 | 2.24 | 4.45 | … | … | |
| 11.3 | 18.7 | 22.0 | 17.9 | 14.8 | … | … | |
| 18.63 | 18.18 | 18.52 | 18.60 | 18.84 | … | … | |
| 4.3 | 1.8 | 6.7 | 6.7 | 3.2 | … | … | |
| 360.0 | 247.5 | 1217.4 | 200.5 | 2352.5 | … | … | |
| c | 1.92 | 2.14 | 2.26 | 1.48 | 2.87 | … | … |
| 14.68 | 13.78 | 15.76 | 15.97 | 14.81 | … | … | |
| 0.06 | 0.17 | 0.15 | 0.01 | 0.04 | … | … | |
| Best model | N | N | N | N | N | K | S |
Note. — All the parameters are the mean of the two passbands, and , except King models for VUCD3 (see explanation in the text). Units: , , , and are in pc; and are in mag arcsec-2; is in mag. , and are corrected for the extinction in our Galaxy.
| UCD1 | UCD2 | UCD3 | UCD3 | UCD3 | UCD4 | UCD5 | UCD5 | FCC303 | FCC303 | |
|---|---|---|---|---|---|---|---|---|---|---|
| core | haloaaThe first number is for King+Sersic model, the second number is for Sersic+Sersic model. | core | haloaaThe first number is for King+Sersic model, the second number is for Sersic+Sersic model. | core | haloaaThe first number is for King+Sersic model, the second number is for Sersic+Sersic model. | |||||
| 33.2 | 29.5 | 80.7 | … | … | 31.3 | … | … | … | … | |
| NUKER | ||||||||||
| 0.61 | 0.64 | 0.51 | … | … | 0.50 | … | … | … | … | |
| … | … | … | … | … | … | … | … | … | … | |
| … | … | … | … | … | … | … | … | … | … | |
| 36.7 | 4.3 | 318.7 | … | … | 7.3 | … | … | … | … | |
| 20.67 | 16.53 | 24.38 | … | … | 16.92 | … | … | … | … | |
| 0.34 | 0.73 | 1.90 | … | … | 20.00 | … | … | … | … | |
| 3.03 | 2.38 | 7.04 | … | … | 2.13 | … | … | … | … | |
| 0.91 | 0.58 | 1.10 | … | … | 0.88 | … | … | … | … | |
| 0.18 | 0.01 | 0.03 | … | … | 0.05 | … | … | … | … | |
| SERSIC | ||||||||||
| 0.60 | 0.66 | … | 0.47 | 0.47/0.47 | 0.69 | 0.47 | 0.47/0.47 | 1.03 | 1.03/1.03 | |
| 36.9 | 26.6 | … | 8.6 | 106.6/103.2 | 24.1 | 6.0 | 134.5/135.5 | 25.2 | 696.3/692.8 | |
| 19.01 | 19.03 | … | 20.29 | 17.98/17.94 | 18.97 | 20.45 | 19.54/19.58 | 18.76 | 15.95/15.95 | |
| n | 9.9 | 6.8 | … | 1.7 | 1.3/1.5 | 5.5 | 1.1 | 6.9/6.3 | 10.7 | 0.6/0.6 |
| 0.19 | 0.01 | … | 0.02 | 0.03/0.03 | 0.05 | 0.24 | 0.16/0.15 | 0.03 | 0.10/0.10 | |
| KING, | ||||||||||
| 0.67 | 0.63 | … | 0.47 | … | 0.52 | 0.47 | … | 1.03 | … | |
| 48.9 | 28.3 | … | 10.9 | … | 26.0 | 6.0 | … | 25.9 | … | |
| 18.71 | 18.98 | … | 20.00 | … | 18.88 | 20.19 | … | 18.78 | … | |
| 1.8 | 2.3 | … | 3.6 | … | 2.8 | 4.0 | … | 1.2 | … | |
| 5761.2 | 1457.5 | … | 119.2 | … | 987.6 | 30.7 | … | 2403.9 | … | |
| c | 3.51 | 2.80 | … | 1.52 | … | 2.55 | 0.89 | … | 3.30 | … |
| 14.21 | 14.70 | … | 15.74 | … | 14.89 | 15.13 | … | 13.32 | … | |
| 0.18 | 0.01 | … | 0.03 | … | 0.05 | 0.24 | … | 0.03 | … | |
| KING with variable : | ||||||||||
| 0.64 | 0.62 | … | … | … | 0.51 | … | … | … | … | |
| 0.74 | 1.23 | … | … | … | 3.32 | … | … | … | … | |
| 22.4 | 23.1 | … | … | … | 29.5 | … | … | … | … | |
| 19.00 | 19.10 | … | … | … | 18.82 | … | … | … | … | |
| 1.8 | 2.2 | … | … | … | 3.0 | … | … | … | … | |
| 378.0 | 487.1 | … | … | … | 4501.2 | … | … | … | … | |
| c | 2.32 | 2.35 | … | … | … | 3.18 | … | … | … | … |
| 14.21 | 14.67 | … | … | … | 14.94 | … | … | … | … | |
| 0.18 | 0.01 | … | … | … | 0.05 | … | … | … | … | |
| Best model | S | gen. K | K+S/S+S | K | S | N | K/S | S | K/S | S |
Note. — Units: , , , and are in pc; and are in mag arcsec-2; is in mag. , and are corrected for the extinction in our Galaxy.
| (pc) | (mag) | (mag arcsec-2) | ||
|---|---|---|---|---|
| Virgo: | ||||
| VUCD1 | 11.3 | 18.66 | 16.58 | 0.06 |
| VUCD3 | 18.7 | 18.34 | 17.34 | 0.15 |
| VUCD4 | 22.0 | 18.62 | 17.98 | 0.15 |
| VUCD5 | 17.9 | 18.60 | 17.51 | 0.01 |
| VUCD6 | 14.8 | 18.82 | 17.32 | 0.04 |
| VUCD7 | 96.8 | 17.48 | 20.06 | … |
| VUCD7 core | 10.4 | 18.42 | 16.15 | 0.11 |
| VUCD7 halo | 214.1 | 18.01 | 22.31 | 0.05 |
| Fornax: | ||||
| UCD1 | 22.4 | 19.20 | 18.13 | 0.19 |
| UCD2 | 23.1 | 19.12 | 18.12 | 0.01 |
| UCD3 | 89.7 | 17.82 | 19.76 | … |
| UCD3 core | 10.9 | 20.00 | 17.36 | 0.03 |
| UCD3 halo | 106.6 | 17.98 | 20.30 | 0.03 |
| UCD4 | 29.5 | 18.94 | 18.47 | 0.05 |
| UCD5 | 31.2 | 19.40 | 19.05 | … |
| UCD5 core | 6.0 | 20.19 | 16.25 | 0.24 |
| UCD5 halo | 134.5 | 19.54 | 22.37 | 0.16 |
| FCC303 | 660.0 | 15.90 | 22.18 | … |
| FCC303 core | 25.9 | 18.78 | 18.03 | 0.03 |
| FCC303 halo | 696.3 | 15.95 | 22.35 | 0.10 |
| () | () | |||
|---|---|---|---|---|
| Nuker: | ||||
| VUCD1 | ||||
| VUCD3 | ||||
| VUCD4 | ||||
| VUCD5 | ||||
| VUCD6 | ||||
| Sersic: | ||||
| VUCD1 | ||||
| VUCD3 | ||||
| VUCD4 | ||||
| VUCD5 | ||||
| VUCD6 | ||||
| King, : | ||||
| VUCD1 | ||||
| VUCD4 | ||||
| VUCD5 | ||||
| VUCD6 | ||||
| Strom417 | ||||
| King with variable : | ||||
| VUCD1 | ||||
| VUCD3 | ||||
| VUCD4 | ||||
| VUCD5 | ||||
| VUCD6 | ||||
| King core + Sersic halo: | ||||
| VUCD7 | ||||
Note. — – central velocity dispersion, – global velocity dispersion, – mass, – mass-to-light ratio.
| () | () | |||
|---|---|---|---|---|
| VUCD1 | ||||
| VUCD3 | ||||
| VUCD4 | ||||
| VUCD5 | ||||
| VUCD6 | ||||
| VUCD7 | ||||
| Strom417 |
Note. — The values are based on the generalized King models for the one-component fits and King+Sersic models for the two-component fits.
| () | () | () | () | |
|---|---|---|---|---|
| VUCD1 | ||||
| VUCD3 | … | … | ||
| VUCD4 | ||||
| VUCD5 | ||||
| VUCD6 | ||||
| VUCD7 | … | … | ||
| Strom417 |
| age range | met. range | |||||||
|---|---|---|---|---|---|---|---|---|
| (Gyr) | (dex) | (mag) | (mag) | (mag) | () | () | () | |
| VUCD1 | 8…15 | … | 0.96 | 0.91…1.16 | 0.89…1.13 | |||
| VUCD3 | 12…15 | … | 1.27 | 1.19…1.30 | 1.16…1.27 | |||
| VUCD4 | 8…15 | … | 0.99 | 0.91…1.16 | 0.89…1.13 | |||
| VUCD5 | 8…15 | … | 1.11 | 1.07…1.22 | 1.05…1.20 | |||
| VUCD6 | 8…15 | … | 1.02 | 0.91…1.16 | 0.89…1.13 | |||
| VUCD7 | 8…15 | … | 1.13 | 0.91…1.16 | 0.89…1.13 | |||
| Strom417 | 4…12 | … | … | 0.82…1.19 | 0.81…1.16 |
Note. — “sp” denotes results for a Salpeter IMF, “kr” – for a Kroupa IMF.
| H | Mgb | Fe5270 | Fe5335 | Fe | ||
|---|---|---|---|---|---|---|
| VUCD1 | 2.06 0.14 | 2.20 0.13 | 1.56 0.15 | 1.19 0.17 | 1.38 0.16 | 1.79 0.15 |
| VUCD3/Strom547 | 1.40 0.14 | 4.99 0.12 | 2.69 0.13 | 2.37 0.15 | 2.53 0.14 | 3.60 0.14 |
| VUCD4 | 2.16 0.18 | 1.42 0.16 | 1.41 0.18 | 1.18 0.21 | 1.30 0.20 | 1.38 0.17 |
| VUCD5 | 1.82 0.17 | 3.30 0.15 | 2.11 0.17 | 1.90 0.19 | 2.01 0.18 | 2.60 0.17 |
| VUCD6 | 2.27 0.16 | 1.58 0.15 | 1.40 0.17 | 0.87 0.19 | 1.14 0.18 | 1.41 0.17 |
| VUCD7 | 1.90 0.32 | 2.45 0.29 | 1.75 0.33 | 1.09 0.38 | 1.42 0.36 | 1.96 0.33 |
| Strom417 | 2.18 0.23 | 2.86 0.20 | 1.82 0.23 | 1.47 0.25 | 1.65 0.24 | 2.22 0.23 |
| VCC1407 | 2.08 0.24 | 2.20 0.21 | 1.63 0.24 | 1.53 0.27 | 1.58 0.26 | 1.88 0.24 |
| NGC4486B | 1.39 0.04 | 5.24 0.04 | 2.93 0.04 | 2.60 0.05 | 2.77 0.05 | 3.86 0.04 |
| Index | Lick–ESI | rms scatter | Lick rms |
|---|---|---|---|
| (units) | per observ. | ||
| H | 0.00 | 0.12 | 0.22 |
| Mgb | -0.13 | 0.05 | 0.23 |
| Fe5270 | -0.04 | 0.09 | 0.28 |
| Fe5335 | -0.08 | 0.21 | 0.26 |
Note. — The mean offsets were calculated as average differences between the published index values and our measurements for all observations of 9 calibration stars. The outliers (1 or 2 for each index) were excluded. Rms scatter about the mean is also given. The rms uncertainty per observation of the Lick calibrators (Worthey et al. 1994) is given in the last column.
| CaT | |
|---|---|
| VUCD1 | 7.51 0.32 |
| VUCD3/Strom547 | 6.92 0.27 |
| VUCD4 | 5.71 0.45 |
| VUCD5 | 7.97 0.35 |
| VUCD6 | 6.13 0.41 |
| VUCD7 | 6.37 0.71 |
| Strom417 | 8.62 0.45 |
| VCC1407 | 6.90 0.51 |
| NGC4486B | 7.32 0.09 |