A highly-collimated SiO jet in the HH212 protostellar outflow
Abstract
We mapped the inner 40 of the HH212 Class 0 outflow in SiO(2–1), SiO(5–4) and continuum using the Plateau de Bure interferometer in its extended configurations. The unprecedented angular resolution (down to 034) allows accurate comparison with a new, deep H2 image obtained at the VLT. The SiO emission is confined to a highly-collimated bipolar jet (width 035) along the outflow axis. The jet can be traced down to within 500 AU of the protostar, in a region that is heavily obscured in H2 images. Where both species are detected, SiO shows the same overall kinematics and structure as H2, indicating that both molecules are tracing the same material. We find that the high-velocity SiO gas is not tracing a wide-angle wind but is already confined to a flow inside a narrow cone of half-opening angle 6 at 500 AU from the protostar. Transverse cuts reveal no velocity gradient compatible with jet rotation above 1 km s-1, in contrast to previous claims based on H2 spectra.
1 Introduction
The launching of jets from young stars is one of the most enigmatic and intriguing phenomena in astrophysics. One fundamental problem to which jets are believed to provide a solution is the removal of angular momentum from the central accreting system, which is required to permit low angular momentum material to fall onto the star. Recent optical observations (e.g. Bacciotti et al., 2002) suggest that atomic jets from evolved T-Tauri stars may indeed transport angular momentum away from the inner regions of the accretion disk. Is the same mechanism at the origin of the molecular jet counterparts observed when the protostar is still deeply embedded in its natal high-density core? To address this question, we have investigate HH212 in Orion ( = 460 pc), a highly symmetric bipolar H2 jet (Zinnecker et al., 1998), associated with a collimated CO outflow (Lee et al., 2006), and driven by a low-luminosity Class 0 protostar, IRAS05413–0104. HH212 provides an optimal situation in which to study jet kinematics, since it lies close to the plane of the sky (4; Claussen et al., 1998), shows hints of rotation in one H2 knot (Davis et al., 2000), and is surrounded by a compact ammonia core rotating about an axis aligned with the jet (Wiseman et al., 2001). As a tracer, we used SiO, which is associated with shocks and generally suffers minimal contamination from infalling envelopes or swept-up cavities (Guilloteau et al., 1992; Hirano et al., 2006).
2 Observations
The SiO observations of HH212 were obtained in January-March 2006 with the IRAM Plateau de Bure Interferometer (PdBI) in France. Two 6-element configurations were used: the new extended A configuration, which includes baselines from 136 m up to 760 m, and the new B configuration, with baselines from 88 m to 452 m. The dual-channel receivers and the correlator were tuned to simultaneously observe the SiO = 2–1 line at 86.847 GHz (resolution: 0.13 km s-1; bandwidth: 70 km s-1) and the = 5–4 line at 217.105 GHz (0.11 and 55 km s-1). Continuum emission at both frequencies was also measured. Amplitude and phase were calibrated by observing 0528+134 and 0605085. The weather conditions were excellent (phase noise rms of 30∘ at 86 GHz on the 760 m baselines), leading to a radio seeing of 035. The flux density scale was derived by observing 3C 84 and 3C 279, with an uncertainty of 25%. Images were produced using natural weighting, and restored with clean beams of (PA=22∘) at 3.5 mm, and of (PA=21∘) at 1.4 mm, using the GILDAS software. The high degree of elongation of the beam is due to the zero declination of the source. However, the spatial resolution is highest perpendicular to the jet direction, making the present observations ideal for the study of the jet collimation and kinematics.
A new, deeper, and higher spatial resolution NIR image of HH212 was obtained using ISAAC on the ESO Very Large Telescope (VLT), Paranal, Chile on November 12, 2005 under good conditions. Although the knots have proper motions of 100–200 km s-1 (McCaughrean et al., 2002), the small epoch difference to the SiO data ensures that the knots have moved only 0025, thus facilitating an comparison between the two data sets. A series of images were taken through a 1% wide filter centred on the v=1–0 S(1) line of H2 at 2.122 m. with a total integration time of 32 minutes per pixel after mosaicing. The image scale was 0147 pixel-1. and the spatial resolution is 035 FWHM, similar to our SiO(5–4) map. Accurate astrometry (014 rms) was derived via 21 stars in common with the 2MASS Point Source Catalog. The images have not been continuum-subtracted and thus stellar sources are visible. However, the HH212 jet itself consists almost exclusively of shocked H2 line emission and thus there is no confusion along the jet axis.
3 Results and Discussion
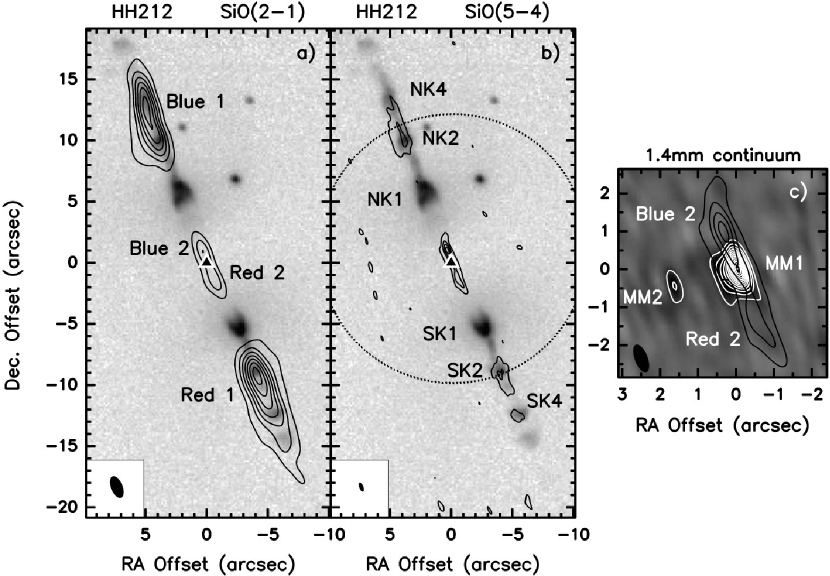
Emission maps of SiO = 2–1 and 5–4 are shown in Fig. 1a-b, superimposed onto the nearly contemporaneous H2 image. The SiO emission is confined to a highly collimated bipolar jet, located along the main outflow axis. The red- and blue-shifted lobes consist of two symmetric pairs of bullets: an outer pair (Blue 1 and Red 1) that follows the H2 intensity distribution beyond 10 from the driving source, and a new inner pair within of the source (Blue 2 and Red 2), with no H2 counterpart. Figure 1c shows the inner 5 of the 1.4 mm continuum map, with the SiO(5–4) emission superimposed.
3.1 Continuum sources
The 1.4 mm continuum map (Fig. 1c) shows a bright source (hereafter called MM1) at position = 05h 43m 5141, = –01 02 53160, in excellent agreement with the VLA position at 3.5 cm reported by Galván-Madrid et al. (2004). Comparison with the SiO(5–4) map clearly indicates that MM1 is the driving source of the molecular jet. In addition, we have a tentative detection at S/N 6 ( 4 mJy) of a secondary peak (hereafter MM2) at =+16, =–05, which could trace an embedded companion. Only MM1 is bright enough to be detected at 3.5 mm, with a flux of 6 mJy. Gaussian fitting in the UV plane at 1.4 mm shows that MM1 is associated with an unresolved peak ( 026) with a faint extension towards SE. The integrated flux at 1.4 mm is 33 mJy, significantly lower than the 110 mJy reported by Lee et al. (2006) in a 25 beam, indicating that most of the envelope emission has been resolved out by the PdBI. Contamination by free-free emission from the jet is negligible: if we extrapolate the flux measured by the VLA at 3.5 cm (Galván-Madrid et al., 2004) with a typical slope, the expected contribution is only 0.16 mJy at 3.5 mm. Hence we are dominated by dust continuum. The 1.4 mm flux corresponds to a mean surface brightness of 3.4 K in our beam. Since envelopes and disks are not elongated along the jet axis, the source size is less than 026 026 and thus the true brightness temperature is quite high: 13 K. The spectral slope between 1.4 mm and 3.5 mm, derived from UV data, is 2. Both facts seem to indicate that dust emission is close to optically thick at 1.4 mm. This would suggest that the unresolved mm peak is not tracing the inner parts of the envelope, but a circumstellar disk viewed close to edge-on. The disk diameter would be 026 = 117 AU.
3.2 The inner SiO bipolar jet
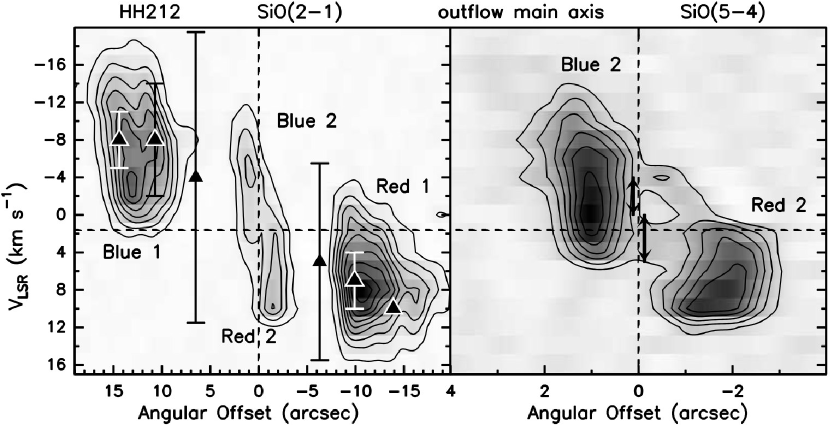
Our high resolution maps reveal a small-scale pair of SiO emission knots emerging from MM1 and extending out to 1–2 = 500–1000 AU (Fig. 1c). No H2 counterpart is visible, as the whole structure lies entirely in the high extinction region around the source. The beam-deconvolved transversal size of the two lobes (Blue 2/Red 2) is 035, and are thus much more collimated than the hourglass-shaped bipolar cavity seen in 13CO on similar scales by Lee et al. (2006). Position-Velocity (PV) diagrams along the jet axis (Fig. 2) further show that the SiO emission extends to high velocities of 10 km s-1 from the ambient velocity (+1.6 km s-1; Wiseman et al., 2001), compared to only 1.7 km s-1 for 13CO (Lee et al., 2006). Hence the SiO lobes include a narrower and faster jet-like component distinct from the swept-up cavity. The maximum radial velocity is similar to the typical centroid velocity of H2 knots further out (see Fig. 2), arguing that the high-velocity SiO is probably tracing the base of the large-scale ( 0.5 pc) molecular jet. Correction for inclination (4 to the plane of the sky; Claussen et al., 1998) gives a full jet speed 140 km s-1, comparable to the proper motion of H2 knots (McCaughrean et al., 2002). Inner SiO knots were also recently imaged in HH211 down to from the protostar (Hirano et al., 2006; Gueth et al., 2006). Hence SiO appears to be a powerful tracer of the jet base in Class 0 sources.
Hirano et al. (2006) found broad SiO linewidths in the protostar in HH211, which they attributed to a wide angle wind. Such an interpretation is not supported in HH212, however: SiO profiles show little blue/red overlap in each lobe (see Fig. 2), despite the almost edge-on inclination. Assuming a conical wind of constant speed, a half-opening angle 6° is inferred, ruling out a wide-angle wind. The fact that SiO emission stops precisely near zero velocity, with an overlap of at most 2 km s-1, would actually suggest that the wind half-opening angle coincides to within 2° with the angle from the plane of the sky111The wind half-opening angle, , is related to the angle to the plane of the sky, , by where is the ratio (in algebraic value) of maximum to minimum radial velocities in a given lobe. In HH212, km s-1, km s-1, and =4° yield and = 4°-6°.. Since such a coincidence is statistically unlikely, it appears more probable that high-velocity SiO is confined to less than ° from the jet axis (thus producing no emission at zero velocity) and that SiO emission near systemic velocity is tracing intrinsically slower, possibly less collimated material. This slow material may trace unresolved bowshock wings. Indeed, water maser spots observed via VLBI reveal curved bowshocks at 01 from the protostar, covering a range of radial velocities (black arrows in the right panel of Fig. 2; Claussen et al., 1998). Given the restrictive excitation and coherence conditions for maser amplification, the observed velocity range is less than the full range in the bow. Hence, internal bowshocks could contribute significantly to the broad SiO line widths. Intrinsic gradients in jet speed (due e.g. to time variability, or to a range of launch radii) may also be present.
3.3 The outer SiO bullets
At distances of 10 and beyond, the spatial correspondence between SiO and H2 is very good. The two symmetric elongated SiO bullets (Blue 1/Red 1) peak towards H2 knots SK2-SK4 and NK2-NK4 (note that the SiO(5–4) image is affected by primary beam attenuation at large distances from the centre (FWHM = 22). SiO emission is also seen between and beyond these knots, with a morphology similar to that in H2 (Fig. 1). The correspondence between SiO and H2 in the outer bullets is also excellent in radial velocity, as shown in the PV diagram in Fig. 2 (left panel). The SiO(2-1) profiles peak within 2 km s-1 of the H2 centroid. Hence SiO appears to trace the same jet as H2, confirming the conclusion of Takami et al. (2006) based on SiO(8–7) profiles at much lower angular resolution (22). The SiO line profiles are broader than towards the inner knots, but they show the same extension down to zero velocity and small degree of red/blue overlap, suggestive of internal bowshocks. Line profile asymmetries between the two lobes indicate slight differences in shock structure despite the highly symmetric knot spacings.
In contrast to the excellent agreement between SiO and H2 beyond 10, we find a striking lack of SiO emission towards the brightest H2 knots (SK1, NK1). A similar effect was observed towards the HH211 jet, where the brightest, bow-shaped H2 knots also lack an SiO counterpart (Hirano et al., 2006). One possible explanation would be that SK1 and NK1 trace more powerful shocks where SiO does not form/survive or where the SiO excitation is extremely high and consequently the low-J transitions are very weak. The detection of [Fe II] emission in SK1 and NK1 (Zinnecker et al., 1998; Caratti o Garatti et al., 2006), their clear bow-shock geometry (see Fig. 1), and their 3-4 times broader linewidth compared to other H2 knots in HH212 (Fig. 2) support this hypothesis. Estimates of SiO excitation and abundances will be presented in a separate forthcoming paper.
3.4 Search for jet rotation
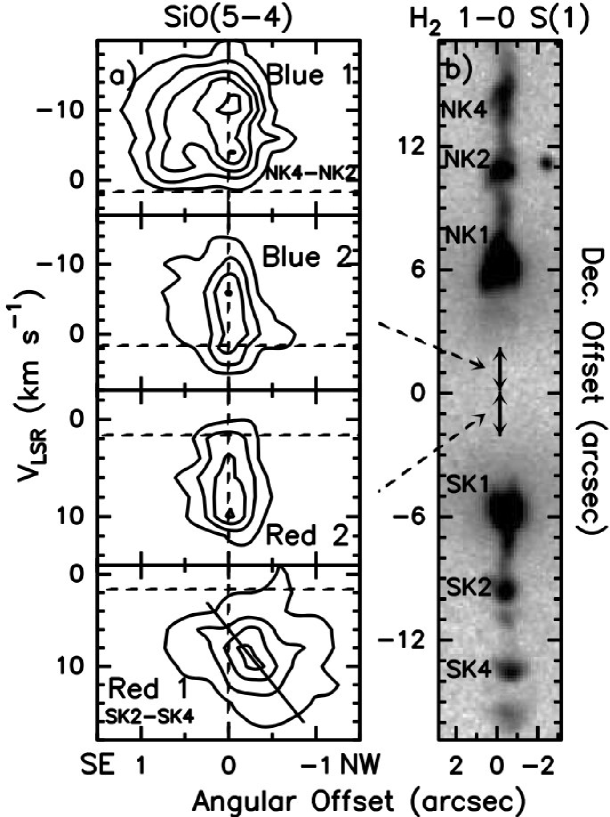
Davis et al. (2000) reported a centroid velocity shift of +2.3 km s-1 from NW to SE across knot SK1 which they attributed to jet rotation, based on its agreement with the rotation sense of the ammonia protostellar core (Wiseman et al., 2001). Although SK1 is not detected in SiO (see 3.3), we can test this interpretation in the other knots, as rotation speeds should remain roughly constant once the jet has achieved cylindrical collimation (see Pesenti et al., 2004).
Figure 3a presents PV diagrams across the jet in SiO(5-4) for each emitting region. No shift of the intensity peak is seen across Blue 1 on the scales 05 investigated by Davis et al. (2000). On the other hand, a clear gradient is observed across the Red 1 bullet (Fig. 3, bottom panel), with a shift of –6 km s-1 over 1 from NW to SE. However, the gradient goes in opposite sense to the rotation pattern of the NH3 core, ruling out that we are observing rotation of a centrifugally-driven MHD jet. The fact that the centroid of Red 1 is slightly displaced from the jet axis, i.e. that outer SiO bullets are slightly misaligned with respect to the inner SiO jet, suggests that this effect is due instead to a kinematical asymmetry in the shocked material, possibly related to the H2 jet wiggling apparent in Fig. 3b. Since SK1 traces a much wider bowshock than the SK2-SK4 knots in Red 1 (see Fig. 1), its transverse gradient measured in H2 could easily be affected by similar asymmetries, and should be interpreted with great caution. The innermost SiO knots (Blue 2/Red 2) do not show signs of transverse velocity shifts above 1 km s-1, consistent with the high-velocity SiO jet being practically unresolved transversally. Higher angular resolution would be needed to constrain the level of jet rotation.
References
- Bacciotti et al. (2002) Bacciotti F., Ray T.P., Mundt R., Eislöffel J., & Solf J. 2002, ApJ 576, 222
- Caratti o Garatti et al. (2006) Caratti o Garatti A., Giannini T., Nisini B., & Lorenzetti D. 2006, A&A 449, 1077
- Claussen et al. (1998) Claussen M.J., Marvel K.B., Wootten A., & Wilking B.A. 1998, ApJ 507, L79
- Davis et al. (2000) Davis C.J., Berndsen A., Smith M.D., Chrysostomou A., & Hobson J. 2000, MNRAS 314, 241
- Galván-Madrid et al. (2004) Galván-Madrid R., Avila R., & Rodríguez L.F. 2004, RMAA 40, 31
- Guilloteau et al. (1992) Guilloteau S., Bachiller R., Fuente A., & Lucas R. 1992, A&A 265, L49
- Gueth et al. (2006) Gueth F., et al. 2006, A&A, in preparation
- Hirano et al. (2006) Hirano N., Liu S.-Y., Shang H. et al. 2006, ApJ 636, L141
- Lee et al. (2006) Lee C.-F., Ho P.T.P., Beuther H., et al. 2006, ApJ 639, 292
- McCaughrean et al. (2002) McCaughrean M., Zinnecker H., Andersen M., Meeus G., & Lodieu N. 2002, Msngr 109, 28
- Pesenti et al. (2004) Pesenti N., Dougados C., Cabrit S., et al. 2004, A&A 416, L9
- Takami et al. (2006) Takami M., Takakuwa S., Momose M., et al. 2006, PASJ 58, 563
- Wiseman et al. (2001) Wiseman J., Wootten A., Zinnecker H., & McCaughrean M. 2001, ApJ 550, L87
- Zinnecker et al. (1998) Zinnecker H., McCaughrean M.J., & Rayner J.T. 1998, Nature 394, 862