Mean ZZ Ceti pulsation period gauges stellar temperature
Abstract
The mean pulsation period of ZZ Ceti stars increases with decreasing effective temperature as we traverse from the blue to the red edge of the instability strip. This well-established correlation between the mean period and spectroscopic temperature suggests that the mean period could be utilized as a tool to measure the relative temperature of the star independent of spectroscopy. Measuring the pulsation periods of a ZZ Ceti star is a simple, model-independent, and straight forward process as opposed to a spectroscopic determination of its temperature.
Internal uncertainties in determining the spectroscopic temperature of a ZZ Ceti star are at least 200 K, 15% of the 1350 K width of the instability strip. The uncertainties in determining the mean period arise mostly from amplitude modulation in the pulsation spectrum and are smaller than 100 s for 91% of the ZZ Ceti stars, 8% of the 1300 s width of the instability strip. In principle this implies that for 90% of the ZZ Ceti stars, the average uncertainty in determining the location of a ZZ Ceti star within the instability strip decreases by a factor of two in utilizing the mean period of the ZZ Ceti star as a temperature indicator rather than conventional spectroscopy. Presently we only claim that the relative temperatures of ZZ Ceti stars derived by using the mean pulsation period are certainly as good as and perhaps about 15% better than spectroscopy.
Department of Astronomy, University of Washington, Seattle, WA - 98195-1580, USA
Department of Astronomy, University of Texas at Austin, Austin, TX - 78712, USA
Instituto de Física, Universidade Federal do Rio Grande do Sul, 91501 - 970 Porto Alegre, RS - Brazil
Department of Physics and Astronomy, University of North Carolina, Chapel Hill, NC 27599, USA
1. Introduction
Non-interacting hydrogen atmosphere (DA) white dwarfs pulsate in a narrow instability strip located within the temperature range 10800–12300 K for (Bergeron et al. 1995, 2004; Koester & Allard 2000; Mukadam et al. 2004; Gianninas et al. 2005). These DA variables (DAVs) are also called the ZZ Ceti stars. The hot ZZ Ceti stars show relatively few pulsation modes, with low amplitudes (0.1–3%) and periods around 100–300 s (see Clemens 1993). The cooler DAVs show longer periods, around 600–1000 s, larger amplitudes (up to 30%), non-linear pulse shapes, and greater amplitude modulation (e.g. Kleinman et al. 1998). The pulsation characteristics of the hot and cool DAVs are quite distinct, and have allowed us to classify these stars meaningfully.
2. Weighted Mean Period as a function of effective temperature
Clemens (1993) was the first to systematically demonstrate the increase in mean pulsation period as a function of decreasing temperature for a significant sample of the ZZ Ceti stars. With the discovery of additional ZZ Ceti stars, this empirical correlation was confirmed again by Kanaan et al. (2002) and more recently by Mukadam et al. (2006).
Using only the independent excited modes and excluding any harmonics and linear combinations, we compute the mean period for a given pulsation spectrum, weighting each period with the corresponding amplitude. In case of multiple pulsation spectra for a given ZZ Ceti star, we determine an average of the individual values. We show the weighted mean period (WMP) as a function of spectroscopic temperature for two independent samples of ZZ Ceti stars, and find that the weighted mean pulsation period correlates well with the spectroscopic temperature in both cases. Note that we do not claim that the relationship between the WMP and the temperature is linear; a straight line is merely the simplest model fit possible to the observations shown in Figure 1, considering the observed amount of scatter.
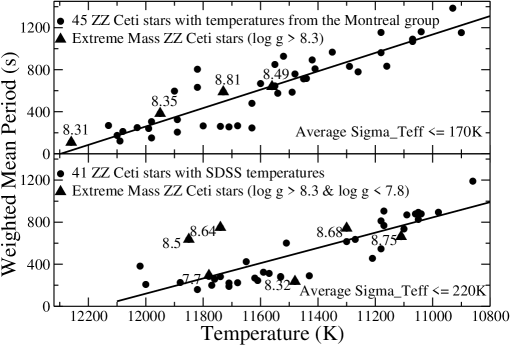
The scatter, as measured along the x-axis, helps us constrain the average uncertainty in spectroscopic temperature, provided we assume that most of the scatter in the correlation arises due to uncertainties in temperature. We hereby constrain the average uncertainty in temperature for the 45 ZZ Ceti sample published by Bergeron et al. (2004) and Gianninas et al. (2005, 2006) to be 170 K. We also constrain the average uncertainty in temperature for the 41 SDSS ZZ Ceti sample to be 220 K, which we acquired from the DR4 catalog for DA white dwarfs222 http://www.naoj.org/staff/sjnk/varcat/wdDAVARS.tableRA.DR4.html, based on version auto22 of the spectral fitting algorithm.
The 45 ZZ Ceti star sample shown in the top panel is our best case scenario; the temperatures come from high S/N optical spectra and most of these bright stars have well determined pulsation spectra, have been observed multiple times, and sometimes even from multiple sites. For this sample, we find that our upper limit of 170 K for the average uncertainty in spectroscopic temperatures is lower than the estimate of 200 K from Bergeron et al. (2004). This is suggestive that the correlation between WMP and spectroscopic temperature is tighter than it seems, and that most of the scatter arises due to the uncertainties in temperatures, that have been derived from optical spectra.
Lastly, we highlight the extreme mass stars with or in Figure 1 as upright triangles. For our best-case bright 45 ZZ Ceti sample, we find that the massive stars are not outliers in the WMP- correlation. The massive crystallized pulsator BPM 37093 with , which has been the subject of a WET run, agrees fairly well with the linear fit (Kanaan et al. 2005). Three of the six extreme mass stars from the SDSS DAV sample are outliers in the plot, but most of these stars have pulsation spectra determined from no more than a few hours of discovery data. Also, the masses of the SDSS ZZ Ceti stars have a relatively higher uncertainty than the Montreal sample as they have been determined from lower S/N optical spectra. However the behaviour of the bright massive stars, and specially BPM 37093, is surprising. We expect that at a given temperature, white dwarfs of different masses have convection zones of different thicknesses. Our models suggest that the driving frequency is governed by the thermal timescale at the base of the convection zone. Massive white dwarfs should show a mean pulsation period longer than other average mass DAVs at the same temperature. The empirical WMP values for all four massive stars in the Montreal group sample, and four out of six extreme mass ZZ Ceti stars in the SDSS sample contradict this theoretical expectation. Although we presently have a small number of extreme mass ZZ Ceti stars, their WMP values have implications for the slope of the blue edge and pulsation models in general.
The observed correlation between WMP and suggests that WMP can be used to gauge stellar temperature. Determining the pulsation periods of a ZZ Ceti star involves small uncertainties, and is a relatively simple model-independent process. We cannot determine an absolute temperature using WMP; we can only derive the position of a ZZ Ceti star within the instability strip. To do so, we do not need the correlation shown in Figure 1. As long as we restrict our relative parameter in units of seconds in the WMP temperature scale, the uncertainty in our measurements is not related to spectroscopic temperatures. It is only when we attempt to translate WMP into a temperature in degrees, that we have to use the relation between WMP and from Figure 1. Even in this case, we are better off than the typical 200 K uncertainty in spectroscopic temperatures because the slopes of the best fit lines in Figure 1 depend on 40–45 stars. Using WMP directly as a temperature scale is non-intuitive at the present time. But this maybe worth thinking about as an alternative scale in the long run, as we improve our understanding of the relation between WMP and , both observationally and theoretically.
3. Exploring the range of excited periods vs. temperature
We show the longest (middle panel) and shortest (bottom panel) excited periods for our best-case bright 45 ZZ Ceti sample as a function of spectroscopic temperatures from the Montreal group in Figure 2. We also include a plot of WMP vs. temperature (top panel) for comparison. We indicate a measure of the scatter in each of the panels, and find that the shortest excited period exhibits the tightest correlation with . But this may or may not be significant; the SDSS sample, for which we have no more than a few hours of discovery data, does not mimic this general behaviour.
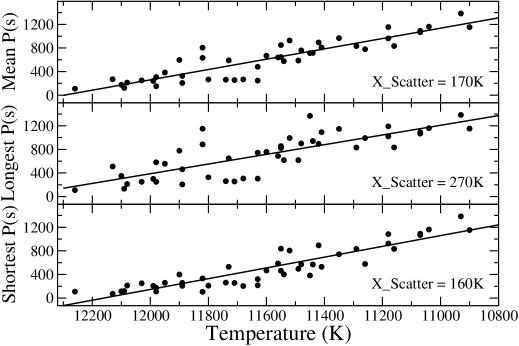
We determine WMP using all the independent periods excited in the star, but the weighting is amplitude dependent, which in turn depends on the inclination angle. Using the shortest or the longest period, we overcome the amplitude dependence of WMP, but find ourselves relying on a single period determination instead. Some of the older pulsation spectra come from data acquired using one and two channel photometers, which could not be used reliably to separate long pulsation periods from sky variations, unless the data came from South Africa. Also, the determination of the shortest pulsation period depends on the time resolution of the data. Since we have a highly diverse set of pulsation spectra with stars of different magnitudes and pulsation amplitudes observed using different telescopes, we hesitate to draw any implications from Figure 2.
4. Amplitude Modulation: Dominant source of uncertainty in WMP
The cool ZZ Ceti stars exhibit a significant amount of amplitude modulation, and their pulsation spectra can change substantially from one season to the next (e.g. Kleinman et al. 1998). We believe this is the largest source of uncertainty in determining WMP and in using it as a temperature scale. In order to estimate the size of this source of uncertainty, we select those ZZ Ceti stars in our data set that have multiple seasons of observations. We then determine the spread in the WMP values computed from the multiple pulsation spectra. For 36 ZZ Ceti stars, we show the 1 departure of WMP from the average obtained using multiple seasons of observations in Figure 3. We also show the worst case scenario, the maximum deviation of WMP from the average value. We find that 92% of the sample show a 1 deviation smaller than 50 s, and the whole sample shows a modulation in WMP smaller than 80 s. Even in the worst case, about 91% of the 36 ZZ Ceti stars exhibit a modulation in WMP smaller than 100 s, and 97% show a modulation smaller than 130 s.
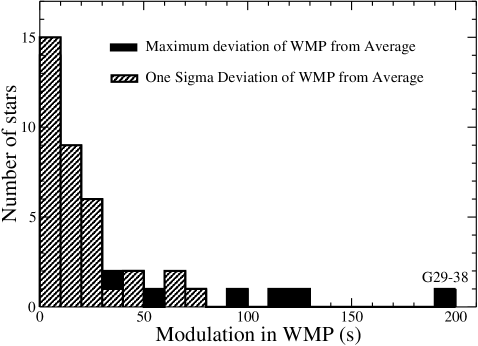
Adopting the worst-case numbers, we find that the uncertainty in WMP is likely to be smaller than 100 s for about 91% of the ZZ Ceti stars, which translates to 8% of the 1300 s width of the instability strip in period. Adopting the best-case scenario for conventional spectroscopy, we will use our limit of 170–220 K as the average uncertainty in spectroscopic temperatures to arrive at an uncertainty of 13–16% of the 1350 K width of the instability strip. This suggests that for 90% of the ZZ Ceti stars, we can improve our knowledge of the star’s location within the instability strip by a factor of two, by using WMP instead of spectroscopy. However we have to face some theoretical questions before we can be certain of the factor of improvement in using WMP instead of spectroscopy.
5. Chicken or Egg? Mean Period or Spectroscopic Temperature?
To determine which temperature scale is better, WMP or spectroscopic , we have devised the following test. The observed mean pulsation amplitude of ZZ Ceti stars shows a large scatter when plotted as a function of (e.g. Kanaan et al. 2002; Mukadam et al. 2006), and this is largely due to the different inclination angles. If all DAVs with the same had the same inclination angle, then we theoretically expect to see a tight correlation between the mean amplitude and temperature. This is not strictly true because pulsation amplitude also depends on the mass of the star; massive ZZ Ceti stars have small amplitudes. Excluding the massive DAVs () and the low mass DAVs () from both samples, we compute the scatter in plotting mean amplitude as a function of and also as a function of WMP. The temperature scale that was worse than the other would introduce an additional scatter in the plot. Having conducted the test, we find a 15% reduction in scatter when using WMP as a temperature scale instead of spectroscopic for both samples. This suggests that WMP is at least 15% better than traditional spectroscopy.
6. A question to ponder
Montgomery (2005) show that the thermal timescale at the base of the convection zone is proportional to and have successfully fit the non-linear pulse shape of one DAV to date, namely G29-38. Kim et al. (2006) find that the empirical WMP is not consistent with the thermal timescale at the base of the convection zone in models. The question to ask is: what physical quantity in the star does WMP represent. Unless we can comprehend this satisfactorily, we will not be able to understand the tightness of its correlation with and the true uncertainties involved in using this technique to determine stellar temperature.
Acknowledgments.
Support for this work was provided by NASA through the Hubble Fellowship grant HST-HF-01175.01-A awarded by the Space Telescope Science Institute, which is operated by the Association of Universities for Research in Astronomy, Inc., for NASA, under contract NAS 5-26555.
References
- Bergeron et al. (1995) Bergeron, P. et al. 1995, ApJ, 449, 258
- Bergeron et al. (2004) Bergeron, P. et al. 2004, ApJ, 600, 404
- Clemens (1993) Clemens, J. C. 1993, Ph.D. Thesis, University of Texas at Austin
- Gianninas et al. (2005) Gianninas, A., Bergeron, P., & Fontaine, G. 2005, ApJ, 631, 1100
- Gianninas et al. (2006) Gianninas, A., Bergeron, P., & Fontaine, G. 2006, AJ, 132, 831
- Kanaan et al. (2002) Kanaan, A., Kepler, S. O., & Winget, D. E. 2002, A&A, 389, 896
- Kanaan et al. (2005) Kanaan, A., et al. 2005, A&A, 432, 219
- Kim et al. (2006) Kim, A., et al. 2006, Memorie della Societa Astronomica Italiana, 77, 376
- Kleinman et al. (1998) Kleinman, S. J. et al.1998, ApJ, 495, 424
- Koester & Allard (2000) Koester, D. & Allard, N. F. 2000, Baltic Astronomy, 9, 119
- Montgomery (2005) Montgomery, M. H. 2005, ApJ, 633, 1142
- Mukadam et al. (2004) Mukadam, A. S. et al. 2004, ApJ, 612, 1052
- Mukadam et al. (2006) Mukadam, A. S. et al. 2006, ApJ, 640, 956