Damp Mergers: Recent Gaseous Mergers without Significant Globular Cluster Formation?
Abstract
Here we test the idea that new globular clusters (GCs) are formed in the same gaseous (“wet”) mergers or interactions that give rise to the young stellar populations seen in the central regions of many early-type galaxies. We compare mean GC colors with the age of the central galaxy starburst. The red GC subpopulation reveals remarkably constant mean colors independent of galaxy age. A scenario in which the red GC subpopulation is a combination of old and new GCs (formed in the same event as the central galaxy starburst) can not be ruled out; although this would require an age-metallicity relation for the newly formed GCs that is steeper than the Galactic relation. However, the data are also well described by a scenario in which most red GCs are old, and few, if any, are formed in recent gaseous mergers. This is consistent with the old ages inferred from some spectroscopic studies of GCs in external systems. The event that induced the central galaxy starburst may have therefore involved insufficient gas mass for significant GC formation. We term such gas-poor events “damp” mergers.
1 Introduction
Since the first hints that the color distributions of globular cluster (GC) systems in some early-type galaxies were bimodal (Couture, Harris & Allwright 1991; Ashman & Zepf 1993), bimodality has been shown to be the norm (e.g., Larsen et al. 2001; Kundu & Whitmore 2001; Strader et al. 2006; Peng et al. 2006). This blue/red bimodality indicates distinct metallicity (and perhaps age) subpopulations within the GC system. The mean color of the blue and red subpopulations are known to correlate with their host galaxy luminosity (Strader, Brodie & Forbes 2004). Basic interpretations of these two subpopulations include dissipative formation at early epochs (Forbes, Brodie & Grillmair 1997), gaseous mergers at early or late epochs (Ashman & Zepf 1992), and the dissipationless accretion of GCs (Cote, West & Marzke 2002). A key piece of evidence in assessing these scenarios is the age distribution of the two GC subpopulations. The current state of affairs is summarised in the review of Brodie & Strader (2006), which notes that small spectroscopic samples to date find most GCs to be Gyrs old, implying an early formation epoch at redshifts . However, such work is limited by sampling biases: only the brightest GCs in nearby ( Mpc) galaxies can be studied. To create large samples of typical GCs, one must use photometric studies.
Many early-type galaxies are found to have younger central stellar populations, indicative of a recent interaction or gaseous (“wet”) merger which induced some star formation (Trager et al. 2000; Proctor & Samson 2002; Terlevich & Forbes 2002; Thomas et al. 2005; Denicolo et al. 2005; Sanchez-Blazquez et al. 2006, SB06).111In some low-mass galaxies, “cold” flows from the intergalactic medium may be a possible source of gas (e.g., Keres et al. 2005). The age of this young starburst has been found to correlate with a galaxy’s location on the Fundamental Plane and with morphological fine structure (Schweizer & Seitzer 1992; Forbes, Ponman & Brown 1998). There is also good evidence for the formation of proto-GCs in ongoing wet mergers like the Antennae (Whitmore & Schweizer 1995), which are thought to ultimately form an elliptical galaxy (e.g., Toomre & Toomre 1972). Furthermore, as star clusters appear to be the primary mode of star formation (Lada & Lada 2003), we expect GCs to trace major star formation episodes in all starbursts (Larsen & Richtler 2000). In the semi-analytic models of Beasley et al. (2002) metal-poor GCs form in proto-galactic fragments at high redshift, while metal-rich ones form in subsequent gas-rich merging events. However, if formation conditions are not suitable (e.g., insufficient gas mass or low GC formation efficiency) then few long-lasting GCs may be produced. Local examples of this include the Galaxy’s disk and the LMC, which have experienced open cluster formation without GC formation. Also, in the case of gas-free (“dry”) accretions or mergers no induced star, or star cluster, formation is expected.
Major gaseous mergers (Ashman & Zepf 1992) are predicted to form new metal-rich GCs with a mean age corresponding to that of the merger. Any new GCs formed will add to the existing GC system of the progenitor galaxies, i.e. an old metal-poor (blue) and possibly an old but more enriched (red) subpopulation.
The newly formed metal-rich GC subpopulation will initially be very blue, however it will redden rapidly (e.g., Whitmore et al. 1997). If formed in the last Gyr, the subpopulation may have a color similar to that observed for blue subpopulations in early-type galaxies. For the first couple of Gyrs, depending on its metallicity, it may have intermediate colors. However, older than a few Gyrs, the colors resemble those of red subpopulations, and continue to redden slowly with age. If significant numbers of new GCs were formed more than a few Gyrs ago, then the red subpopulation of the merger remnant galaxy may be dominated by these newly formed metal-rich GCs. The mean color of the red subpopulation will therefore be determined by the relative fraction of newly formed vs old GCs and their respective enrichment levels (metallicity) and time elapsed (age) since formation.
Although broad-band colors are subject to the age-metallicity degenearcy, the evolution of color for any reasonable GC metallicity has a similar characteristic form and can be well described by a single stellar population model. Thus we can model the expected mean color of the red subpopulation with age and compare this to the observed color and age of the galaxy’s central starburst. Here we examine two relatively large samples of early-type galaxies in order to test the idea that the red subpopulation of GCs were largely formed in gaseous mergers (Ashman & Zepf 1992).
2 The Data
We present two datasets for which we have obtained GC colors and central starburst ages for the same galaxies. The first sample has been gathered from a wide variety of literature sources; we refer to this as our heterogeneous sample. The second sample comes from a single photometric source (the Virgo ACS Survey; Peng et al. 2006) and single galaxy age study (Caldwell et al. 2003); we refer to this as our homogeneous sample.
2.1 A Hetrogeneous Sample: Galaxy Ages
Stellar age estimates based on an analysis of Lick absorption lines are available for a number of early-type galaxies. Such ages are luminosity weighted, and date the last major starburst while giving little information on the mass involved. They are also central values which may not therefore reflect the galaxy as a whole (see, e.g., discussion in Terlevich & Forbes 2002).
For our first sample of 36 galaxies, we take galaxy ages from four independent studies: Terlevich & Forbes (2002), Thomas et al. (2005), Denicolo et al. (2005), and SB06. All four employ a similar method of using the H index and the [MgFe] composite index, together with a single stellar population (SSP) model, to derive galaxy ages and metallicities. In Table 1 we list the central ages from these four studies for those galaxies which also have GC colors available from the literature. When more than one age estimate is available, the agreement among studies is generally quite acceptable. For these galaxies we adopt the average age value. However, for four galaxies the estimates are wildly different.
The galaxies with discrepant age estimates are:
NGC 1052: We adopt the young age of Denicolo et al. (2005).
This is supported by Pierce et al. (2005), who measured a
galaxy age of Gyrs.
NGC 1407:
We adopt the old age given by Thomas et al. (2005). This is
supported by the high-quality spectra of
Cenarro et al. (2006) and Spolaor et al. (2006) which
indicate very old central ages.
NGC 3115:
We adopt the age of SB06, but note that
Norris et al. (2006) have shown
that NGC 3115 has a younger age along the major than minor axis.
NGC 4365:
We adopt the 7.9 Gyr age of SB06 which is
supported by the 9.7 Gyr age derived by Proctor & Samson (2002).
Our final adopted age is given in the last column of Table 1.
Using all the galaxies with multiple age estimates, we measure an average rms scatter of 0.2 dex in log age (ages are derived from SSP model grids which are nearly uniform in log), or 2 Gyrs. A further indication that our age estimates are reasonable is provided by Fig. 1. Here we show the residual from the Fundamental Plane value for each galaxy (from Prugniel & Simien 1996) in log units against log of our adopted galaxy age for the available galaxies. The solid line is the fit from a much larger sample of Forbes, Ponman & Brown (1998). The data scatter about the Forbes et al. fit line showing that the galaxy ages are related to an independently measured value, i.e. the deviation of the galaxy from the standard Fundamental Plane. The rms scatter in galaxy age is consistent with the value quoted above for age estimates between different studies. Finally, we note that excluding the four galaxies with the most discrepant ages in Table 1 from the analysis does not affect our results.
2.2 A Heterogeneous Sample: Globular Cluster Colors
A large number of early-type galaxies have been imaged with sufficient
precision to detect bimodality in the GC color distribution,
particularly with the Hubble Space Telescope. Although ACS imaging of
GCs is becoming more common (e.g., Peng et al. 2006;
Harris et al. 2006; Forbes et al. 2006; Strader et al. 2006; Spitler et al. 2006), most HST
studies have used the WFPC2
camera. These latter data were typically taken in the V and I
filters. We have searched the literature to compile a database of
mean blue and red GC colors for early-type galaxies observed by HST or with
ground-based telescopes. It excludes the recent Virgo ACS survey
which is discussed in section 2.3. We do however include the
Sombrero Sa galaxy as it is extremely bulge dominated.
We have transformed other filter combinations (i.e. mostly B–I
and C–T1)
into V–I using the conversions of Forbes & Forte (2001).
The conversion of Forbes & Forte (2001) is an empirical one based on
the Galactic GC system, i.e. it assumes old stellar populations.
A conversion for younger stellar populations would predict a
bluer V–I color than an assumed old age. However
the differences are very small because the filters are similar to
V–I and the age-metallicity degeneracy means tracks of different
ages run roughly parallel to each other. This is illustrated in
Fig. 2 which shows Bruzual & Charlot (2003; BC03) SSP model tracks for single ages of 2 and
12.5 Gyrs at various metallicities. Over the typical B–I color
range of GCs (i.e. 1.5 B–I 2.2) the predicted V–I
color is 0.03 mag. redder if GCs are as young as 2 Gyrs
compared to our assumption of 12.5 Gyrs. A similar offset occurs
if C–T1 is compared to V–I.
As well as these filter transformations,
we have applied extinction corrections from Schlegel et al. (1998) to
all GC colors. In Table 2 for each galaxy with an age estimate,
we list the
(V–I)o colors after transformation from the original filter
combination and extinction correction. We also give the original
reference for the GC photometry, whether the bimodality is
confirmed (Y) or likely (L), the original filter combination and
whether the photometry comes from HST (Y) or not (N). A complete
table of GC photometry (i.e. including those galaxies without age
estimates) can be found at:
http://astronomy.swin.edu.au/dforbes/colors.html
The galaxies in this sample cover a range of luminosities, and GC colors are known to correlate with the luminosity of their host galaxy (see Brodie & Strader 2006 for a review). This correlation is thought to be largely a metallicity-mass relation. Before searching for any correlations of GC color with galaxy age, we have removed this effect using the observed GC V–I color–galaxy luminosity relations of Strader, Brodie & Forbes (2004). This correction (of typically less than 0.05 mag.) eliminates, at least to first order, any GC color variations due the range of host galaxy luminosities in our sample.
2.3 A Homogeneous Sample: Galaxy Ages
Central ages for 33 low-luminosity early-type Virgo galaxies are taken from a single source, i.e. Caldwell et al. (2003). We use their best fit age, which comes from comparing high order Balmer lines and Fe4383 with an SSP model. Using a single source avoids any systematic differences that may be present between multiple sources.
2.4 A Homogeneous Sample: Globular Cluster g–z Colors
Mean colors for the blue and red GC subpopulations of early-type Virgo galaxies come from the ACS Virgo Survey of Peng et al. (2006). This dataset has several advantages over the V–I colors from the literature; namely g–z has twice the metallicity sensitivity of V–I, the photometric uncertainties are generally lower and galaxies are at the same distance so any potential aperture effects do not play a role. Uncertainties in the peak colors range from 0.01 to 0.3 mag. Following Peng et al. we assume m–M = 31.09 to the Virgo cluster.
For VCC 1488 (IC3487), the mean blue color listed in Peng et al. (2006) of g–z = 0.72 does not seem to correspond to the fitted Gaussians displayed in their Figure 2. In this case we have chosen to take the mean color for the blue GCs from the work of Strader et al. (2006). This value, of g–z = 0.82, better represents the color distribution. Finally, we correct all GC g–z colors using the GC color–galaxy luminosity relation of Peng et al. (2006).
3 Results and Discussion
Having described the data from which we take GC mean subpopulation colors and central galaxy ages, we now present our results. As well as the color of the red subpopulation we show results for the color difference between the red and blue subpopulations. A variety of observational and theoretical work suggests that blue GCs may have been formed before reionization at z 6. This implies ages of 12.7 Gyrs. Such old ages are reflected in the observed near constant color of blue GC subpopulations. The color difference is therefore largely due to the age and metallicity of the red GCs, and it may be more accurately determined than the individual subpopulation mean colors.
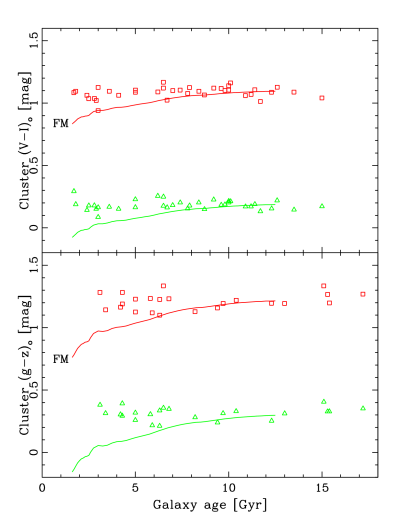
Figure 3 shows the mean V–I and g–z colors of the red GC subpopulations, and the color difference between red and blue subpopulations versus galaxy stellar age for our two samples. The GC colors in this, and subsequent figures, have been corrected for the GC color–galaxy luminosity relation as described above.
For the hetreogeneous sample we find constant V–I colours with an rms spread of 0.044 mag., or an error on the mean for 36 galaxies of 0.007 mag. For the homogeneous sample we find constant g–z colours with an rms spread of 0.068 mag., or an error on the mean for 33 galaxies of 0.012 mag. The rms scatter is equal to, or less than, the typical photometric errors in our samples suggesting that the intrinsic scatter is indeed very low.
In Fig. 3 we use different symbols within the heterogenous sample when the bimodality is classified as confirmed (Y) or likely (L) in Table 2. The figure shows that there is no systematic offset between the two classifications of bimodality; for subsequent figures we use a single symbol for the heterogenous sample. An analysis of a subsample of the ACS Virgo Survey was first carried out by Strader et al. (2006). A comparison of their sample with that from Caldwell et al. (2003) reveals 12 galaxies in common with GC color and galaxy age measurements. We have examined them in a similar way to above, finding constant g–z colors, i.e. an rms scatter of 0.059 and an error on the mean of 0.017 mag.
In this and subsequent figures we show evolutionary tracks based on SSP models from Bruzual & Charlot (2003) which assume a Salpeter initial mass function and a solar abundance ratios (we note that other SSP models give similar results).
The track in Figure 3 is the scenario in which all red GCs are uniformly old with a fixed metallicity of [Fe/H] = –0.7 and hence the evolutionary track has a constant color. This is the scenario in which no GCs formed at the time of the central starburst so that GC color is unrelated to galaxy age. We call this the no evolution (NE) track and it provides a good fit to the mean color of the red subpopulation. For the color difference between the red and blue subpopulations we have simply shifted the NE track bluer by an arbitrary amount. Again it provides a good representation of the data.
So although the scenario in which all of the red GCs are old, and none are formed in recent mergers, is a good fit to the observed data can other scenarios be ruled out ?
Figure 4 shows the predicted change in color for a fixed metallicity (FM) of [Fe/H] = –0.7. This track corresponds to the situation in which all red GCs in a galaxy formed at the time of the central galaxy starburst with a metallicity of [Fe/H] = –0.7 (i.e. the metallicity required for very old GCs to be consistent with their measured colors). It provides a plausible fit to the data at old ages but deviates strongly from the data for young ages. Lower metallicity tracks would provide a worse fit at all ages. Higher metallicity (e.g. solar) tracks could explain the GC colors in the youngest galaxies but would fail to match the color of the oldest galaxies. Thus we can fairly confidently rule out the scenario in which all red GCs were formed in a merger from gas of a fixed metallicity over a wide range of epochs.
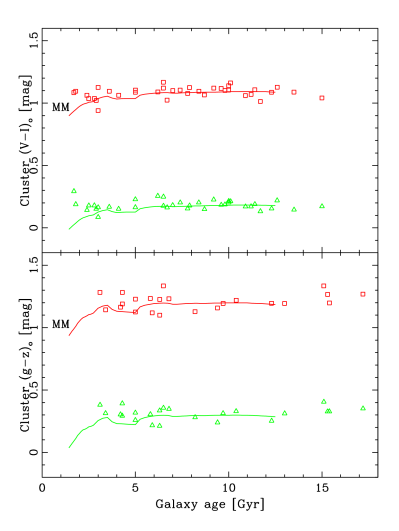
A more plausible scenario is that the gas from which GCs form is steadily enriched over time, so the oldest red GCs may have formed from [Fe/H] = –0.7 gas (to match the observed color) but younger GCs, forming more recently, would be more metal-rich. Thus we need to assume a relationship for the enrichment of the gas with time (age) as the Universe evolves. A plausible age-metallicity relation comes from the fossil record of the Galactic disk. From studies of individual stars and star clusters, Edvardsson et al. (2003) find that a simple linear relation between metallicity and log age is a reasonable fit to the data (albeit with some scatter). Thus for this scenario we assume all red GCs formed at the time of the central galaxy starburst with a metallicity determined by the Galactic age-metallicity relation. Figure 5 shows this mixed metallicity (MM) evolutionary track. This track provides a good fit to the majority of the data. A fit of the data points to the MM track gives an rms of 0.056 for the hetreogenous sample and 0.077 for the homogenous sample, i.e. similar to that of the NE track. A slightly steeper age-metallicity relation (producing redder GCs at a given age) would provide a better fit; conversely a shallower age-metallicity would provide a worse fit to the data.
The mixed metallicity track assumes 100% of the red GCs are formed at the time of the recent central starburst. A contribution of old, metal-rich red GCs from the progenitor galaxies will tend to ‘dilute’ the track making it more similar to the no evolution track of Figure 3. Perhaps a good illustration of this is the young merger remnant NGC 3610 in our heterogeneous sample. This galaxy has a central starburst age of Gyr. Strader, Brodie & Forbes (2004) obtained spectra of 10 red GCs and found only 2 to have an age consistent with forming at the same time as the galaxy starburst. If these 10 GCs are representative then 80% of the red GC subpopulation is old and 20% formed in a gaseous merger event 1.8 Gyrs ago. The red GC subpopulation has a mean V–I color that is consistent with the pure no evolution track but also with one that contains a 20% contribution from our mixed metallicity track. Thus a contribution of old and newly formed red GCs can account for the observed GC colors in the youngest galaxies if the age-metallicity relation is not shallower than assumed.
4 Concluding Remarks
We have compared the observed mean color of the red GC subpopulation and its color difference with the blue subpopulation to the age of the central starburst for two samples of early-type galaxies. We find that, for both samples, the GC subpopulation colours show no trend with galaxy age and effectively have a constant value. To interprete this result, three evolutionary scenarios are discussed. A fixed metallicity for newly formed red GCs is a poor representation of the data, especially for young galaxy ages. A mixed metallicity scenario (in which the younger GCs form from progressively more metal enriched gas) provides a better fit to the data. The fit can be improved with a steeper age-metallicity relation than we have assumed and/or a significant contribution from old GCs to the red GC subpopulation in young galaxies; a shallower age-metallicity relation is inconsistent with the data. A good fit to the data is provided by a no evolution scenario in which most of the red GC are uniformly old, and few, if any, formed in late epoch gaseous mergers.
This latter conclusion
supports some previous spectroscopic work that most GCs in
elliptical galaxies are old, and that few new GCs survive from
the same gaseous merger event that
gave rise to the central young starburst.
There are
several possible interpretations: (i) proto-GCs
formed but were quickly destroyed, (ii) GCs formed
with unexpectedly low efficiency in major star-forming events, or
(iii) the starburst involved little gas mass,
and so few new stars and GCs were formed. We term the latter gas-poor
events “damp” mergers.
If situations (i) and (ii) can be ruled out by studies of nearby ongoing
mergers,
then the our results would be
more consistent with frosting models (e.g., Trager et al. 2000)
than with quenching models (Faber et al. 2005) for early-type
galaxies.
Acknowledgements
We acknowledge Francois Schweizer for making the initial
suggestion that motivated this work.
We thank the referees for several useful comments that have
improved this paper.
This material is based upon work supported
by the Australian Research Council and the
National Science Foundation under Grant AST-0507729.
References
Ashman, K., Zepf S., 1992, ApJ 384, 50
Bassino, L., Richtler, T., Dirsch, B., 2006, MNRAS, 367, 156 (B06)
Brodie, J., Strader, J., 2006, ARAA, in press
Brown, R., Forbes, D., Kissler-Patig, M., Brodie, J., 2000, MNRAS, 317, 406 (B00)
Bruzual G., Charlot S. 2003, MNRAS, 344, 1000
Caldwell, N., Rose, J., Concannon, K., 2003, AJ, 125, 2891
Cenarro, J., et al. 2006, AJ, submitted.
Cote, P., West, M., Marzke, R., 2002, ApJ, 567, 853
Couture, J., Harris, W., Allwright, J., 1991, ApJ, 372, 97
Da Rocha, C., Mendes de Oliveira, C., Bolte, M., Ziegler, B.,
Puzia, T., 2002, AJ, 123, 690 (D02)
Denicolo, G., Terlevich, R., Terlevich, E., Forbes, D.,
Terlevich, A., 2005, MNRAS, 358, 813 (D05)
Dirsch, B., Schuberth, Y., Richtler, T., 2005, A&A, 433, 43 (D05)
Edvardsson, B., Andersen, J., Gustafsson, B., Lambert, D.,
Nissen, P., 1993, A&A, 275, 101
Faber S., et al. 2005, astro-ph/0506044
Forbes, D., Grillmair, C., Williger, G., Elson, R.,
Brodie, J., 1998, MNRAS, 293, 325 (F98)
Forbes, D., Georgakakis, A., Brodie, J., 2001, MNRAS, 325, 1431 (F01)
Forbes, D., Forte, J., 2001, MNRAS, 322, 257
Forbes D., Brodie J., Grillmair, C., 1997, AJ 113, 1652
Forbes, D., Ponman, T., Brown, R., 1998, 508, L43
Forbes, D., Sanchez-Blazquez, P., Phan, A., Brodie, J., Strader,
J., Spitler, L., 2006, MNRAS, 366, 1230 (F06)
Georgakakis, A., Forbes, D., Brodie, J., 2001, MNRAS, 324, 785 (G01)
Gomez, M., Richtler, T., 2003, A&A, 415, 499 (G03)
Goudfrooij, P., Gilmore, D., Whitmore, B., Schweizer,
F., 2004, ApJ, 613, 121 (G04)
Harris, W., Whitmore, B., Karakla, D., Okon, W., Baum, W., Hanes,
D., Kavelaars, J., 2006, ApJ, 636, 90 (H06)
Kissler-Patig M., Richtler T., Storm M., Della Valle M., 1997, A&A 327,
503 (K97)
Keres, D., Katz, N., Weinberg, D., Dave, R., 2005, MNRAS, 363, 2
Kundu, A., Whitmore, B., 2001, AJ, 121, 2950 (K01)
Lada, C., Lada, E., 2003, ARAA, 41, 57
Larson, S. Richtler, T., 2000, A&A, 354, 836
Larson, S., 2000, priv. communication (L00)
Larson, S., Brodie, J., Huchra, J., Forbes, D., Grillmair, C.,
2001, AJ, 121, 2974 (L01)
McLaughlin, D., 1999, AJ, 117, 2398
Norris, M., Sharples, R., Kuntschner, H., 2006, astro-ph/0601221
Prugniel, P., Simien, F., 1996, A&A, 309, 749
Peng, E., et al. 2006, ApJ, 639, 95
Pierce, M., et al. 2005, MNRAS, 358, 419
Proctor, R., Sansom, A., 2002, MNRAS, 333, 517
Sanchez-Blazquez, P., et al. 2006, astro-ph/0604568 (SB06)
Schlegel, D., Finkbeiner, D., Marc, D., 1998, ApJ, 500, 525
Spitler, L., et al. 2006, AJ, in press
Spolaor, M., et al. 2006, in prep.
Strader, J., Brodie, J., Forbes, D., 2004, AJ, 127, 295
Strader, J., Brodie, J., Spitler, L., Beasley, M., 2006, AJ, in press
Schweizer F., Seitzer P., 1992, AJ 104, 1039
Trager, S., Faber, S., Worthey, G., Gonzalez, J., 2000, AJ, 119, 1645
Terlevich, A., Forbes, D., 2002, MNRAS, 330, 547 (TF02)
Thomas, D., Maraston, C., Bender, R., de Oliveira, C. M., 2005,
ApJ, 621, 673 (T05)
Toomre, A., Toomre J., 1972, ApJ, 178, 623
Whitmore, B., Schweizer F., 1995, AJ, 109, 960
Whitmore, B., Miller B., Schweizer F., Fall M., 1997, AJ, 114, 797
Whitmore, B., B., Schweizer, F., Kundu, A.,
Miller, B., 2002, AJ, 124, 147 (W02)
Zepf, S., Ashman, K., Geisler, D., 1995, ApJ, 443, 570 (Z95)
| TABLE 1 Galaxy central ages | |||||
|---|---|---|---|---|---|
| Galaxy | TF02 | T05 | D05 | SB06 | Adopted |
| (Gyr) | (Gyr) | (Gyr) | (Gyr) | (Gyr) | |
| NGC 584 | 2.1 | 2.8 | 3.8 | 5.6 | 3.6 |
| NGC 1052 | 21.7 | 2.9 | 2.9 | ||
| NGC 1316 | 2.8 | 3.2 | 3.0 | ||
| NGC 1374 | 9.8 | 9.8 | |||
| NGC 1379 | 7.8 | 7.8 | |||
| NGC 1380 | 6.2 | 6.2 | |||
| NGC 1399 | 5.0 | 5.0 | |||
| NGC 1404 | 5.0 | 5.0 | |||
| NGC 1407 | 7.4 | 2.5 | 7.4 | ||
| NGC 1427 | 6.5 | 6.5 | |||
| NGC 1700 | 2.3 | 2.6 | 2.6 | 5.1 | 2.5 |
| NGC 3115 | 2.6 | 8.4 | 8.4 | ||
| NGC 3377 | 4.1 | 3.6 | 3.6 | 5.2 | 4.1 |
| NGC 3379 | 9.3 | 10.0 | 10.9 | 8.2 | 9.6 |
| NGC 3384 | 6.5 | 6.5 | |||
| NGC 3610 | 1.8 | 1.8 | |||
| NGC 3923 | 3.3 | 2.6 | 3.0 | ||
| NGC 4278 | 8.4 | 12.0 | 12.4 | 10.9 | |
| NGC 4365 | 3.6 | 7.9 | 7.9 | ||
| NGC 4374 | 11.0 | 12.8 | 3.8 | 11.2 | 11.7 |
| NGC 4472 | 8.5 | 9.6 | 9.6 | 9.2 | |
| NGC 4494 | 6.7 | 6.7 | |||
| NGC 4552 | 9.6 | 12.4 | 12.3 | 11.4 | |
| NGC 4594 | 10.0 | 10.0 | |||
| NGC 4621 | 8.7 | 8.7 | |||
| NGC 4636 | 10.0 | 10.0 | |||
| NGC 4649 | 11.0 | 14.1 | 12.6 | ||
| NGC 5322 | 2.4 | 2.4 | |||
| NGC 5557 | 7.0 | 7.0 | |||
| NGC 5846 | 12.0 | 14.2 | 10.2 | 8.4 | 11.2 |
| NGC 5982 | 12.3 | 12.3 | |||
| NGC 6702 | 1.9 | 1.7 | 1.6 | 1.7 | |
| NGC 6868 | 15.0 | 15.0 | |||
| NGC 7332 | 4.5 | 1.0 | 2.8 | ||
| NGC 7619 | 9.0 | 15.4 | 5.9 | 10.1 | |
| IC 4051 | 12.0 | 15.0 | 13.5 | ||
| TABLE 2 Globular Cluster Mean Colors | ||||||||||
|---|---|---|---|---|---|---|---|---|---|---|
| Galaxy | Type | MV | Blue (V-I)o | error | Red (V-I)o | error | Ref. | Bimodal | Filter | HST? |
| N0584 | E4 | -21.40 | 0.96 | 0.05 | 1.16 | 0.05 | K01 | L | V-I | Y |
| N1052 | E4 | -20.99 | 0.90 | 0.10 | 1.08 | 0.10 | F01 | Y | B-I | N |
| N1316 | S0p | -22.79 | 0.90 | 0.03 | 1.03 | 0.03 | G04 | Y | V-I | Y |
| N1374 | E1 | -20.40 | 0.94 | 0.05 | 1.15 | 0.05 | B06 | Y | C-T1 | N |
| N1379 | E0 | -20.66 | 0.95 | 0.05 | 1.13 | 0.05 | B06 | Y | C-T1 | N |
| N1380 | S0 | -21.70 | 0.87 | 0.10 | 1.16 | 0.10 | K97 | Y | B-R | N |
| N1399 | cD | -21.85 | 0.96 | 0.03 | 1.16 | 0.03 | F98 | Y | B-I | Y |
| N1404 | E1 | -21.41 | 0.91 | 0.03 | 1.17 | 0.03 | F98 | Y | B-I | Y |
| N1407 | E0 | -20.87 | 0.93 | 0.02 | 1.16 | 0.02 | F06 | Y | B-I | Y |
| N1427 | E5 | -20.49 | 0.97 | 0.10 | 1.17 | 0.10 | F01 | Y | C-T1 | N |
| N1700 | E4 | -22.49 | 0.90 | 0.10 | 1.12 | 0.10 | B00 | Y | B-I | N |
| N3115 | S0 | -20.84 | 0.92 | 0.05 | 1.15 | 0.05 | L01 | L | V-I | Y |
| N3377 | E5 | -19.79 | 0.93 | 0.05 | 1.10 | 0.05 | K01 | L | V-I | Y |
| N3379 | E1 | -20.69 | 0.96 | 0.05 | 1.17 | 0.05 | L01 | L | V-I | Y |
| N3384 | SB0 | -20.13 | 0.94 | 0.05 | 1.21 | 0.05 | L01 | L | V-I | Y |
| N3610 | E5 | -21.35 | 0.94 | 0.03 | 1.16 | 0.03 | W02 | Y | V-I | Y |
| N3923 | E4 | -21.92 | 1.00 | 0.10 | 1.20 | 0.10 | Z95 | Y | C-T1 | N |
| N4278 | E1 | -21.11 | 0.92 | 0.05 | 1.12 | 0.05 | K01 | L | V-I | Y |
| N4365 | E3 | -21.41 | 0.98 | 0.03 | 1.19 | 0.03 | L01 | L | V-I | Y |
| N4374 | E1 | -20.92 | 0.91 | 0.03 | 1.07 | 0.06 | G03 | Y | B-R | N |
| N4472 | E2 | -22.81 | 0.94 | 0.03 | 1.21 | 0.03 | L01 | Y | V-I | Y |
| N4494 | E1 | -22.00 | 0.90 | 0.03 | 1.10 | 0.03 | L01 | Y | V-I | Y |
| N4552 | E5 | -21.24 | 0.95 | 0.03 | 1.17 | 0.03 | L01 | Y | V-I | Y |
| N4594 | Sa | -22.00 § | 0.94 | 0.03 | 1.18 | 0.03 | L01 | Y | V-I | Y |
| N4621 | E5 | -21.33 | 0.95 | 0.03 | 1.13 | 0.03 | K01 | Y | V-I | Y |
| N4636 | E | -20.58 | 0.95 | 0.02 | 1.19 | 0.02 | D05 | Y | C-T1 | N |
| N4649 | E2 | -22.40 | 0.95 | 0.03 | 1.21 | 0.03 | L01 | Y | V-I | Y |
| N5322 | E3 | -22.09 | 0.96 | 0.03 | 1.14 | 0.03 | H06 | Y | B-I | Y |
| N5557 | E1 | -22.24 | 0.96 | 0.03 | 1.18 | 0.03 | H06 | Y | B-I | Y |
| N5846 | E0 | -22.23 | 0.94 | 0.03 | 1.15 | 0.03 | F97 | Y | V-I | Y |
| N5982 | E3 | -21.80 | 0.97 | 0.05 | 1.16 | 0.05 | K01 | L | V-I | Y |
| N6702 | E | -21.98 | 0.83 | 0.10 | 1.16 | 0.10 | G01 | Y | B-I | N |
| N6868 | E | -22.17 | 0.91 | 0.07 | 1.12 | 0.07 | D02 | Y | B-R | N |
| N7332 | S0p | -20.09 | 0.88 | 0.10 | 1.08 | 0.10 | F01 | L | B-I | N |
| N7619 | E2 | -22.12 | 0.99 | 0.03 | 1.24 | 0.03 | L00 | Y | V-I | Y |
| I4051 | E | -21.75 | 0.98 | 0.05 | 1.16 | 0.05 | L00 | L | V-I | Y |