The Rotation Velocity Attributable to Dark Matter at Intermediate Radii in Disk Galaxies
Abstract
We examine the amplitude of the rotation velocity that can be attributed to the dark matter halos of disk galaxies, focusing on well measured intermediate radii. The data for 60 galaxies spanning a large range of mass and Hubble types, taken together, are consistent with a dark halo velocity with and over the range kpc. The range in stems from different choices of the stellar mass estimator, from minimum to maximum disk. For all plausible choices of stellar mass, the implied densities of the dark halos are lower than expected from structure formation simulations in CDM, which anticipate . This problem is not specific to a particular type of galaxy or to the innermost region of the halo (cusp or core); the velocity attributable to dark matter is too low at all radii.
1 Introduction
The rotation curves of spiral galaxies provide one of the strongest lines of evidence establishing the need for dark matter in the universe (e.g., Rubin, Thonnard & Ford 1980; Bosma 1981). An elaborate paradigm for dark matter has subsequently developed: CDM. More recent work emphasizes larger scale constraints (e.g., Tegmark et al. 2004; Spergel et al. 2006). An important question is whether this cosmic paradigm provides a satisfactory description of spiral galaxies.
A complete explanation of spiral galaxies in CDM requires a comprehensive theory of galaxy formation. This remains lacking. Indeed, there are a number of lingering problems on small (galaxy) scales. These include the cusp-core problem (e.g., de Blok et al. 2001a), the missing satellite problem (e.g., Moore et al. 1999a), the dynamical friction time scale problem (Goerdt et al. 2006; Sanchez-Salcedo, Reyes-Iturbide, & Hernandez 2006), and a whole suite of other incongruities and apparent contradictions that arise on the scale of individual galaxies (McGaugh & de Blok 1998; Sellwood & Kosowsky 2001). In this paper, we will concentrate on the amplitude of the rotation velocity that is observed for spiral galaxy dark matter halos and that predicted by CDM.
Considerable attention has focused on the density profile inferred for the dark matter halos of dwarf and low surface brightness (LSB) galaxies at small radii (Moore 1994; Flores & Primack 1994; Côté et al. 2000; Swaters et al. 2000; de Blok et al. 2001a,b; Borriello & Salucci 2001; Salucci 2001; Bolatto et al. 2002; Marchesini et al. 2002; Salucci et al. 2003; Swaters et al. 2003a,b; de Blok et al. 2003; Donato et al. 2004; Simon et al. 2003, 2005; Gentile et al. 2004, 2005; Spekkens, Giovanelli, & Haynes 2005; Kuzio de Naray et al. 2006; Zackrisson et al. 2006). There are good reasons for this: LSB galaxies are dark matter dominated down to small radii, making the inference of their dark matter properties much less sensitive to the stellar mass than in higher surface brightness spirals. In the most straightforward analyses, the data appear to contradict a basic prediction of the CDM structure formation scenario, that dark matter halos should have cusps at small radii (a density distribution with : Dubinski 1994; Cole & Lacey 1996; Navarro, Frenk, & White 1997 (hereafter NFW); Tormen, Bouchet, & White 1997; Moore et al. 1998, 1999b; Tissera & Dominguez-Tenreiro 1998; Nusser & Sheth 1998; Syer & White 1998; Avila-Reese, Firmiani, & Hernandez 1998; Salvador-Śole, Solanes, & Manrique 1998; Jing 2000; Jing & Suto 2000; Kull 1999; Klypin et al. 2001; Ricotti 2003; Power et al. 2003; Diemand et al. 2005). The data are apparently more consistent with a nearly constant density core (). Many different solutions to this problem have been proposed (e.g., El-Zant, Shlosman, & Hoffman 2001; Weinberg & Katz 2002; Merritt et al. 2004; Ma & Boylan-Kolchin 2004; Mashchenko, Couchman, & Wadsley 2006; Tonini, Lapi, & Salucci 2006).
Interesting constraints also stem from the rotation curve data for high surface brightness (HSB) galaxies. It is frequently possible to obtain quite high quality data for these bright objects, but the interpretation depends critically on the mass ascribed to baryons. The stellar disks in these objects can be massive (e.g., Debatista & Sellwood 2000; Salucci & Burkert 2000; Weiner, Sellwood, & Williams 2001; Zavala et al. 2003; Kassin, de Jong, & Weiner 2006) or even maximal (e.g., van Albada & Sancisi 1986; Kent 1987; Palunas & Williams 2000; Battaglia et al. 2006). Such dynamically dominant disks leave little room for halos with steep inner density profiles. For example, Binney & Evans (2001) find that cuspy halos are inconsistent with a number of constraints for the Milky Way (cf. Klypin, Zhao, & Somerville 2002). On the other hand, it can be argued that the lack of scale length residuals in the Tully-Fisher relation implies that typically HSB disks are sub-maximal (e.g., Courteau & Rix 1999; cf. Sellwood 1999). If dark matter is dynamically significant in the inner regions of HSB galaxies, then it may be quite possible for the halos of these galaxies to have a steep cusp. The critical issue is the stellar mass.
Constraining the precise inner slope of the dark matter density profile of an individual galaxy is observationally challenging. Even if the stellar mass can be properly treated, a variety of systematic effects might affect the result (Swaters et al. 2003a; de Blok et al. 2003; Simon et al. 2003, 2005; Spekkens et al. 2005). There are several distinct problems here: observational uncertainties, non-circular motions that might cause misestimation of the potential, and degeneracy between fitting parameters.
Observational uncertainties of concern here are those that might lead us to underestimate the steepness of the rise of the rotation curve. This might result, for example, from beam-smearing of 21 cm observations (e.g., van den Bosch et al. 2000) or mis-positioning of the slit during optical observations (e.g., Swaters et al. 2003a). Such errors are not a great concern when rotation curves are observed to be steeply rising, as is typically the case for HSB galaxies in this sample. When the observed rotation curve rises more gradually, there is more potential for concern as to whether this behavior is truly intrinsic (de Blok, McGaugh, & van der Hulst 1997; de Blok & McGaugh 1997). This no longer appears to be a significant worry for LSB galaxies, as high resolution two dimensional velocity fields (Kuzio de Naray et al. 2006) largely confirm pervious results (e.g., McGaugh, Rubin, & de Blok 2001; de Blok & Bosma 2002; see also Zackrisson et al. 2006).
Non-circular motions can be significant at small radii, in the sense that they can represent a substantial fraction of the total gravitational potential. The contributions of circular and noncircular motions sum in quadrature. From this, it immediately follows that non-circular motions () are only important when comparable to the rotational motion (). Simon et al. (2005) show some cases for which this is the case (), albeit at quite small radii. For the sample considered here, which all have two dimensional velocity fields, is typically small (a few to tens of ) compared to at the same radius (tens to hundreds of ). We consider only intermediate and large radii where and the contribution of non-circular motions to the potential is not significant. Galaxies that do not satisfy this criterion are not in the sample.
A more fundamental difficulty is the degeneracy between halo fitting parameters, even when the potential is perfectly well known. The degeneracy between stellar mass and the core radius of a pseudo-isothermal halo has long been known (e.g., Kent 1987). For NFW halos, there is substantial covariance between and even when the stellar mass is fixed (de Blok et al. 2001b). This degeneracy stems from the similarity of the inner shapes of NFW halo velocity profiles over a range of (,). More generally, degeneracy is unavoidable because of a surplus of parameters. Mass models require the specification of a minimum of three parameters per galaxy (one for the disk and two for the halo) while empirically a single parameter suffices to describe the data (e.g., Brada & Milgrom 1999; McGaugh 2004).
In this paper, we adopt a model independent approach. We do not fit specific mass models to individual galaxies. The halo parameters derived from such models inevitably suffer from parameter degeneracies. Rather, we simply ask what range of halo parameters (, ) are consistent with the halo velocities implied by observation. We determine the velocity attributable to the dark matter for a broad range of stellar mass estimators.
We find that the data are consistent with a nearly universal dark matter halo profile. There is some scatter about this relation, and we would not claim that there is in fact a single halo profile appropriate to all galaxies, but the data are not wildly at odds with such a situation. The slope we find is consistent with previous determinations (e.g., Barnes, Sellwood, & Kosowsky 2004). If halos have the NFW form, their concentrations and/or masses () are generally smaller than might nominally be expected in CDM. This is largely consistent with various previous results (e.g., Debatista & Sellwood 2000; Weiner et al. 2001; Borriello & Salucci 2001; Zentner & Bullock 2002; Alam, Bullock, & Weinberg 2002; McGaugh et al. 2003; Bell et al. 2003a; Gentile et al. 2004; Zackrison et al. 2006; Portinari & Sommer-Larsen 2006) that suggest that real dark matter halos are less dense than predicted by CDM.
The data and stellar mass estimators are described in §2. In §3 we determine the halo velocity implied by the data for a range of stellar mass estimates. The predictions of CDM models and their relation to the data are described in §4. The implications of the result and possible ways to reconcile the apparent discord between theory and observation are discussed in §5. A summary of our conclusions is given in §6.
2 Data
2.1 Sample
We employ the rotation curve data and mass models compiled by Sanders & McGaugh (2002), as trimmed for quality by McGaugh (2005). These data originate from many independent observers, and represent the accumulated effort of a substantial community of astronomers. Sample galaxies span a wide range of morphological types, from Sab through all spiral types to Irr/Im. Recent work by Noordermeer et al. (2005) focussing on the earliest (S0/Sa) type disk galaxies appears contiguous with the data used here. More important than morphological type is the broad range of physical parameter space that our sample spans. It includes galaxies with circular velocities , baryonic masses , scale sizes kpc, central surface brightnesses , and gas fractions . No restriction is made on surface brightness or any other physical parameter. The sample represents the dynamics of disks in the broadest sense possible with available data.
All sample galaxies have high quality, extended rotation curves derived from 21 cm data cubes. The high precision sample of McGaugh (2005) consists of 60 galaxies with independent, resolved rotation velocity measurements, each with formal accuracy of 5% or better. We choose to exclude data with kpc where the controversy over cusp or core occurs (de Blok 2004). The point here is to compare reliable data with the expectations of CDM models, free from concern over systematic uncertainties, either observational (such as beam smearing) or physical (e.g., non-circular motions). These may be serious concerns for constraining the innermost slope of the density profile, but do not significantly affect the data at intermediate radii. Here the data are well resolved, and the observed circular velocity greatly exceeds the velocity dispersion. Indeed, strong constraints exist on the ellipticities of the potentials for some sample galaxies (Schoenmakers, Franx, & de Zeeuw 1997). Triaxiality of the halo (e.g., Hyashi & Navarro 2006) is not relevant to the bulk of the data here.
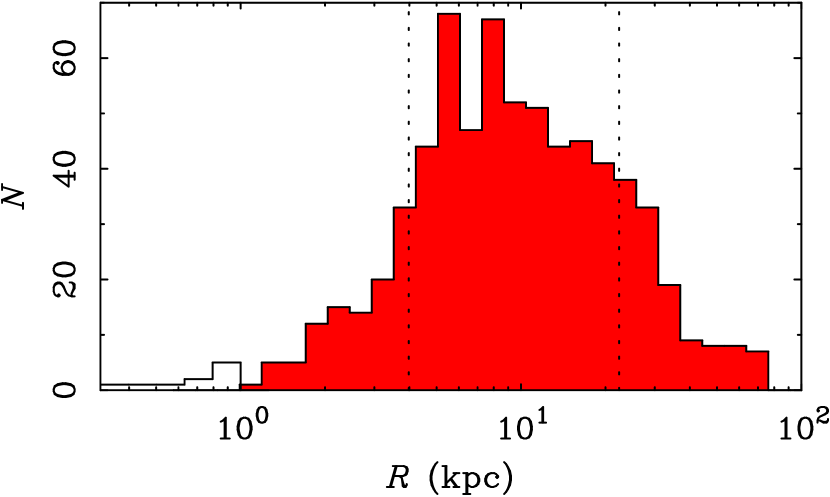
We exclude the possibility of non-circular motions biasing the results at small radii by truncating the inner data. Our result is not sensitive to the choice of the inner truncation radius. The total radial range sampled is from 1 to 74 kpc, with a median radius of 9 kpc. Only a few galaxies have measured rotation extending to very large radii. The bulk of the data (68%) fall in the range kpc (Fig. 1). Data in this range are not only numerous, but fall in a range where the systematic concerns discussed above have negligible impact. The same result follows if we restrict the data to this very conservative range.
For many galaxies in the sample, the contribution of the stars to the total potential can not be ignored. This dominates all other effects by far. It is necessary to subtract off the baryonic contribution to reveal the velocity due to the halo. All galaxies have detailed surface photometry from which baryonic mass models are derived.
For the present work, we utilize -band surface photometry, as this is the only band that all 60 galaxies have in common. We are working to place the sample on a uniform -band scale, but at present lack sufficiently deep observations of some of the fainter galaxies. Using the -band data already in hand does not alter the basic result (see also Verheijen 2001; Verheijen & Sancisi 2001; Kassin et al. 2006).
We make no assumption about the light profile (e.g., exponential disk). The observed light distribution is converted to a baryonic rotation curve numerically (via GIPSY: van der Hulst et al. 1992). This includes the bulge (when present), stellar disk, and Hi gas. The molecular gas distribution is not available in most cases, but this is likely to be a small percentage of the baryonic mass in the majority of late type galaxies (Young & Knezek 1989). Moreover, the molecular gas generally follows the stellar distribution (Helfer et al. 2003), so is effectively subsumed into the stellar mass-to-light ratio. It is the estimation of stellar mass that is most crucial.
2.2 Stellar Mass
The observed rotation curves provide a good map of the total gravitational potential that is due to both baryonic and dark mass. While the total potential is well constrained, dividing it into baryonic and dark mass components is a degenerate process. Additional information is needed to break this degeneracy.
We explore three methods for estimating the stellar mass-to-light ratio : maximum disk, ; stellar population synthesis models, ; and that from the mass discrepancy–acceleration relation, . This latter in effect treats MOND (Milgrom 1983) fits (Sanders & McGaugh 2002) as an empirical phenomenology. That this phenomenology is present in the data is all that is required, regardless of the underlying physical reason for it (McGaugh 2004).
Following McGaugh (2005), we can choose any arbitrary stellar mass estimate by scaling each of these prescriptions by a constant factor , , or :
| (1a) | |||
| (1b) | |||
| (1c) | |||
This scheme allows us to explore the full range of possible stellar masses () with three independent estimators for each galaxy. The population synthesis mass-to-light ratio is estimated from the observed color (as tabulated by McGaugh 2005) and the models of Bell et al. (2003b):
| (2) |
Very similar results follow from other models (e.g., Portinari et al. 2004). The chief uncertainty of this method is the IMF. corresponds to the nominal “scaled Salpeter” IMF adopted by Bell et al. (2003b), which for our purposes is nearly indistinguishable from the Kroupa (2002) IMF adopted by Portinari et al. (2004; see also Portinari & Sommer-Larsen 2006). To consider the effects of a heavier or lighter IMF, we simply scale by (see discussion in Bell & de Jong 2001).
3 Empirical Halo Estimates
We estimate the circular velocity provided by dark matter by subtracting the baryonic component from the observed rotation curves for each choice of :
| (3) |
Here is the rotation velocity attributed to the dark matter, is the observed rotation velocity, and is the rotation velocity attributed to baryons. This depends on through , where is the rotation velocity for . The Hi gas component, corrected to account for helium and metals, gives . Molecular gas generally traces the stellar distribution (Helfer et al. 2003) and is subsumed into .
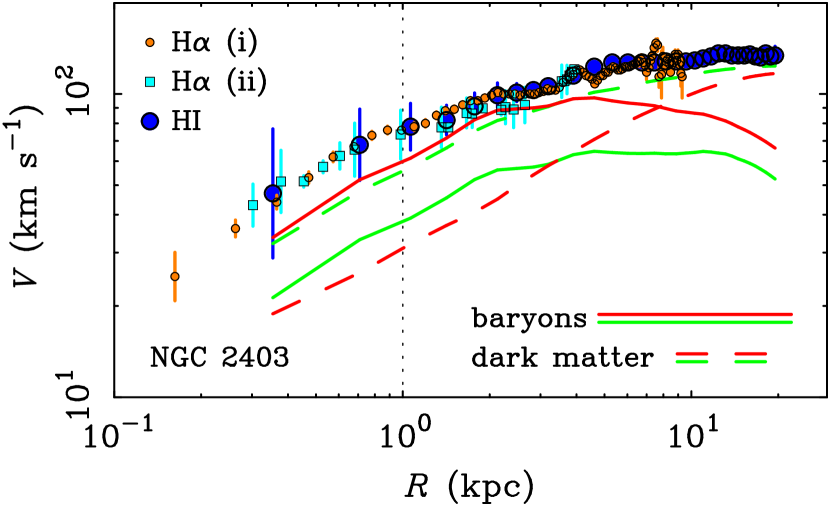
An example rotation curve is shown in Fig. 2. As we increase (decrease) by varying , , and , the stellar contribution to the total rotation increases (decreases) and the corresponding contribution from the dark matter decreases (increases). Though the details of each realization depend on the estimator and the relative importance of gas (which does not vary), it is a tolerable approximation to imagine the dark and baryonic lines in Fig. 2 sliding up and down see-saw fashion.
In order to restrict our attention to the best data, we have excised individual points with uncertainty in excess of 5%. In many cases, the formal precision is rather greater than this limit. While this leaves plenty of data to analyze, various astrophysical considerations make it unrealistic to consider those data with small error bars as accurate estimates of the circular velocity of the potential (see discussions in McGaugh et al. 2001; de Blok et al. 2003). We therefore give uniform weight to the data which pass the 5% criterion.
A more serious uncertainty than that in the data is that in . The estimate of stellar mass is the single dominant source of uncertainty in this analysis. The systematic nature of this uncertainty makes it impossible to propagate it in a meaningful way. Hence we simply examine the results of adopting each estimator, leaving it to the reader’s judgement which case might seem best. Fortunately, the basic result is fairly insensitive to this choice.
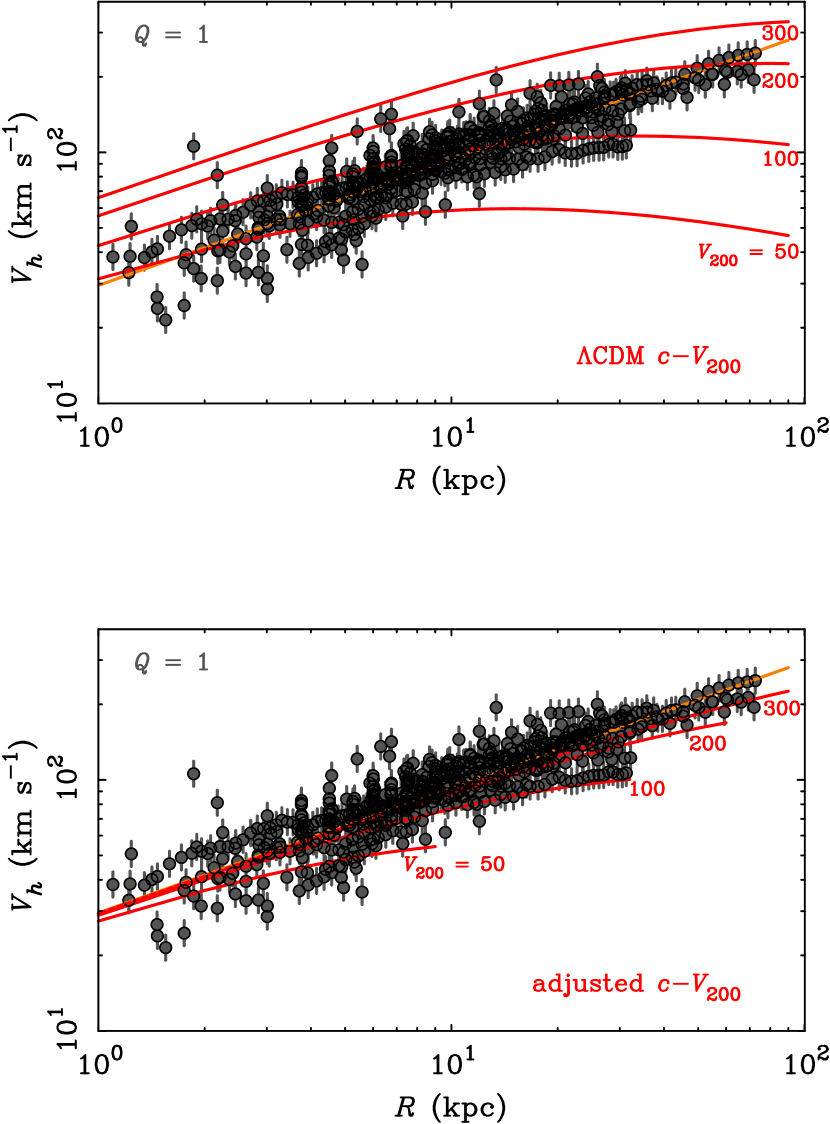
In Fig. 3 we show for all 60 galaxies plotted together for the case of . Remarkably, the inferred dark matter halos of all these galaxies fall more or less on top of each other. This is not to say that the dark matter halos of all galaxies are the same. Quite the contrary, it is possible to observationally distinguish between the dark matter halos of individual galaxies (Sancisi 2004; McGaugh 2004; Barnes et al. 2004; Simon et al. 2005). Nonetheless, when plotted together in this fashion, the apparent variation is remarkably small.
Taken together, the data suggest a relation
| (4) |
Fitting the data with gives and . While we would not claim that this is a universal halo that all galaxies share, it does give a tolerable approximation of the velocity attributable to dark matter.
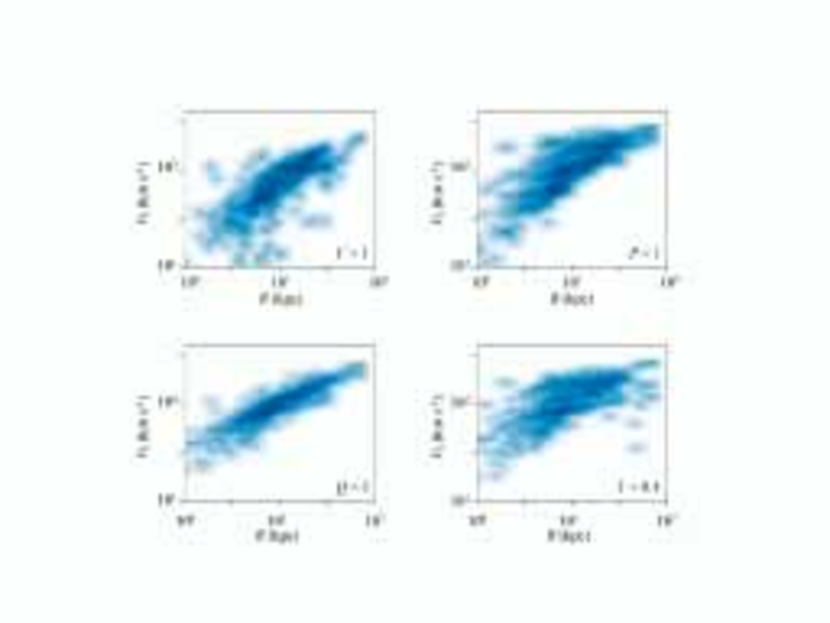
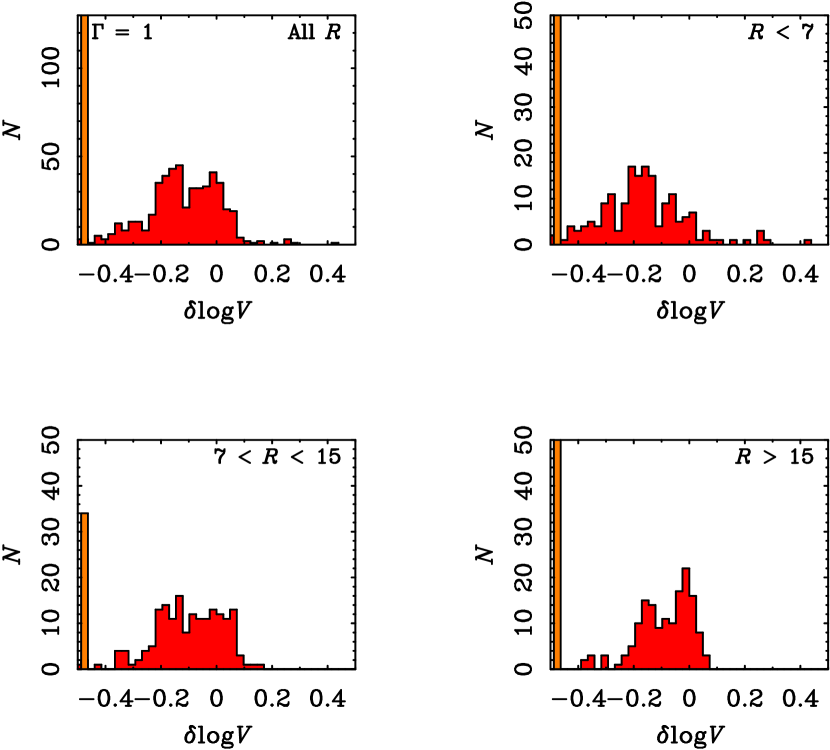
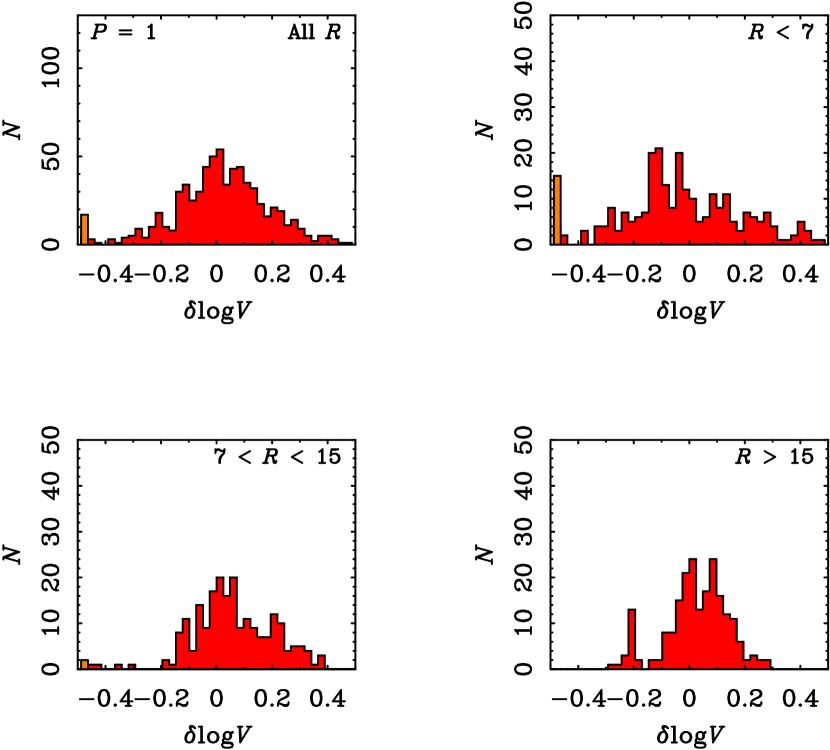
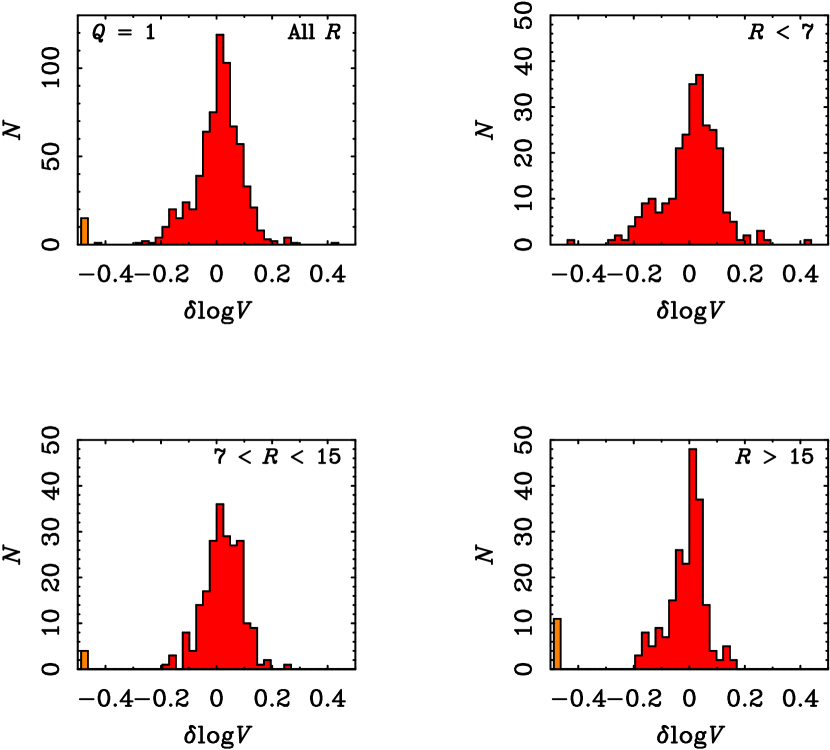
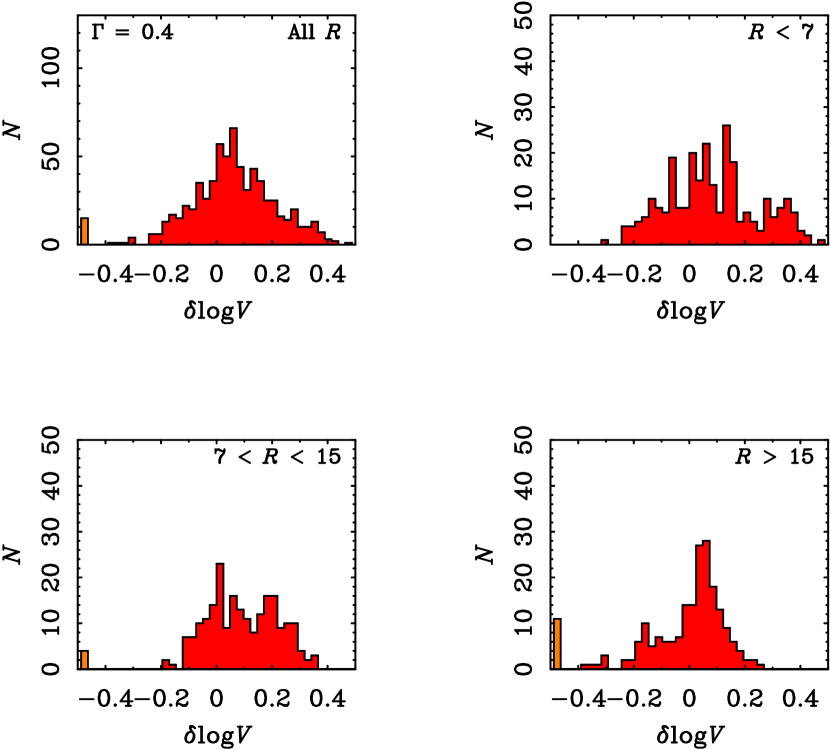
We can extend this approach to other mass-to-light values by varying , , and . The cases , , and (the latter as suggested111These authors phrase the disk contribution in terms of the velocity at 2.2 scale lengths. Since , corresponds to . by Bottema 1993 and Courteau & Rix 1999) are illustrated in Fig. 4. This figure is like Fig. 3 for the various mass estimators, but with shading to illustrate the density of data. The darker the shading, the more sharply defined the relation between and radius.
There is some covariance between the slope and intercept . Our purpose here is to constrain the amplitude of the velocity that can be attributed to dark matter. In order not to obscure the basic result with uncertainties introduced by covariance, we fix the slope to , consistent with our data (see Figs. 5 – 8) and those of Barnes et al. (2004). Moreover, the slope does not vary appreciably when left free; the important information is contained in the amplitude.
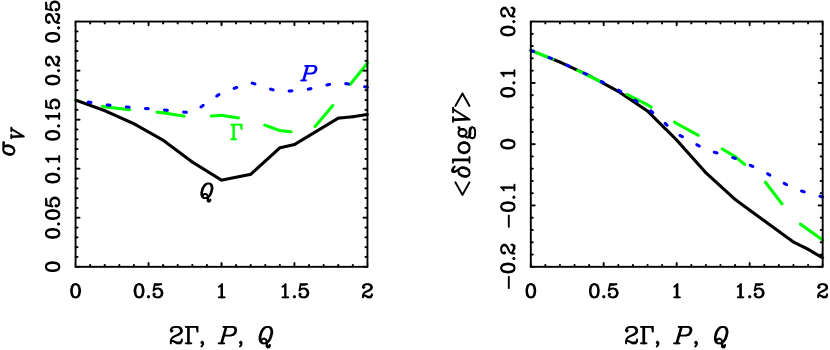
Fixing changes the best fit intercept to . This number encodes, in the simplest possible way, the amplitude of the dark matter velocity. Fig. 9 show how this amplitude varies as we change . For , the amplitude barely changes: . For the full range of possibilities, from minimum to maximum disk, we find and . In other words, the amplitude of the velocity provided by the dark matter falls in the range for .
One can also see in Fig. 9 variation in the scatter about the mean. Remarkably, the scatter is minimized for , the MOND mass-to-light ratios. This is also the choice of which minimizes the scatter in the baryonic Tully-Fisher relation (McGaugh 2005) and, by construction, that in the mass discrepancy–acceleration relation (McGaugh 2004). Irrespective of the physics that causes it, this implies that MOND is an important empirical organizing relation that is relevant even to dark matter. The scatter is larger for other mass estimators, but the basic result encapsulated by is the same.
4 CDM Halos
Cosmological simulations lead to mass distributions for dark matter halos that have gravitational potentials which can be analytically approximated as
| (5) |
where and (NFW). The radius encloses a density 200 times the critical density of the universe; is the circular velocity of the potential at .
The radius is, crudely speaking, the virial radius in a critical density universe. For current CDM parameters, the virial radius is more nearly at (e.g., Eke, Navarro, & Steinmetz 2001). More recently, Navarro et al. (2004) have suggested that a density profile with a continuously running slope provides a better fit to simulated halos than the original NFW formula. From an observational perspective, these forms are virtually indistinguishable. We therefore retain the NFW formulation for its familiarity and its well quantified relation to cosmological parameters (NFW; McGaugh, Barker, & de Blok 2003).
One interesting aspect of the data is that there is no clear tendency for the dark halo rotation curves to flatten out. The combination of disk plus halo is often close to flat, and as the disk contribution is declining, it is natural to associate the flat rotation velocity with the halo. This is, however, an oversimplification. In most cases, the inferred dark matter contribution to the velocity is still rising at the last measured point, and it is not clear that the observed flat velocity is truly representative of the halo.
In the context of simulated halos, the lack of a flat halo rotation velocity may help the models. NFW halos do not possess a significant range of radii where , as needed to produce flat rotation curves. Presumably, the observed range suffices only to cover the rising portion of the halo, with a suggestion of a turn-over in only a few sufficiently extended cases. It remains an open question why the disk and halo conspire to produce nearly flat rotation curves over the range observed.
It is suggestive that the fitted slope is that expected for the inner portion of NFW halos. It is tempting to conclude that halos are indeed NFW, and we will use this to compare the observed and predicted amplitudes . An important caveat is that it is not straightforward to match the radial scale of simulated halos to that of real galaxies. It is for this reason that the amplitude provides the most robust comparison: it uses all the data to set the velocity scale, in effect providing an integrated measure that is not sensitive to systematic effects in the way the innermost slope may be.
The slope of the data is, if anything, too close to a constant . NFW profiles have this slope at small radii, though the exact slope the simulations predict is still debated (e.g., Ricotti 2003; Power et al. 2003; Navarro et al. 2004; Diemand et al. 2005). Irrespective of this detail, all simulations agree that the inner slope gradually transitions to a steeper fall off (becoming at large radii). The consequence is that there should be some curvature apparent in over the radial range sampled by the data. This is not obvious in the observations (Fig. 3). This difference between simulations and data is sufficiently large that the difference between the various proposed analytic formulas is a rather small concern. The use of individually simulated halos (e.g., Hayashi et al. 2004; cf. de Blok 2005) in preference to the analytic approximations should not make a difference to the radii of interest here, where the deviations between the various realizations of the simulation results are small.
In addition to the data, the upper panel of Fig. 3 shows the predicted shape and amplitude of NFW rotation curves for a range of . Presuming galaxy halos span a range of mass comparable to that suggested by their luminosities, one would not only expect more curvature than observed, but also a wider spread in (compare, for example, the halos with and ). That the data concentrate in this plane more than anticipated might suggest that we may err in presuming that halo masses span the same range of mass as the observed luminosity, or that the simulated - relation built into the lines in the upper panel of Fig. 3 may not be precisely correct.
One must bear in mind, of course, that the data only extend over a finite range of radii, and do not generally show the inevitable maximum and decline in . Though it is difficult to assign a specific halo to a particular galaxy, taken together the data are suggestive of an envelope composed of halos of a range of masses. If we had complete knowledge of the potentials out to arbitrary radii, we might see individual halos peeling away from this envelope as illustrated by the lines in the bottom panel of Fig. 3.
For comparison with the data, we can ask what we would expect to find from a CDM model observed in the same way as the data. We sample a series of halos with (e.g., the lines in the top panel of Fig. 3). Model data points are allowed to fill the space available to them within the observed range of radii. The model points are uniformly sampled and weighted since we have no knowledge of the underlying halo mass distribution, other than that it gives rise to the broad observed range of luminosities and rotation velocities. Since no turn-over ( of the halo) is observed in the data, the maximum radius to which halos are sampled is truncated along the lower edge of the observed envelope, as defined by a line with slope 1/2 and intercept 1.33. The result of fitting the model halos is and for the vanilla CDM parameters of Tegmark et al. (2004). For the third year WMAP parameters (Spergel et al. 2006), decreases to 1.61. This normalization is too large, being consistent with the observed value only in the limit of zero stellar mass ().
The - relation can be adjusted in order to match the NFW model to the observed amplitude of the data. This is illustrated in the lower panel of Fig. 3 by lines representing NFW halos with parameters chosen to match the observed normalization . In effect, this provides an empirical estimate of the - relation. We can do this for the value of implied by any choice of . To get the zero point amplitude () for NFW, let us rewrite equation (5) in log-log space. In the limit222The limit might seem like a dubious approximation since we have excluded the data at kpc. However, it is in fact quite a good approximation both theoretically (since and we are concerned with data at a small fraction of the virial radius) and empirically (since the observed slope is close to limiting case of 1/2). we have:
| (6) |
where
| (7) |
and the factor appears because when is in and is in kpc (NFW). Written this way, we recognize with . We can thus relate NFW parameters to the data through the observed :
| (8) |
(the data assume ). In this fashion, we can generate the range of (, ) that are acceptable to the data (Fig. 10). Note that we do not specify the particular values of these parameters for any given galaxy. Rather, we constrain the range of - parameter space from which the observed halos may be drawn.
The parameters of NFW halos in simulations are not arbitrary. There is a correlation between and (NFW) with fairly modest333Note that the scatter found by Colín et al. (2004) is half that found by Bullock et al. (2001). We adopt the more conservative (larger) scatter here. Adopting the smaller scatter would simply make the predicted bands in Fig. 10 wide. scatter (Jing 2000; Bullock et al. 2001; Colín et al. 2004). Moreover, the typical concentration depends on the cosmology (NFW). For a halo, McGaugh et al. (2003) found that the mean
| (9) |
where
| (10) |
NFW found that the density of halos depends on the density of the universe at the time of collapse. This depends on and the amplitude of the power spectrum at the appropriate scale, as encapsulated by the above formula. The concentration varies slowly with scale (NFW).
For illustration, we adopt CDM parameters from the Tegmark et al. (2004) and Spergel et al. (2006). We use the 6-parameter ‘vanilla’ fit of Tegmark et al. (2004), and the results of the 3 year WMAP-only fit from Spergel et al. (2006). While superficially these may appear similar, the concentrations of dark matter halos are quite sensitive to cosmic parameters, so there is a noticeable difference.
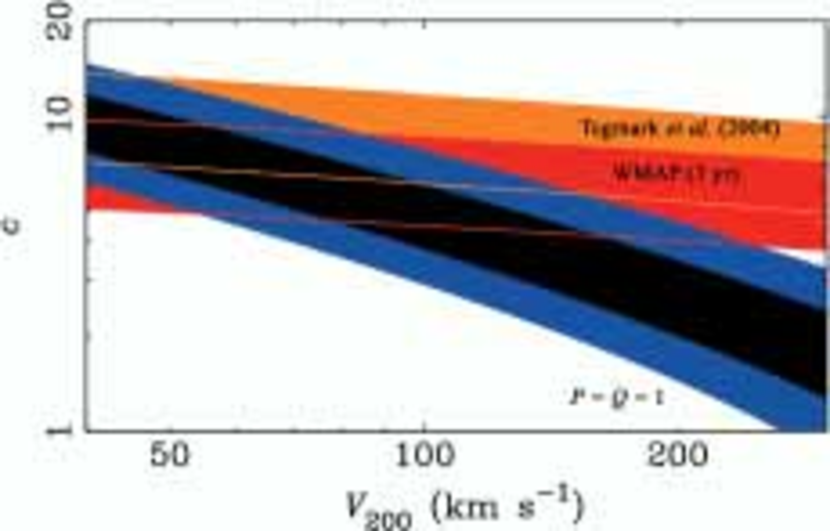
The observed and predicted - bands are illustrated in Fig. 10. For the scatter in CDM concentrations, we adopt (Bullock et al. 2001). Similarly, we illustrate the range of observed halos (i.e., the band that contains 68% of the halos from the histograms in Figs. 6 and 7). The predicted and observed bands do not match up well, having only a modest range of overlap at surprisingly small .
5 Discussion
The cusp-core problem in dwarf and LSB galaxies is well known. Inspection of Fig. 10 reveals a more general problem with the densities of the dark matter halos of all spiral galaxies. The data are consistent with a swath of - space that does not parallel the predictions of CDM. The acceptable regions of halo parameter space diverge as mass increases.
This result can not be attributed to inadequate resolution or slit positioning errors. All of the data are derived from resolved two dimensional velocity fields. We have intentionally excluded data from the innermost region where the resolution might be questioned. Significant non-circular motions could be seen directly in the velocity fields. The result does not change if we exclude444This result is slightly less restrictive than the maximum halo acceleration limit (Brada & Milgrom 1999; McGaugh 2004) because we ignore here where NFW halos provide their maximum acceleration. even more of the inner data (see Fig. 1; imagine truncating Fig. 3 at 2 or 3 kpc). It is the velocity attributable to dark matter at well resolved intermediate radii that is lower than expected in CDM.
Let us examine the implications of this result, and possible ways out, starting with the theoretical expectations. Two fiducial CDM models are illustrated in Fig. 10. The model of Tegmark et al. (2004) is a good representation of standard vanilla CDM, predicting very nearly the same swath of - parameter space as other plausible choices for cosmological parameters, going back to the early work of NFW. The WMAP three year results (Spergel et al. 2006) noticeably lower the predicted halo concentrations. This is due to slight changes in all of the relevant parameters. The dominant effect is from the lower power spectrum normalization , a result anticipated both by cluster (e.g., Rosati, Borgani, & Norman, 2002; Diego et al. 2003) and galaxy work (Zentner & Bullock 2002; McGaugh et al. 2003; van den Bosch, Mo, & Yang 2003). The tilt () and the lower matter density () also contribute. As we add in large scale constraints beside WMAP, the parameters tend555See http://lambda.gsfc.nasa.gov/product/map/current/parameters.cfm to drift back towards those of Tegmark et al. (2004).
The lower concentrations implied by the more recent WMAP results do help. Ignoring the trend with for the moment, equation (9) implies for the cosmic parameters of Tegmark et al. (2004), whereas the new WMAP data (Spergel et al. 2006) imply . This difference is quite pronounced in rotation curves. The revised WMAP results at least bring cosmic data into the right ballpark: McGaugh et al. (2003) found for dark matter dominated galaxies, though it should be noted that this typical value ignores problematic cases with or for which NFW simply does not fit.
The problem here is not so much the mean concentration, but the run of concentration with halo mass. Concentrations are acceptable for low mass halos (those with ). They become increasingly discrepant with increasing mass. By the time we reach (), the data imply . This is nominally the mass scale of the Milky Way (e.g., Wilkinson & Evans 1999; Sakamoto, Chiba, & Beers 2003), and the low inferred concentration is consistent with both Milky Way constraints (Binney & Evans 2001; Flynn et al. 2006) and those for comparable galaxies (e.g, Weiner et al. 2001). To obtain such a low concentration from initial conditions would require absurd changes to cosmology: or .
This basic result is virtually independent of the choice of mass-to-light ratio estimator. The distribution of is not as sharply peaked for as it is for , but the mean is nearly the same, so the same result is obtained. Worse, changing (or or ) simply shifts the bands left (for ) or right (for ) in Fig. 10. It does little to alter the differing slope of the observed and predicted - bands.
In order to fix the mismatched slopes with , we would have to make the stellar mass indicator a systematic function of . Specifically, would have to get progressively smaller as halo mass increases. This is quite contrived. There is no evidence to suggest that the stellar populations of massive spirals are systematically lighter than those of dwarfs. Indeed, such a contention can likely already be excluded by the need for a substantial stellar contribution to the mass in at least some high surface brightness galaxies (e.g., Debattista & Sellwood 2000; Weiner et al. 2001; Kassin et al. 2006; Battaglia et al. 2006). In contradiction to this, Jimenez, Verde, & Oh (2003) argue that rotation curve fits tolerate the expected concentrations for NFW halos. However, this comes at the expense of unrealistic . The -band distribution of Jimenez et al. (2003) is bimodal (their Fig. 7), with roughly half of the galaxies centered on . So they in fact find the same result, that mass-to-light ratios need to be quite low in order to be reconciled with the expected NFW concentrations. A velocity-variable IMF might achieve this, but it would introduce an unreasonable amount of scatter into the baryonic Tully-Fisher relation (McGaugh 2005).
The mismatch between the slopes of the observational and theoretical bands in Fig. 10 is caused by the near universality of the empirical dark matter halo found in §3. The data can be described, albeit crudely, by a single simple form (equation 4). According to NFW, this should not be the case — halos should spread out (e.g., top panel of Fig. 3), not clump together as observed. In this case, we would expect to see more data at high at small . While there are choices of that have some data in this region, the bulk of the data do not reside there (Fig. 4).
The slope of the observed bands in Fig. 10 is the result of adjusting the NFW halos concentrations to match the data with . It is worth checking how this changes if we allow the slope to be free. A choice that leads to a shallower slope and higher amplitude is needed to reconcile the data with the model.
Leaving both the slope and the intercept free in the fit, we obtain and for . This steeper slope goes in the wrong direction, as it would make the band in Fig. 10 cut somewhat more steeply across the predicted band. Using the two dozen galaxies for which we have -band data and assuming a constant (the value for the mean color), we obtain and , consistent with . Increasing the stellar mass makes things worse, maximum disk being the limiting case ( and for ): there is too little velocity attributable to dark matter at small radii. Lowering the stellar mass within reasonable bounds does not help either. For , and . This a band with precisely the same slope as illustrated; the change in only shifts the band a bit to the right. The case of (Bottema 1993) gives results indistinguishable from . To push the stellar mass low enough to get into the right ballpark, we need ( and for ). This corresponds to an IMF that is a factor of 5 less massive than Salpeter. This is below the practical minimum in stellar mass as determined from direct integration of the observed IMF (Kroupa 2002). It is also grossly inconsistent with the coherence of the mass discrepancy–acceleration relation (McGaugh 2004) and baryonic Tully-Fisher relation (McGaugh 2005), the presence of baryonic features observed in rotation curves (Palunas & Williams 2000; Sancisi 2004; Kassin et al. 2006; Battaglia et al. 2006), observed velocity dispersions (Bottema 1997; Kregel, van der Kruit & Freeman 2005), and hydrodynamical flows (Weiner et al. 2001; Kranz, Slyz & Rix 2003). There appears to be no plausible choice of that is consistent with cosmological expectations and NFW, at least for halos with comparable to the observed circular velocity.
We have so far implicitly assumed that halo mass scales linearly with baryonic mass. This need not be the case. One possibility to consider it that the observed luminosity function of galaxies descends from parent dark matter halos spanning a smaller range of mass. This would require a systematic variation in the fraction of baryons that form the luminous disk (McGaugh & de Blok 1998; Okamoto et al. 2005), but this may already be required to match the observed Tully-Fisher relation (van den Bosch 2000; Mo & Mao 2004; see also Navarro & Steinmetz 2000; Eke et al. 2001; Portinari & Sommer-Larsen 2006; Dutton et al. 2006).
If we drop the assumption that total mass scales with baryonic mass, it is tempting to conclude that galaxies may be born from halos in the region allowed in Fig. 10. This would mean that even massive galaxies with observed rotation velocities in excess of 200 (ranging all the way up to 300 ) would have their origins in relatively modest halos. From Fig. 10, we need for vanilla CDM, and for WMAP third year parameters. Galaxies would presumably gain their larger observed velocities during the collapse of their massive disks (see below).
Examination of Figs. 3 and 4 reveals that halos with are about right to explain much of the data. Unfortunately, such low mass halos do not provide a complete explanation. For one thing, there need to be enough baryons available in the halo to form the observed galaxy. Assuming a universal baryon fraction of 0.17 (Spergel et al. 2006), and the most favorable case that all baryons within collapse to form the visible galaxy, a halo with has enough baryons to make a galaxy with . This assumes mass-to-light ratios and the baryonic Tully-Fisher relation of McGaugh (2005). There is some room to play with the choice of , but this does little more than assuage the extreme assumption that all baryons666In CDM, the virial radius is closer to than , further reducing the number of available baryons. collapse to form the observed galaxy. It is therefore rather difficult to ascribe the known spiral galaxies with to NFW halos of low mass but normal concentration, at least for vanilla CDM. This constraint is relaxed for WMAP 3 year parameters, but even here a halo with can give at most enough baryons for a galaxy with (again taking ).
Looking in detail, NFW halos obeying the expected - relation have more curvature than observed, predicting too high a velocity at small and too small a velocity at large relative to the data. Even if we overlook the over-prediction at kpc, the under-prediction at kpc is quite serious. The compressive formation of a massive disk can raise , but this process is much more effective at small radii than at large radii. In order to explain the high observed dark halo velocity at large radii, it seems necessary to have initial halos with at least . Such halos grossly over-predict at small if they obey the vanilla - relation. It may be tempting to simply ignore the data at large radii, as there are relatively few with kpc. However, there do exist galaxies outside this sample (e.g., Noordermeer et al. 2005; Spekkens & Giovanelli 2006) with outer rotation velocities approaching 300 . These galaxies show no sign of a turn down in their outer velocities, and obey the same scaling relations as those in the present sample, so there is no reason to expect them to be any different. The need for large at large radii is thus a serious problem.
So far, we have compared the data to the CDM predictions for primordial dark matter halos. It is possible that the process of galaxy formation alters the halos. If so, the difference between the predictions and observations might be interpreted to show what changes occur in this process. One should bear in mind that cuspy mass distributions seem to be a generic result of cold collapse (e.g., Huss et al. 1999), and that, once established, it is very hard to unbind the mass in the deep potential wells of cuspy halos. Achieving the desired effect is thus a tall order from the outset (Sommer-Larsen & Dolgov 2001; Eke et al. 2001).
The primary physical effect which should occur during galaxy formation is the adiabatic contraction of the dark matter halo in response to the collapse of the baryonic disk (e.g., Blumenthal et al. 1986; Barnes & White 1984; Gnedin et al. 2004; Sellwood & McGaugh 2005; Choi et al. 2006). The effect of adiabatic contraction is to further concentrate the dark matter. This goes in the wrong direction to help with the problems discussed here. However, there are two distinct aspects of adiabatic contraction to consider. The slope will steepen from its initial value; this goes in the wrong direction. The velocity provided by the dark matter also increases. While this might also seem to act in the wrong direction, it means that a galaxy of a given rotation velocity may form in a halo with lower primordial . As discussed above, this can help, at least in principle. Unfortunately, it seems unlikely that the effect can be large enough to help at large radii without simultaneously doing far too much at small radii. Disks heavy enough to have a substantial impact on outer velocities grossly over-predict inner velocities if the starting point is an NFW halo (Abadi et al. 2003; Sellwood & McGaugh 2005). To make matters worse, Dutton et al. (2006) argue that a large difference between the observed and initial halo velocity scales would make reconciling the normalization problem between Tully-Fisher and the luminosity function practically impossible. Low mass halos might also be inconsistent with constraints from weak lensing (Smith et al. 2001; Mandelbaum et al. 2006).
After adiabatic contraction, there may be some subsequent process that further alters the halo. Perhaps the most common example is feedback from star formation. Quite generically, the effects of feedback are believed to be stronger in lower mass galaxies owing to their shallower potential wells (e.g., Thacker & Couchman 2000). Such an effect is unlikely to be sufficiently strong (Mac Low & Ferrara 1999; Gnedin & Zhao 2002) and acts preferentially on the wrong end of the mass function. It is the concentrations of high mass galaxies (if not necessarily the slope ) that are most deviant from the predictions of CDM. If the solution to this problem lies in the processes of galaxy formation, it likely resides in a rather different direction (see, for example, El-Zant et al. 2001; Weinberg & Katz 2002; Merritt et al. 2004; Ma & Boylan-Kolchin 2004; Mashchenko, Couchman, & Wadsley 2006; Tonini, Lapi, & Salucci 2006; see also Sellwood 2006).
Another approach would be to alter the initial conditions. A turndown in the power spectrum on galaxy scales can reduce halo concentrations. However, such a solution would require a rather strange dip in the power spectrum. Concentrations at small scales are not unreasonable, and also make sense on larger (cluster) scales (e.g., Vikhlinin et al. 2006). It is the intermediate scale of massive spirals, giant ellipticals (Romanowsky et al. 2003; Pierce et al. 2006), and groups (Karachentsev 2005) where the halo concentration prediction777The prediction of a steep inner slope, — the shape rather than the amplitude — continues to suffer most clearly in LSB systems (Simon et al. 2005; Kuzio de Naray et al. 2006; Goerdt et al. 2006; Sanchez-Salcedo et al. 2006). of CDM simulations fares worst.
Another possibility is to modify the nature of dark matter. The cusp-core problem has already motivated consideration of various possibilities, such as warm (Bode, Ostriker, & Turok 2001), fuzzy (Hu, Barkana, & Gruzinov 2000), self-interacting (Spergel & Steinhardt 2000), and meta-cold (Strigari et al. 2006) dark matter, among others (e.g., Piazza & Marinoni 2003; Lee & Lee 2004; Blanchet 2006). It is not immediately clear how any of these proposals fare in the current context. However, many proposals seem to be meant to produce dark matter halos with a core. This in itself is not a complete solution. One must get the density right, and do so on all relevant scales.
6 Conclusions
We have examined the rotation curves of a large sample of spiral galaxies in order to constrain the velocity that can be attributed to dark matter. Taken together, the dark halo velocity can be approximated by
with and . The value of depends on the choice of stellar mass-to-light ratio, with the uncertainty corresponding to the full range of possibilities from minimum to maximum disk. While the dark matter halos of individual galaxies must differ, this relation gives a tolerable approximation over the observed range.
In the context of CDM, the densities of halos depends on cosmology. For reasonable cosmological parameters, we expect . This is only consistent with the data in the limit , which is excluded by a wide variety of independent lines of evidence. The problem is not just that rotation curve data prefer halo models with a core over those with a cusp. The amplitude of the velocity provided by dark matter is too low at all observed radii.
We have emphasized here the importance of spiral galaxy dark matter halo densities being substantially lower than anticipated by CDM. For halos of , the density discrepancy is nearly an order of magnitude (see also Sellwood 2006). Getting the halo density in the right ballpark would be an important step towards a successful theory. Ultimately, one must explain in detail the observed coupling between dark and baryonic components (e.g., Sancisi 2004; McGaugh 2004).
References
- (1) Abadi, M. G., Navarro, J. F., Steinmetz, M., & Eke, V. R. 2003, ApJ, 591, 499
- (2) Alam, S. M. K., Bullock, J. S., & Weinberg, D. H. 2002, ApJ, 572, 34
- (3) Avila-Reese, V., Firmiani, C., & Hernandez, X. 1998, ApJ, 505, 37
- (4) Barnes, E.I., Sellwood, J.A., & Kosowsky, A. 2004, AJ, 128, 2724
- (5) Barnes, J., & White, S. D. M. 1984, MNRAS, 211, 753
- (6) Battaglia, G., Fraternali, F., Oosterloo, T., & Sancisi, R. 2006, A&A, 447, 49
- (7) Bell, E. F. & de Jong, R. S. 2001, ApJ, 550, 212
- (8) Bell, E. F., Baugh, C. M., Cole, S., Frenk, C. S., & Lacey, C. G. 2003a, MNRAS, 343, 367
- (9) Bell, E. F., McIntosh, D. H., Katz, N., & Weinberg, M. D. 2003b, ApJS, 149, 289
- (10) Binney, J. J., & Evans, N. W. 2001, MNRAS, 327, L27
- (11) Blais-Ouellette S., Amram P., Carignan C., Swaters R. 2004, A&A, 420, 147
- (12) Blanchet, L. 2006, gr-qc/0609121
- (13) Blumenthal, G. R., Faber, S. M., Flores, R., & Primack, J. R. 1986, ApJ, 301, 27
- (14) Bode, P., Ostriker, J. P., & Turok, N. 2001, ApJ, 556, 93
- (15) Borriello, A., & Salucci, P. 2001, MNRAS, 323, 285
- (16) Bosma, A. 1981, AJ, 86, 1825
- (17) Bottema, R. 1993, A&A, 275, 16
- (18) Bottema, R. 1997, A&A, 328, 517
- (19) Brada, R., & Milgrom, M. 1999, ApJ, 512, L17
- (20) Bullock, J. S., Kolatt, T. S., Sigad, Y., Somerville, R. S., Kravtsov, A. V., Klypin, A. A., Primack, J. R., & Dekel, A. 2001, MNRAS, 321, 559
- (21) Choi, J.-H., Lu, Y., Mo, H. J., Weinberg, M. D. 2006, MNRAS, 1138
- (22) Cole, S. & Lacey, C. 1996, MNRAS, 281, 716
- (23) Colín, P., Klypin, A., Valenzuela, O., & Gottlöber, S. 2004, ApJ, 612, 50
- (24) Côté, S., Carignan, C., & Freeman, K. C. 2000, AJ, 120, 3027
- (25) Courteau, S. & Rix, H.-W. 1999, ApJ, 513, 561
- (26) Daigle, O., Carignan, C., Amram, P., Hernandez, O., Chemin, L., Balkowski, C., Kennicutt, R. 2006, MNRAS, 367, 469
- (27) de Blok, W. J. G. 2004, IAU Symposium, 220, 69
- (28) de Blok, W. J. G. 2005, ApJ, 634, 227
- (29) de Blok, W. J. G., & Bosma, A. 2002, A&A, 385, 816
- (30) de Blok, W.J.G., Bosma, A., & McGaugh, S.S. 2003, MNRAS, 340, 657
- (31) de Blok, W.J.G., & McGaugh, S.S. 1996, ApJ, 469, L89
- (32) de Blok, W.J.G., & McGaugh, S.S. 1997, MNRAS, 290, 533
- (33) de Blok, W.J.G., & McGaugh, S.S. 1998, ApJ, 508, 132
- (34) de Blok, W.J.G., McGaugh, S.S., van der Hulst, J.M. 1996, MNRAS, 283, 18
- (35) de Blok, W.J.G., McGaugh, S.S., Bosma, A., & Rubin, V.C. 2001a, ApJ, 552, L23
- (36) de Blok, W.J.G., McGaugh, S.S., & Rubin, V.C. 2001b, AJ, 122, 2396
- (37) Debattista, V. P., & Sellwood, J. A. 2000, ApJ, 543, 704
- (38) Diego, J. M., Sliwa, W., Silk, J., & Barcons, X. 2003, MNRAS, 344, 951
- (39) Diemand, J., Zemp, M., Moore, B., Stadel, J., & Carollo, M. 2005, MNRAS, 364, 665
- (40) Donato, F., Gentile, G., & Salucci, P. 2004, MNRAS, 353, L17
- (41) Dubinski, J. 1994, ApJ, 431, 617
- (42) Dutton, A. A., van den Bosch, F. C., Dekel, A., & Courteau, S. 2006 (astro-ph/0604553)
- (43) Eke, V. R., Navarro, J. F., & Steinmetz, M. 2001, ApJ, 554, 114
- (44) El-Zant, A., Shlosman, I., & Hoffman, Y. 2001, ApJ, 560, 636
- (45) Flores, R. A., & Primack, J. R. 1994, ApJ, 427, L1
- (46) Flynn, C., Holmberg, J., Portinari, L., Fuchs, B., & Jahreiß, H. 2006, MNRAS, 372, 1149
- (47) Fraternali, F., van Moorsel, G., Sancisi, R., & Oosterloo, T. 2002, AJ, 123, 3124
- (48) Gentile, G., Burkert, A., Salucci, P., Klein, U., & Walter, F. 2005, ApJ, 634, L145
- (49) Gentile, G., Salucci, P., Klein, U., Vergani, D., & Kalberla, P. 2004, MNRAS, 351, 903
- (50) Gnedin, O. Y., Kravtsov, A. V., Klypin, A. A., & Nagai, D. 2004, ApJ, 616, 16
- (51) Gnedin, O. Y., & Zhao, H. 2002, MNRAS, 333, 299
- (52) Goerdt, T., Moore, B., Read, J. I., Stadel, J., & Zemp, M. 2006, MNRAS, 368, 1073
- (53) Helfer, T. T., Thornley, M. D., Regan, M. W., Wong, T., Sheth, K., Vogel, S. N., Blitz, L., & Bock, D. C.-J. 2003, ApJS, 145, 259
- (54) Hu, W., Barkana, R., & Gruzinov, A. 2000, Phys. Rev. Lett., 85, 1158
- (55) Huss, A., Jain, B., & Steinmetz, M. 1999, ApJ, 517, 64
- (56) Hayashi, E., & Navarro, J. F. 2006, astro-ph/0608376
- (57) Hayashi, E., et al. 2004, MNRAS, 355, 794
- (58) Jimenez, R., Verde, L., & Oh, S. P. 2003, MNRAS, 339, 243
- (59) Jing. Y., 2000, ApJ, 535, 30
- (60) Jing, Y.P., & Suto, Y. 2000, ApJ, 529, L69
- (61) Karachentsev, I. D. 2005, AJ, 129, 178
- (62) Kassin, S. A., de Jong, R. S., & Weiner, B. J. 2006, ApJ, 643, 804
- (63) Kent, S.M. 1987, AJ, 94, 306
- (64) Klypin, A., Kravtsov, A. V., Bullock, J. S., & Primack, J. R. 2001, ApJ, 554, 903
- (65) Klypin, A., Zhao, H., & Somerville, R. S. 2002, ApJ, 573, 597
- (66) Kranz, T., Slyz, A., & Rix, H.-W. 2003, ApJ, 586, 143
- (67) Kregel, M., van der Kruit, P. C., & Freeman, K. C. 2005, MNRAS, 358, 503
- (68) Kroupa, P. 2002, Science, 295, 82
- (69) Kull, A. 1999, ApJ, 516, L5
- (70) Kuzio de Naray, R., McGaugh, S.S., de Blok, W.J.G. & Bosma, A. 2006, ApJS, 165, 461
- (71) Lee, T.H., & Lee, B.J. 2004 Phys. Rev. D, 69, 127502
- (72) Ma, C.-P., & Boylan-Kolchin, M. 2004, Phys. Rev. Lett., 93, 021301
- (73) Mac Low, M.-M., & Ferrara, A. 1999, ApJ, 513, 142
- (74) Mandelbaum, R., Seljak, U., Kauffmann, G., Hirata, C. M., & Brinkmann, J. 2006, MNRAS, 368, 715
- (75) Marchesini, D., D’Onghia, E., Chincarini, G., Firmani, C., Conconi, P., Molinari, E., & Zacchei, A. 2002, ApJ, 575, 801
- (76) Mashchenko, S., Couchman, H.M.P., & Wadsley, J. 2006, Nature, 442, 539
- (77) McGaugh, S.S. 2004, ApJ, 609, 652
- (78) McGaugh, S.S. 2005, ApJ, 632, 859
- (79) McGaugh, S.S., Barker, M.K., & de Blok, W.J.G., 2003, ApJ, 584, 566
- (80) McGaugh, S.S., & de Blok, W.J.G. 1998, ApJ, 499, 41
- (81) McGaugh, S.S., Rubin, V.C., & de Blok, W.J.G. 2001, AJ, 122, 2381
- (82) McGaugh, S. S., Schombert, J. M., Bothun, G. D., & de Blok, W. J. G. 2000, ApJ, 533, L99
- (83) Merritt, D., Milosavljevic, M., Favata, M., Hughes, S.A., & Holz, D.E. 2004, ApJ, 607, L9
- (84) Milgrom, M. 1983, ApJ, 270, 371
- (85) Mo, H. J., & Mao, S. 2004, MNRAS, 353, 829
- (86) Moore, B. 1994, Nature, 370, 629
- (87) Moore, B., Ghigna, S., Governato, F., Lake, G., Quinn, T., Stadel, J., & Tozzi, P. 1999a, ApJ, 524, L19
- (88) Moore, B., Governato, F., Quinn, T., Stadel, J., & Lake, G. 1998, ApJ, 499, L5
- (89) Moore, B., Quinn, T., Governato, F., Stadel, J., & Lake, G. 1999b, MNRAS, 310, 1147
- (90) Navarro, J. F., et al. 2004, MNRAS, 349, 1039
- (91) Navarro, J. F., Frenk, C. S., & White, S. D. M. 1997, ApJ, 490, 493 (NFW)
- (92) Navarro, J. F. & Steinmetz, M. 2000, ApJ, 528, 607
- (93) Noordermeer, E., van der Hulst, J. M., Sancisi, R., Swaters, R. A., & van Albada, T. S. 2005, A&A, 442, 137
- (94) Nusser, A., & Sheth, R. 1998, MNRAS, 303, 685
- (95) Okamoto, T., Eke, V. R., Frenk, C. S., & Jenkins, A. 2005, MNRAS, 363, 1299
- (96) Palunas, P. & Williams, T. B. 2000, AJ, 120, 2884
- (97) Persic, M., & Salucci, P. 1988, MNRAS, 234, 131
- (98) Piazza, F., & Marinoni, C. 2003, Phys. Rev. Lett., 91, 141301
- (99) Pierce, M., et al. 2006, MNRAS, 366, 1253
- (100) Portinari, L., & Sommer-Larsen, J. 2006 (astro-ph/0606531)
- (101) Portinari, L., Sommer-Larsen, J., & Tantalo, R. 2004, MNRAS, 347, 691
- (102) Power, C., Navarro, J. F., Jenkins, A., Frenk, C. S., White, S. D. M., Springel, V., Stadel, J., & Quinn, T. 2003, MNRAS, 338, 14
- (103) Ricotti, M. 2003, MNRAS, 344, 1237
- (104) Romanowsky, A. J., Douglas, N. G., Arnaboldi, M., Kuijken, K., Merrifield, M. R., Napolitano, N. R., Capaccioli, M., & Freeman, K. C. 2003, Science, 301, 1696
- (105) Rosati, P., Borgani, S., & Norman, C. 2002, ARA&A, 40, 539
- (106) Rubin, V. C., Thonnard, N., & Ford, W. K., Jr. 1980, ApJ, 238, 471
- (107) Sakamoto, T., Chiba, M., & Beers, T. C. 2003, A&A, 397, 899
- (108) Salucci, P. 2001, MNRAS, 320, L1
- (109) Salucci, P., & Burkert, A. 2000, ApJ, 537, L9
- (110) Salucci, P., Walter, F., & Borriello, A. 2003, A&A, 409, 53
- (111) Salvador-Śole, E., Solanes, J.-M., & Manrique, A. 1998, ApJ, 499, 542
- (112) Sanchez-Salcedo, F.J., Reyes-Iturbide, J, & Hernandez, X. 2006 MNRAS, 370, 1829
- (113) Sanders, R.H., & McGaugh, S.S. 2002, ARA&A, 40, 263
- (114) Schoenmakers, R. H. M., Franx, M., & de Zeeuw, P. T., 1997, MNRAS, 292, 349
- (115) Sellwood, J. A. 1999, in Galaxy Dynamics, ASP 182, 351
- (116) Sellwood, J. A. 2006, astro-ph/0610468
- (117) Sellwood, J. A., & Kosowsky, A. 2001, ASP Conf. Ser. 240: Gas and Galaxy Evolution, 240, 311
- (118) Sellwood, J.A., & McGaugh, S.S. 2005, ApJ, 634, 70
- (119) Simon, J. D., Bolatto, A. D., Leroy, A., & Blitz, L. 2003, ApJ, 596, 957
- (120) Simon, J. D., Bolatto, A. D., Leroy, A., Blitz, L., & Gates, E. L. 2005, ApJ, 621, 757
- (121) Smith, D. R., Bernstein, G. M., Fischer, P., & Jarvis, M. 2001, ApJ, 551, 643
- (122) Sommer-Larsen, J., & Dolgov, A. 2001, ApJ, 551, 608
- (123) Spekkens, K., Giovanelli, R., & Haynes, M. P. 2005, AJ, 129, 2119
- (124) Spekkens, K., & Giovanelli, R. 2006, AJ, 132, 1426
- (125) Spergel, D. N., et al. 2006 (astro-ph/0603449)
- (126) Spergel, D. N., & Steinhardt, P. J. 2000, Phys. Rev. Lett., 84, 3760
- (127) Strigari, L. E., Kaplinghat, M., & Bullock, J. S. 2006 (astro-ph/0606281)
- (128) Swaters, R.A., Madore, B.F., & Trewhella, M. 2000, ApJ, 2000, ApJ, 531, L107
- (129) Swaters, R. A., Madore, B. F., van den Bosch, F. C., & Balcells, M. 2003a, ApJ, 583, 732
- (130) Swaters, R. A., Verheijen, M. A. W., Bershady, M. A., & Andersen, D. R. 2003b, ApJ, 587, L19
- (131) Syer, D. & White, S.D.M. 1998, MNRAS, 293, 337
- (132) Thacker, R. J., & Couchman, H. M. P. 2000, ApJ, 545, 728
- (133) Tissera, P. & Dominguez-Tenreiro, R. 1998, MNRAS, 297, 177
- (134) Tonini, C., Lapi, A., & Salucci, P. 2006, ApJ, 649, 591
- (135) Tormen, G., Bouchet, F.R., & White, S.D.M. 1997, MNRAS, 286, 865
- (136) van Albada, T. S. & Sancisi, R. 1986, Royal Society of London Philosophical Transactions Series A, 320, 447
- (137) van den Bosch, F. C. 2000, ApJ, 530, 177
- (138) van den Bosch, F. C., Mo, H. J., & Yang, X. 2003, MNRAS, 345, 923
- (139) van den Bosch, F.C., Robertson, B.E., Dalcanton, J.J., & de Blok, W.J.G. 2000, AJ, 119, 1579
- (140) van der Hulst, J. M., Terlouw, J. P., Begeman, K. G., Zwitser, W., & Roelfsema, P. R. 1992, ASP Conf. Ser. 25: Astronomical Data Analysis Software and Systems I, 25, 131
- (141) Verheijen, M. A. W. 2001, ApJ, 563, 694
- (142) Verheijen, M. A. W. & Sancisi, R. 2001, A&A, 370, 765
- (143) Vikhlinin, A., Kravtsov, A., Forman, W., Jones, C., Markevitch, M., Murray, S. S., & Van Speybroeck, L. 2006, ApJ, 640, 691
- (144) Weinberg, M.D., & Katz, N. 2002, ApJ, 580, 627
- (145) Weiner, B. J., Sellwood, J. A., & Williams, T. B. 2001, ApJ, 546, 931
- (146) Wilkinson, M. I., & Evans, N. W. 1999, MNRAS, 310, 645
- (147) Young, J. S., & Knezek, P. M. 1989, ApJ, 347, L55
- (148) Zavala, J., Avila-Reese, V., Hernández-Toledo, H., & Firmani, C. 2003, A&A, 412, 633
- (149) Zackrisson, E., Bergvall, N., Marquart, T., Östlin, G. 2006, A&A, 452, 857
- (150) Zentner, A. R., & Bullock, J. S. 2002, Phys. Rev. D, 66, 043003