Strongly Variable Fe II and Mg II Absorption in the Spectra of GRB 06020611affiliation: Based on data from the F. L. Whipple Observatory, which is operated by the Smithsonian Astrophysical Observatory.
Abstract
We report on the discovery of strongly variable Fe II and Mg II absorption lines seen at in the spectra of the gamma-ray burst (GRB) 060206 obtained between 4.13 to 7.63 hours (observer frame) after the burst. In particular, the Fe II line equivalent width (EW) decayed rapidly from Å to Å, only to increase to Å in a later spectrum. The Mg II doublet shows even more complicated evolution: the weaker line of the doublet drops from Å to Å, but then more than doubles to Å in later data. The ratio of the EWs for the Mg II doublet is also variable, being closer to (saturated regime) when the lines are stronger and becoming closer to (unsaturated regime) when the lines are weaker, consistent with expectations based on atomic physics. We have investigated and rejected the possibility of any instrumental or atmospheric effects causing the observed strong variations. Our discovery of clearly variable intervening Fe II and Mg II lines immediately indicates that the characteristic size of intervening patches of Mg II “clouds” is comparable to the GRB beam size, i.e., about cm. We discuss various implications of this discovery, including the nature of the Mg II absorbers, the physics of GRBs, and measurements of chemical abundances from GRB and quasar absorption lines.
1 Introduction
The optical spectrum of a gamma-ray burst (GRB) afterglow is generally a power-law with absorption lines superimposed. These absorption lines correspond to intervening material between the source and the observer. Typically, the highest-redshift lines are thought to be associated with the host galaxy (e.g., see discussion in Jha et al., 2001), and thus provide a measurement of the redshift of the burst. There might be several lower-redshift absorption lines caused by intervening systems. Spectra of luminous GRB afterglows have opened a new window on absorption-line studies along lines of sight that are not associated with quasars (cf. Vreeswijk et al., 2003).
Recent studies of GRB absorption spectra have produced an unexpected result. Prochter et al. (2006) reported statistically significant evidence for a much higher incidence of strong Mg II absorbers along GRB sight lines than that expected from studies of quasars of comparable redshift. They considered and rejected three possible scenarios to produce such an effect, namely dust associated with the Mg II absorbers, ejection of Mg II by the GRB, and strong gravitational lensing by galaxies associated with the emission.
Frank et al. (2006) proposed a simple geometric solution to the quandary, with resulting predictions that are readily testable. Namely, if the Mg II absorbers seen in both GRB and quasar spectra are truly intervening, then the Prochter et al. result could be caused by different sizes of the GRB and quasar emission regions. If the Mg II absorbers have physical sizes comparable to the emitting regions of quasars and GRBs, then a background source with a larger emission region would “see” a smaller effective absorption column density than a background source with a smaller emission region (see Frank et al. for details of their proposed scenario).
One immediate prediction of the Frank et al. scenario is that for strongly dynamic objects like GRB afterglows, the strength and structure of intervening absorption lines in GRB spectra should vary in some, if not all, cases. Motivated by this prediction, we have examined our existing, multi-epoch spectroscopic data of GRB 060206 and have discovered such a behavior. In this paper, we provide the first observational evidence of this prediction. In fact, as far as we know this is the first report ever of clearly evolving intervening (i.e., non-intrinsic) ground state absorption lines seen in spectra of any cosmological object. There is evidence for variation in fine structure lines in the GRB host environment (cf. Vreeswijk et al., 2006; Dessauges-Zavadsky et al, 2006).
GRB 060206 triggered Swift-BAT on 2006 Feb 6 at 04:46:53 UT (Morris et al., 2006). A likely afterglow was identified by Fynbo et al. (2006), who also determined that the afterglow was at high redshift (). The evolution of a bright and complex afterglow was reported by several groups, and Wozniak et al. (2006), Stanek et al. (2006), and Monfardini et al. (2006) have published detailed photometric data for this “anomalous” event. The burst also showed complex behavior in the X-rays as seen with Swift-XRT instrument, but the overall X-ray evolution follows that seen in the optical (Stanek et al., 2006).
2 Spectroscopic Observations
The brightness of the optical transient (OT) associated with GRB 060206 allowed us to take spectra for several hours after the burst. Spectra of the OT were obtained with the FAST spectrograph (Fabricant et al., 1998) at the Cassegrain focus of the 1.5m Tillinghast telescope at the F. L. Whipple Observatory at 08:25, 09:02, 09:33, 10:05, 10:41, 11:37, 12:09 (all times UT). The OT was visible on the telescope acquisition camera and could be identified and placed on the spectrograph slit for the observations. Each spectrum was taken at or near the parallactic angle (Filippenko, 1982). The spectra were reduced in the standard manner with IRAF111IRAF is distributed by the National Optical Astronomy Observatory, which is operated by the Association of Universities for Research in Astronomy, Inc., under cooperative agreement with the National Science Foundation. using the optimal extraction package of Horne (1986). Night-sky emission lines were removed by fitting a line to two sky regions on either side of the OT column-by-column; the value determined from the linear function at the position of the OT extraction was then subtracted. Wavelength calibration was provided with an HeNeAr lamp taken immediately after each OT spectrum. Minor adjustments to the wavelength solution were made based upon night-sky lines in the OT frames. There were clouds during some of the exposure, but the signal-to-noise ratio (S/N) is comparable for all the spectra. The resolution of each spectrum is Å as measured from the FWHM of night-sky emission lines.
We flux-calibrated the spectra with spectrophotometric standard stars using our own software. Relative fluxes in our OT spectrum are accurate to over the observed wavelength range. Following the arguments of Wade & Horne (1988) and Matheson et al. (2000), telluric correction was accomplished by dividing the GRB spectra with a normalized spectrum of the flux standard, which was set to unity for regions unaffected by atmospheric features. For our spectra, telluric correction was only applied over the regions 6250-6360 Å and 6840-7410 Å. We scaled the strength of the absorption by the difference of the airmasses to the power to correct the saturated B band properly (Wade & Horne, 1988). Most of the correction is or less, with a correction in the 6250-6360 Å region and in the strong region of the B band.
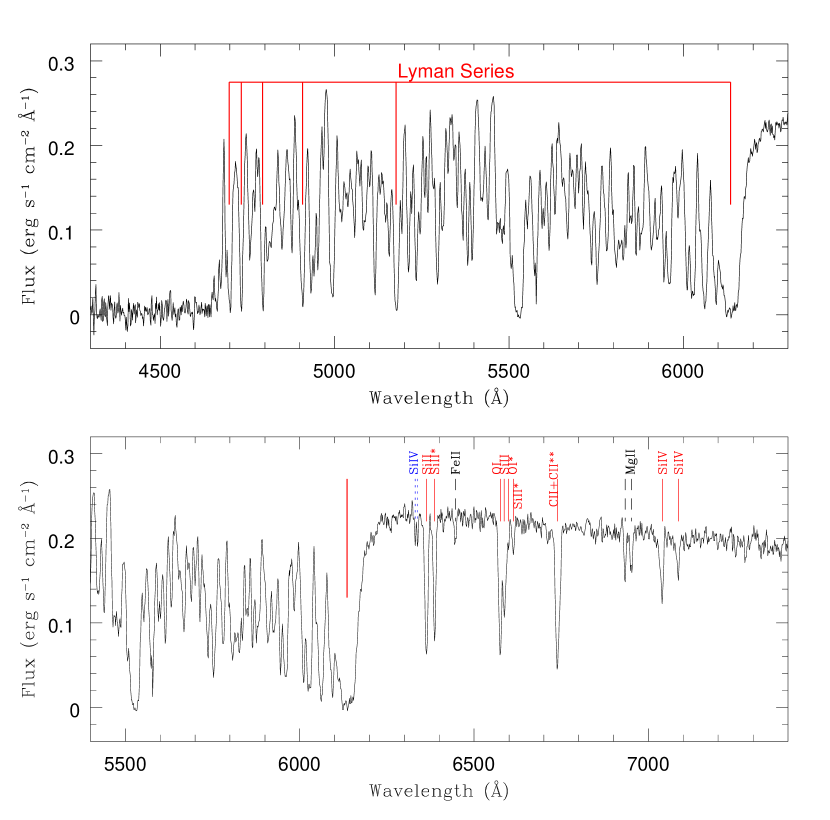
In the S/N weighted average spectrum, shown in Figure 1, a damped Lyman-alpha absorption system (DLA) is present at Å. A number of strong and weak absorption metal line systems are superimposed on the continuum, identified as systems at and (reported by Fynbo et al., 2006). The very strong DLA system at Å indicates that the other absorbers at most likely represent the host galaxy of the GRB. In the intervening metal line system at , our data show absorption from the transitions Fe II 2600 and Mg II 2796, 2803. These are fairly typical in absorption line systems (e.g., Steidel & Sargent, 1992). Two absorption lines at Å and Å represent a Si IV system at , with a strong corresponding Ly absorption line at Å.
3 Spectroscopic Monitoring
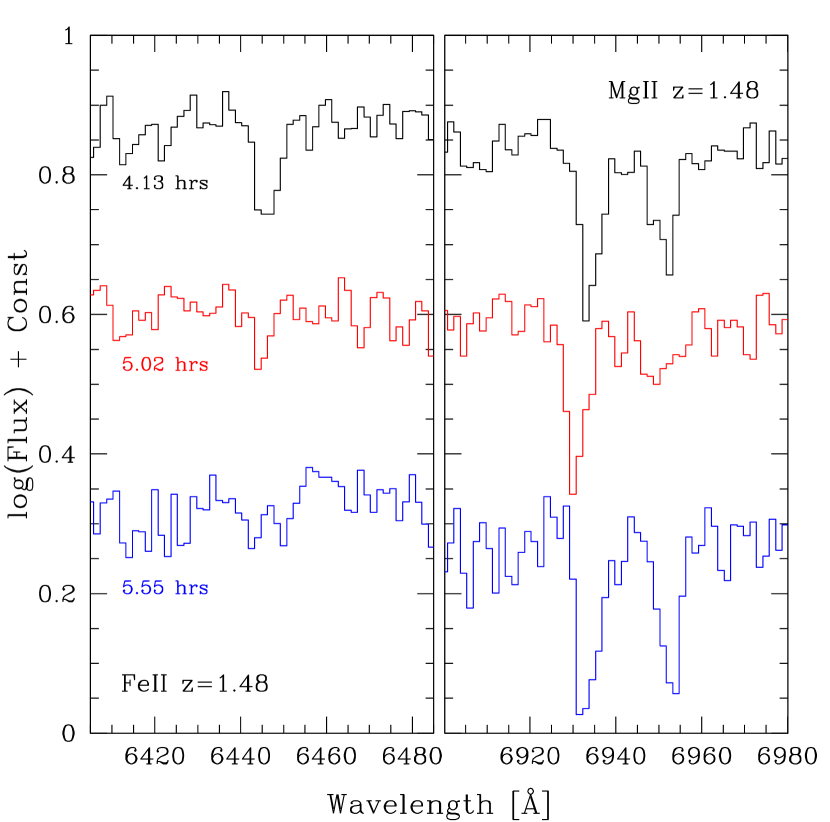
Motivated by the prediction of Frank et al. (2006) that the absorption lines along GRB sight lines should vary in some cases, we examined our time series of GRB 060206 spectra to look for this effect. Variation of the intervening Fe II and Mg II lines is obvious even upon casual inspection of the spectra, as shown in Figure 2. These lines are seen to vary in strength, profile, and possibly velocity. We have checked the original 2-D spectra and no cosmic ray features are apparent that would cause this variation. In addition, night-sky emission lines and telluric features were carefully removed with several variations in technique to ensure that reduction processes did not introduce the observed variability. In fact, there are no sky lines or telluric features at all near the strongly variable Fe II.
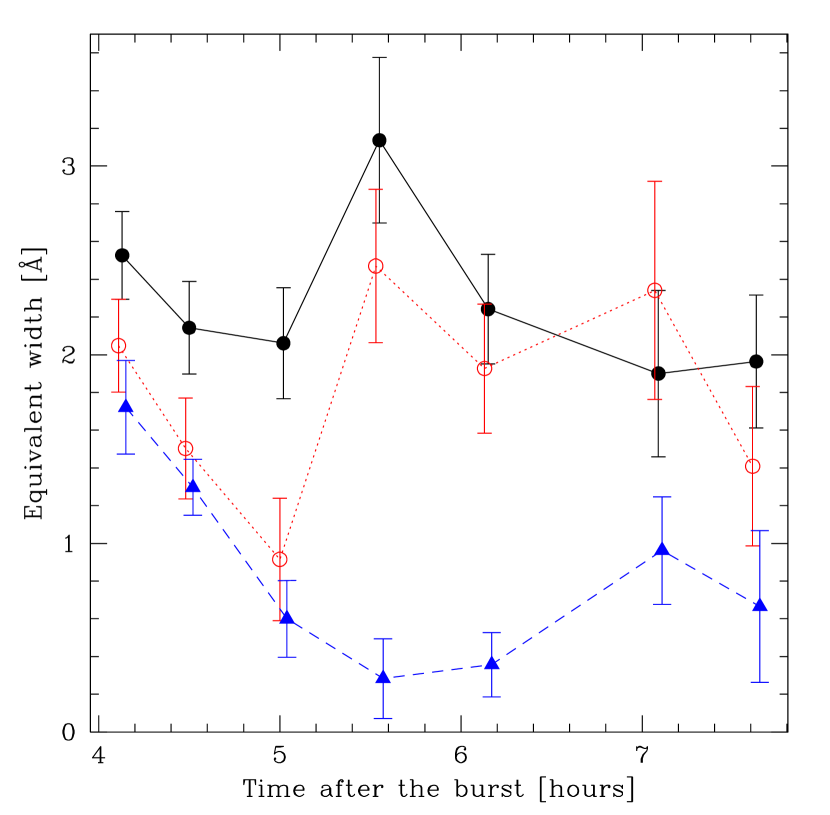
To measure the magnitude of variations in the equivalent widths (EWs) of the absorption lines, we fit each of the Mg II lines with multiple Gaussians and the Fe II line with a single Gaussian. The error of the EWs are calculated from the conservative fit uncertainties. The resulting EW measurements are listed in Table 1 and plotted in Figure 3. The first three spectra show a gradual decrease in the EW of the Mg II line accompanied by a sharp decline in the EW of the weaker Mg II line. As a result, the ratio of the doublet increases from in the first spectrum to about in the third. This is followed in the fourth spectrum by a sharp rise in the EW of both components of the doublet and a sharp decrease in the doublet ratio to . While the EW of the Fe II line also decreases throughout the first three spectra, it seems to completely disappear in the fourth spectrum. The two small features in this spectrum at the location of the Fe II feature are consistent with noise (see Figure 2). The Fe II absorption line gradually returns throughout the last three spectra, but it never regains its original strength. The only other spectral feature to show possible variability is the Si IV absorption line at the presumed redshift of the host galaxy. The variability in this line does not follow the behavior of either the Mg II or Fe II systems at . We are still investigating the nature and significance of variability in this line.
Variation in the EW of an absorption line is a direct consequence of variation in the column density of the absorber as seen by the background source. The Fe II and Mg II systems are not necessarily expected to be distributed homogeneously throughout an absorbing “cloud.” As the beam size of the GRB increases due to its physical expansion, the beam could include various dense or dilute regions of the “cloud,” leading to different behaviors in the measured EWs of the absorbers. Additionally, the Fe II and Mg II may not be co-spatial, so their behaviors may not be directly comparable as seen here.
To estimate the statistical significance of these observed variations, we apply statistics to the “null hypothesis” that the Fe II and Mg II lines are not variable. Fitting the multiple measurements of the Fe II EW with a constant value gives with six degrees of freedom. Such a value of results in a probability of ( Gaussian significance) that the Fe II line is not varying. A similar analysis for the Mg II line results in , which gives ( Gaussian significance) for lack of variation in the line EW. Finally, for the Mg II line, we find , resulting in for the assumption that the EW does not vary. The combined data clearly show statistically significant evidence for variability. Note that while we only test here the significance of variations in the line EWs, it is also immediately apparent from the spectra that the line profiles are varying as well (see Figure 2). Each of these lines is likely composed of several components that are blended in our spectra, and it is variations in individual components that are causing the observed variations in the total EWs and line profiles.
To further investigate the variability of the lines, we use the spectral subtraction algorithm developed by Hartman & Stanek (2007, in preparation), which uses the entire spectrum in the wavelength range to obtain the convolution kernel for matching individual observed spectra to the reference spectrum. We choose the first observed spectrum as the reference, then calculate the difference between the matched spectra and the observed spectra for the rest of the observed spectra, divided by the variance spectra we can calculate the significance of the difference. The Fe II shows a variation in the line region and the Mg II line shows a variation in the line region .
4 Discussion
Variable intervening Fe II and Mg II was predicted by Frank et al. (2006) as a direct consequence of their geometric solution to the Mg II absorption over-abundance problem discovered by Prochter et al. (2006). Our result immediately provides constraints on the physical size of the Mg II absorbers that are several orders of magnitude stronger than those determined from studies of lensed quasars — pc (Frank et al., 2006) vs. pc (Rauch et al., 2002; cf. Petitjean et al., 2000). Observations of lensed quasars such as those proposed by Dong (2006) may provide additional constraints on the physical sizes of the absorbers. Significant spectral variability on the timescales of months to years induced by microlensing can be used to probe the cm cloudlets along the sightlines of lensed quasars. Properties of the cloudlets (physical size, sub-structure, etc.) can be studied statistically if such spectral variations are seen.
We can also investigate the average physical density of the absorbers. Assuming the “cloud” is optically thin, we can obtain a lower limit on the Mg II column density . To evaluate this result, we have used our third spectrum taken hours after the burst, where the Mg II line ratio is close to , indicating the lines are not strongly saturated (see Table 1). The beam size of the GRB during that epoch can be estimated (Waxman, 1997; Loeb & Perna, 1998) via
| (1) |
where is the source redshift, is the “isotropic-equivalent” of the energy release in units of , and is the ambient gas density in units of . For GRB 060206, (Palmer et al., 2006), and assuming , then cm for our third spectrum. With the physical size of the individual Mg II “clumps” constrained to be comparable to the GRB beam size (i.e., cm), one can immediately derive the average physical density of Mg II atoms to be about . This is the first time that such a strong constraint has been obtained. Given its large Mg II equivalent width, the z=1.48 absorber is likely a Lyman limit system with , although there is a % probability that it is a damped Lyman-alpha system (Rao et al. 2006). Then the physical density of the hydrogen of this cloud is . The estimate of physical density of Mg II absorbers is very important for understanding the cloud origins and properties, and more generally the metal lines and metal enrichment (see discussion in Schaye et al 2007).
Another consequence of this discovery relates to GRBs themselves. In the case of GRB 060206, we see the Mg II EW initially decreasing, but then it shows a dramatic increase. This behavior is either a result of the GRB beam becoming much smaller in a short time (possibly due to an episode of energy injection) or part of the afterglow ring suddenly brightening. Our discovery points the way to a new method for studying GRB phenomena by monitoring afterglows with high-resolution optical spectroscopy.
Additional implications relate to chemical abundances for intervening systems as measured using absorption lines. In our first spectrum, the ratio of EWs for Fe II compared to Mg II is about 0.7. In our fourth spectrum, where the Fe II is only marginally present, and Mg II is very strong, that ratio is less than 0.1. Estimates of relative abundances for these two elements would be dramatically different when analyzing these two low-resolution spectra. If the system is at the lower end of this column density range, some of the difference in Mg II/Fe II ratio could be the result of spatially-varying ionization levels. However, it may be that there are intrinsic variations in the relative metal abundances (although such variations are not seen in damped Lyman-alpha systems: Prochaska 2003, Rodriguez et al 2006).
The observations presented in this paper open up the exciting possibility of studying time-variability of intervening absorption lines in the spectra of cosmological objects. Strongly and rapidly variable objects, such as GRBs and blazars, are obvious targets for further studies, but quasars (including both lensed and non-lensed) should also be investigated. Variable narrow absorption lines have been observed in spectra of quasars (e.g., Hamann et al. 1997), but they have been interpreted as originating in gas physically associated with the quasar. In fact, variability of narrow absorption lines is now used as one of the criteria to select intrinsic absorbers associated with quasars. Results presented in this paper suggest that using this criterion should be re-examined—quasars are optically variable sources, so size of their continuum emission region is bound to vary, just like it does for GRBs. As already discussed by Frank et al. (2006), quasars with smaller continuum emitting regions (i.e., intrinsically fainter ones), should have higher incidence of the strong Mg II absorbers.
Note that throughout this paper we considered the variable absorption system not to be physically associated with the GRB, i.e., to be truly intervening due to cosmological expansion. For these two objects to be physically associated would require Fe II and Mg II absorbing gas to have ejection velocity c, while maintaining relatively low temperature in order not to be completely ionized. We consider such scenario most unlikely. Detection of a galaxy associated with this particular variable absorption system would settle this issue beyond any reasonable doubt. As discussed in Prochter et al. (2006), such foreground galaxies were already identified for a number of strong, intervening Mg II absorbers seen in GRB spectra.
References
- Dessauges-Zavadsky et al (2006) Dessauges-Zavadsky, M., et al. 2006, ApJ, 648, L89
- Dong (2006) Dong, S. 2006, ApJ, submitted (astro-ph/0612403)
- Fabricant et al. (1998) Fabricant, D., et al. 1998, PASP,110,79
- Filippenko (1982) Filippenko, A. V. 1982, PASP, 94, 715
- Frank et al. (2006) Frank, S., et al. 2006, ApJ, submitted (astro-ph/0605676)
- Fynbo et al. (2006) Fynbo, J. P. U., et al. 2006, A&A, 451, L47
- Hamann et al. (1997) Hamann, F., Barlow, T., A., & Junkkarinen, V. 1997, ApJ, 478, 87
- Horne (1986) Horne, K. 1986, PASP, 98, 609
- Jha et al. (2001) Jha, S., et al. 2001, ApJ, 554, L155
- Loeb & Perna (1998) Loeb, A., & Perna, R. 1998, ApJ, 495, 597
- Matheson et al. (2000) Matheson, T., et al. 2000, AJ, 120, 1499
- Monfardini et al. (2006) Monfardini, A., et al. 2006, ApJ, 648, 1125
- Morris et al. (2006) Morris, D. C., et al. 2006, GCN 4682
- Palmer et al. (2006) Palmer, D., et al. 2006, GCN Circ. 4697
- cf. Petitjean et al. (2000) Petitjean, P., et al. 2000, A&A, 359, 457
- Prochaska (2003) Prochaska, J. X. 2003, ApJ, 582, 49
- Prochter et al. (2006) Prochter, G. E., et al. 2006, ApJ, 648, L93
- Rao et al. (2006) Rao, S. M., Turnshek, D. A., & Nestor, D. B. 2006, ApJ, 636, 610
- Rauch et al. (2002) Rauch, M., Sargent, W. L. W., Barlow, T. A., & Simcoe, R.A. 2002, ApJ, 576, 45
- Rodriguez et al. (2006) Rodriguez, E., et al. 2006, A&A, 446, 791
- Schaye et al. (2007) Schaye, J., Carswell, R. F., & Kim, T. S. MNRAS submitted (astro-ph/0701761)
- Stanek et al. (2006) Stanek, K. Z., et al. 2006, ApJ, in press (astro-ph/0602495)
- Steidel & Sargent (1992) Steidel, C. C., & Sargent, W. L. W. 1992, ApJS, 80,1
- Vreeswijk et al. (2003) Vreeswijk, P. M., Møller, P., & Fynbo, J. P. U. 2003, A&A, 409, L5
- Vreeswijk et al. (2006) Vreeswijk, P. M., et al. 2006, A&A, submitted (astro-ph/0611690)
- Wade & Horne (1988) Wade, R. A., & Horne, K. D., 1988, ApJ, 324, 411
- Waxman (1997) Waxman, E. 1997, ApJ, 491, L19
- Wozniak et al. (2006) Wozniak, P. R., et al. 2006, ApJ, 642, L99
| aaHeliocentric Julian Date at middle of exposure minus 2,453,770. | AgebbAge of the middle of exposure in hours from the detection of the burst at 2006 Feb 06 04:46:53 UT (Morris et al., 2006). | EWccObserver-frame equivalent width. | EW | EW |
|---|---|---|---|---|
| 2.86384 | 4.13 | 2.53 0.23 | 2.05 0.25 | 1.72 0.25 |
| 2.88946 | 4.50 | 2.14 0.25 | 1.50 0.27 | 1.30 0.15 |
| 2.91110 | 5.02 | 2.06 0.30 | 0.92 0.33 | 0.60 0.20 |
| 2.93323 | 5.55 | 3.14 0.44 | 2.47 0.41 | 0.28 0.21 |
| 2.95857 | 6.15 | 2.24 0.29 | 1.93 0.34 | 0.36 0.17 |
| 2.99745 | 7.09 | 1.90 0.44 | 2.34 0.58 | 0.96 0.29 |
| 3.01990 | 7.63 | 1.96 0.35 | 1.41 0.42 | 0.67 0.40 |
.