The Spatial Distribution of the Galactic First Stars I: High-Resolution N-body Approach
Abstract
We study the spatial distribution of Galactic metal-free stars by combining an extremely high-resolution ( per particle) Cold Dark Matter N-body simulation of the Milky-Way with a semi-analytic model of metal enrichment. This approach allows us to resolve halos with virial temperatures down to the K atomic cooling limit, and it is sufficiently flexible to make a number of robust conclusions, despite the extremely uncertain properties of the first stars. Galactic metal-free stars are formed over a large redshift range, which peaks at , but continues down to contributing stars at wide range of Galactocentric radii. Stars containing only metals generated by primordial stars are similarly widespread. Neither changing the efficiency of metal dispersal by two orders of magnitude, nor drastically changing the approximations in our semi-analytical model can affect these result. Thus, if they have sufficiently long lifetimes, a significant number of stars formed in initially primordial star clusters should be found in the nearby Galactic halo regardless of the specifics of metal-free star formation. Observations of metal abundances in Galactic halo stars should be taken as directly constraining the properties of primordial stars, and the lack of metal-free halo stars today should be taken as strongly suggesting a lower limit on the primordial initial mass function.
Subject headings:
Galaxy:formation – Galaxy:evolution – stars:abundances – cosmology:theory1. Introduction
Metals are made in stars, but stars need not to have metals. While the early universe was an efficient source of helium, primordial nucleosynthesis was halted before it was able to produce elements heavier than lithium. Thus the first stellar generation of Population III (PopIII) stars condensed from a gas that was free of carbon, silicon, iron, or any of the other heavy elements that are prominent today.
Indeed, to date not a single star has been observed that does not contain metals. Instead stellar nucleosynthetic products are everywhere. The lowest metallicity galaxies known are enriched to (Searle & Sargent 1972); the lowest-density regions of the intergalactic medium (IGM) appear to be enriched out to the highest redshifts probed (Schaye et al. 2003; Pettini et al. 2003; Aracil et al. 2004); and extensive searches for metal-poor halo stars have failed to uncover any PopIII candidates beyond a handful of stars with extremely low abundances of elements heavier than magnesium (Christlieb et al. 2002; Cayrel et al. 2004).
Interpretation of these stellar abundances is especially complicated by the fact that searches for metal-poor stars are targeted at the Galactic halo, where dust extinction is minimal and crowding is not a serious concern. These analyses have provided a number intriguing constraints on the enrichment history of the halo (Freeman & Bland-Hawthorn 2002; Beers & Christlieb 2005), including detailed measurements of the metallicity distribution function from [Fe/H] to [Fe/H] (e.g. Ryan & Norris 1991; Beers et al. 1992; Barklem et al. 2005), a detection of a shift in iron peak ratios below [Fe/H] (McWilliam et al. 1995; Carretta et al. 2002; Cayrel et al. 2004, Cohen et al. 2004), and the presence of extremely heavy element deficient stars in which [C/Fe] (Christlieb et al. 2002; Frebel et al. 2005). While these and other observations have provided the basis for several theoretical analyses of the first stars (e.g. Hernandez & Ferrara 2001; Scannapieco, & Broadhurst 2001; Oey 2002; Schneider et al. 2003; Tumlinson 2006), these are subject to substantial uncertainties due to the unknown spatial distribution of such objects.
In fact, it is still unclear how the observed population of halo stars is related to PopIII star formation. Indeed, White & Springel (2000) used high-resolution cosmological simulations to show that the oldest stars are naturally strongly concentrated towards the center of the Galaxy, but stars that form in the full population of K halos are widely distributed. More recently, Diemand, Madau, & Moore (2005) used a resimulation technique to track the positions of particles contained in the protogalactic halos collapsing from very rare and perturbations (where is the variance of linear fluctuations on the scale of the objects). Associating PopIII stars with perturbations, they found that the density of such objects in the Galactic halo at the radius of the solar orbit is three orders of magnitude lower than in the bulge. Associating PopIII stars with perturbations led to even more extreme results, decreasing the number of first stars at the solar orbital radius by almost another order of magnitude. Similarly, Karlsson (2006) was able to reproduce a “metallicity desert” between [Fe/H] = -5 and -4 by associating metal-free star formation with only the very earliest forming stars.
Yet this association of metal-free stars with the highest density regions is likely to be misleading. As shown in Scannapieco, Schneider, & Ferrara (2003, hereafter SSF03; see also Schneider et al. 2006) cosmological enrichment was a local process, which occurred in different regions over an extended redshift range. Thus while the peak of PopIII star formation is likely to have occurred at , such stars should have continued to form at much lower redshifts. Furthermore, in these models metal free stars do not form in perturbations of a given , but rather within objects, which are just large enough to cool within a Hubble time, but small enough that they are not clustered near areas of previous star formation.
This spread in and formation redshift raises the prospect that the remnants of metal-free protogalactic clouds would have indeed ended up in the halo. This would mean that the absence of observed metal-free objects might require the first stars to form with an initial mass function (IMF) biased to stars with lifetimes shorter than a Hubble time, and perhaps even biased to masses as suggested by a number of recent theoretical studies (e.g. Nakamura & Umemura 1998; Abel, Bryan, & Norman 2000; Bromm et al. 2001; Schneider et al. 2002; Ripamonti et al. 2002; Tan & McKee 2004). Furthermore, it would mean that some of the stars with unusual yields found in the halo of our galaxy are indeed providing us with direct information about the yields of PopIII stars.
In this paper we combine an extremely high-resolution N-body simulation of the formation of the Milky-Way with a semi-analytical model of metal enrichment that closely parallels that discussed in SSF03. While we plan to conduct a careful comparison of this approach with a more direct chemodynamical model of the Milky-Way in a companion publication (Brook et al. in prep.), the dark-matter based model described here nevertheless has a number of distinct advantages. Although gas cooling is essential to reproduce the spatial distribution of late-forming metal-rich Galactic disk stars, the spatial distribution of low-metallicity stars in the bulge and halo can be approximated from an N-body point of view. Such stars were formed at early times in star clusters contained in much smaller dark matter halos, and they subsequently evolved as collisionless particles. Thus by carefully tagging N-body particles directly in progenitor halos as star-particles, we can use them to infer the positions of the earliest stellar populations. This approach allows us to work at a mass resolution per dark-matter particle) that is currently impossible in gas simulations of the Milky-Way, which means that we can capture the formation of all halos within which efficient star-formation is expected to occur.
Our semi-analytic model of metal enrichment, on the other hand, gives us the flexibility to use this simulation to study a wide range of models for the properties of the first stars. As the typical mass of such stars remains uncertain within at least two orders of magnitude, the metal and kinetic energy output from SNe arising from PopIII stars remains completely unknown. This uncertainty is further compounded by the possibility that metal-free stars in the mass range may have given rise to tremendously powerful pair-production supernovae (e.g. Heger & Woosley 2002), with kinetic energies up to ergs per event. While exploring this full range of possibilities by direct simulations is extremely computationally expensive, our technique allows us to carry out this parameter study in a few minutes, leading to a number of robust conclusions despite the large uncertainties involved.
The structure of this work is as follows. In §2 we describe our simulations and semi-analytical model. In §3 we apply our model to consider the distribution of the first and second stars in a wide range of cosmological scenarios. Conclusions are given in §4.
2. Method
To identify the location of PopIII stars in our galaxy, we combine a high-resolution N-body simulation of the formation of a Milky-Way size galaxy with a semi-analytical model of metal enrichment. In §2.1 we describe our simulation in detail, as well as the method we use to extract gravitationally bound halos. In section §2.2, we describe our semi-analytical model and discuss how it is used to construct the expected positions for stars forming from gas that is initially primordial, which we label as “the first stars,” and stars forming from gas that is initially enriched by only primordial stars, which we label as “the second stars.”
2.1. Simulation and Identification of Halos
Throughout our study we assume a Cold Dark Matter model with parameters , = 0.135, , , , and , where is the Hubble constant in units of 100 km/s/Mpc, , , and are the total matter, vacuum, and baryonic densities in units of the critical density, is the variance of linear fluctuations on the scale, and is the “tilt” of the primordial power spectrum (e.g. Spergel et al. 2003). Our N-body simulation is carried out with the GCD+ code (Kawata & Gibson 2003a), and it uses a multi-resolution technique (Kawata & Gibson 2003b) to achieve high-resolution in the regions of interest, while the outer regions exerting tidal forces are handled with lower resolution.
The initial conditions for these simulations at are constructed using the public software GRAFIC2 (Bertschinger 2001). The low-resolution region is a Mpc diameter sphere selected from a low-resolution cosmological simulation, for which an isolated boundary condition is applied. The highest resolution region is a sphere with a radius four times the virial radius of the system at at . In this region, the Dark Matter (DM) particle mass and softening length of are and pc, respectively. The system consists about particles within the virial radius. The virial mass and radius of the system at are and kpc, which are roughly consistent with the estimated mass ( ) and virial radius ( kpc) of the Milky Way (Klypin, Zhao, & Somerville 2002; Battaglia et al. 2005, see also Dehnen, McLaughlin, & Sachania 2006 for a slightly more massive, , and compact, kpc, model.) The initial conditions are essentially the same as the KGCD model in Bailin et al. (2005), but the current simulation has a much higher resolution and slightly different cosmological parameters.
Using a low-resolution simulation including gas physics and star formation, we confirm that this initial condition will lead to a disk galaxy. A closer comparison between our results here and a lower-resolution gas-dynamical model will be presented in a future publication (Brook et al. in prep.). While gas physics is essential to reproduce the spatial distribution of disk stars, an N-body approach is appropriate for the halo and bulge populations on which we are focused here. Such stars should initially form in much smaller gas disks condensing in neighboring halos, and later interact as collisionless particles. Thus by carefully tagging N-body particles directly in progenitor halos as star-particles, we can use them to infer the positions of the first and second stars in our final galaxy.
The simulation data is output every Gyr, and at each output, we use a friend-of-friends group finder (FOF, Davis et al. 1985) to identify the virialized DM halos. We apply a standard approach with a linking parameter of and threshold number of particles of 50, and we explore the results of varying this parameter below. We then construct a merger tree, associating the halos at different time steps. In particular, we search for the halo at each time step that contains the largest number of the member particles of a given halo at the previous time step, We define the virial mass and radius for each halo, taking into account the cosmology and redshift, following the fitting formula in the Appendix of Kitayama & Suto (1996).
A key issue is the minimum mass of the halos in which stars formed. Before reionization, this depends sensitively on the presence of (e.g. O’Shea et al. 2005). In small objects, molecular hydrogen is easily photodissociated by 11.2-13.6 eV photons, to which the universe is otherwise transparent. Thus emission from the very first stars quickly destroyed all avenues for cooling (Dekel & Rees 1987; Haiman, Rees, & Loeb 1997; Ciardi, Ferrara, & Abel 2000). This raised the minimum virial temperature necessary to cool effectively to approximately K, although the precise value of this transition is the subject of debate (e.g. Glover & Brand 2001; Yoshida et al. 2003) and is somewhat dependent on the level of the high-redshift X-ray background (Haiman, Rees, & Loeb 1996; Oh 2001; Machacek, Bryan, & Abel 2003).
A natural question is whether the few stars that dissociated primordial molecular hydrogen may have been also enriched a significant fraction of the intergalactic medium. To estimate this fraction we consider two cases, one in which the primordial stars that contributed most to the dissociating background were , and a second case in which the primordial IMF was peaked to form very massive stars . In the case the rate of dissociating photons is s-1 (Glover & Brand 2001; see also Schaerer 2002; Venkatesan, Tumlinson, & Shull 2003) and the stars live Myrs (Fagotto et al. 1994) to generate a total of dissociating photons per star. In the 200 case the dissociating rate is s-1, but the lifetime is only Myrs, resulting in a total of such photons per star. Combining these values with the mean cosmological fraction of (e.g. Yoshida et al. 2003), we can estimate the typical radius of a region dissociated by a primordial star as comoving kpc in the 10 case and comoving kpc in the 200 case, where is the mean overdensity of the dissociated region.
On the other hand, adopting a simple Sedov-Taylor estimate of the maximum distance that a given supernova will be able to distribute metals as a function of time gives comoving kpc where is the expansion time in Gyrs and is the energy input in units of ergs. If we assume no kinetic energy losses, replace with the Hubble time, and take a typical redshift of 15, this gives comoving kpc.
Since the formation of these very first stars is self-truncated by dissociation, they should cease to form and distribute metals when the filling factor of their dissociation regions reaches unity. This means that the relative ratio of the dissociation/metal enrichment volume should be an accurate predictor of the total filling factor of such very early metals. In the 10 case this ratio is while in the case where we have taken a typical SN energy of ergs (Heger & Woosley 2002). Thus less than 1% of the universe is likely to have been enriched by this earliest generation of stars, and this only in the very densest regions. Rather the majority of primordial enrichment is should have occurred in larger objects with K.
In this case, (sometimes referred to Population II.5; e.g. Grief & Bromm 2006) efficient atomic-line cooling establishes a dense locally-stable disk, within which non-equilibrium free electrons catalyze . Unlike in less massive halos, formation in these objects is largely impervious to feedback from external UV fields, due to the high densities achieved by atomic cooling (Oh & Haiman 2002). As discussed in SSF03, regions of late primordial star formation may have already been detected as a subgroup of high-redshift Lyman-alpha emitters, although distinguishing them from Population II/I stars is extremely difficult (Dawson et al. 2004).
In this study then, we adopt a fixed threshold of K for star formation in halos at all redshifts. In our cosmology, and for the high redshifts relevant for the formation of primordial objects, this corresponds to a minimum mass of
| (1) |
While at high-redshift this mass can be over four orders of magnitude smaller than the final virial mass of the Galaxy, our high-resolution simulation nevertheless makes it possible to trace these objects. This means that at redshifts below 17, all the halos relevant to our study will contain at least 50 particles and be well-identified by our FOF group finder. However, at the very earliest redshifts such halos will only be marginally resolved.
2.2. Identification of First and Second Objects
Having constructed the history of dark matter halos as a function of redshift, our next step is to use this to identify two types of objects: i) halos that collapse out of primordial gas, which we identify as Population III objects containing “the first stars,” and ii) halos that collapse from gas that has been enriched purely by material ejected from the Population III objects, which we identify as second-generation objects containing “the second stars.” While we vary the IMF of the first stars over a wide range of possibilities, we assume that the second stars form with an IMF similar to that seen today, although they are likely to display peculiar enrichment patterns.
It is important to make clear that our model is not able to say anything about the progression of star formation and self-enrichment within a particular halo (see e.g. Susa & Umemura 2006). Rather, our labels purely reflect the properties of the most metal-poor stars formed in any given region. Thus it is entirely possible that some fraction of the stars forming in halos that collapse from primordial gas will nevertheless contain metals that were inherited from other stars forming in the same temporally-extended burst. For our purposes here then, stars formed in such self-enriched primordial star clusters are included in the distribution of “the first stars.” Similarly we exclude all halos that are direct descendents of first objects from our list of second generation objects, as these would exist cospatially with stars that were truly primordial.
These definitions are intended to extract the most information possible from our modeling approach. For observers, anywhere labeled first stars would be a good place to search for metal-free stars, if they are sufficiency long-lived to survive until today. Similarly, both regions labeled first stars and second stars in out method would be a good places to search for stars enriched purely by the products of metal-free stars. From a theoretical point of view, the spatial distribution of first stars in our models should be directly comparable to the spatial distribution of metal-free stars in future detailed gas simulation, while the spatial distribution of both first and second stars should be comparable to the spatial distribution of PopIII-enriched stars in such simulations. These definitions are important to keep in mind when interpreting our results, as emphasized below.
As the distribution of both these populations of stars is primarily dependent on the highly-uncertain properties of Population III objects, our goal is to develop a simple model of metal dispersal that allows us explore a large range of possibilities in a straightforward way. Following our approach in SSF03, we adopt a model of outflows as spherical shells expanding into the Hubble flow (Ostriker & McKee 1988; Tegmark, Silk & Evrard 1993), for both PopIII and PopII/I objects. These shells are assumed to be driven only by their internal hot gas pressure and decelerated by inertia due to accreting material and gravitational drag while escaping from the host. In this case there are two relevant evolutionary equations: one that describes the change in the velocity of the bubble,
| (2) |
where the terms on the right hand side correspond to internal pressure, accumulation of material from the surrounding medium, and gravitational drag, respectively, and a second equation that describes the evolution of the internal energy of the bubble,
| (3) |
where the terms on the right hand side correspond to energy input from the supernovae and the work done by the interior gas. In these equations the overdots represent time derivatives, the subscripts s and b indicate shell and bubble quantities respectively, is physical radius of the shell, is the internal energy of the hot bubble gas, is the pressure of this gas, and is the mean IGM background density. Here we assume adiabatic expansion with an index such that
The evolution of each such bubble is completely determined by the mechanical luminosity evolution assigned, . Again for simplicity, we take both PopIII and PopII/I objects to undergo a starburst phase of years, but with different prescriptions for the total energy input into the wind. We approximately account for the gravitational potential of the host galaxy by subtracting the value of from the total wind energy, where is the total mass (dark + baryonic) of the object and is its virial radius. Approximating the collapse overdensity by a constant value of 178, the overdensity associated with a virialized cosmological object, then gives a mechanical luminosity of
where is the fraction of gas converted into stars, is the fraction of the SN kinetic energy that is channeled into the galaxy outflow, in the kinetic energy per supernova, is the number of supernovae per of stars, is the baryonic mass of the galaxy in units of solar mass, is the collapse redshift of the object, and is the Heaviside step function. Note the precise value of is not important as long as it short relative to the Myr Hubble time at the redshift in which we are most interested. However, the value of the prefactor in front of in eq. (2.2) is defined by this choice. Halving , for example would require for us to double this factor but have only a very weak effect on the time that the bubbles reach their neighbors, and hence on the final distribution of first and second stars. Note also that the gravitational drag is only important in objects with total masses and thus has only a minor impact on our results here.
The only difference in the wind evolution of PopIII and PopII/I arises from the product, , which, again following SSF03, we define as the “energy input per unit gas mass” , which we express below in units of . To determine this value in the PopII/I case, we take to be , which gives good agreement with the observed high-redshift star formation rates and abundances of metals measured in quasar absorption line systems (Thacker, Scannapieco, & Davis 2002; Scannapieco, Ferrara, & Madau 2002). Also in this case, we constrain by combining the overall efficiency of 30% derived for the object simulated by Mori, Ferrara, & Madau (2002) with the mass scaling derived in Ferrara, Pettini & Shchekinov (2000), which was obtained by determining the fraction of starburst sites that can produce a blow-out in a galaxy of a given mass. This gives where
| (5) |
and is a dimensionless parameter that increases linearly with the overall number of SNe produced in a starburst, divided by the star formation efficiency,
In the PopIII case, on the other hand, there are no direct constraints on either or the wind efficiency. For these objects we allow these parameters to be free, varying over a large range as discussed below. Finally, when outflows slow down to the point that they are no longer supersonic, our approximations break down, and the shell is likely to be fragmented by random motions. At this point we let the bubble expand with the Hubble flow. These prescriptions then give us a complete model of the comoving radius of an outflow at a redshift associated with a PopIII or PopII/I halo of mass collapsing at a redshift
Our goal is then to tag halos that form outside of all expanding shells as first stars objects, and to tag halos that form within PopIII outflows as second-stars objects. In our fiducial model we assume that in each such halo stars form with the same radial profile as the dark matter, although we also vary this assumption in §2.2. As we are concerned only with whether a halo is contained within any such wind from a neighbor or direct progenitor, we need not worry about the possibility of double counting by identifying the same collapsed object at multiple outputs. Rather to determine if a halo forming at a redshift has been enriched, we can safely compute for each and every object forming with and determine if any of them has overtaken the lower-redshift object. In this case the impact of a given halo on its neighbors as well as its direct descendants will be determined by the maximum computed at any , while all other smaller shells will have no impact on the calculation.
While this picture neglects the precise density and infall structure around each forming object, we are able to quantify the errors arising from this approximation by adopting two methods for computing the distance between two objects. Note however that as the outflows we are most concerned with occur at very high redshift, the nonlinear evolution of structure will not be as severe an issue as it is for lower-redshift winds.
One method of computing distances, which we shall refer to as “Eulerian,” allows each wind to move along with the center of mass of its central halo. This means that as we move between each output we compute the most likely daughter halo associated with each higher redshift outflow and re-center it around the position of this object. This takes advantage of the nonlinear motions computed in the simulation, but is likely to overestimate the impact of winds as it does not take into account the impact of infall around collapsing structures.
A second method of computing distances, which we shall refer to as “Lagrangian,” works completely in the reference frame in which the position of each halo is computed as the center of the mass of the original positions of the particles it contains. While this approach neglects much of the nonlinear information available from the simulation, it is nevertheless likely to represent a more fair comparison as: i.) our thin-shell solution, which assumes expansion in the Hubble flow, is essentially already working in this coordinate system; ii.) enrichment should be more closely dependent on the column depth between the source and recipient halos than on their physical separation. Furthermore this approach most directly parallels that of our previous analytical models (SSF03), and thus we adopt it as our fiducial method in the results presented below.
3. Results
In this section we summarize our results for a wide range of parameters choices and assumptions, the details of which is described in detail below. For reference purposes, the specifics of each of these runs is summarized in Table 1.
| Model | Distance | Linking | Distribution | Minimum | |
|---|---|---|---|---|---|
| Name | Measure | Length | of Stars | ||
| 2L | Lagrangian | 0.2 | Follows DM | K | |
| 3L | Lagrangian | 0.2 | Follows DM | K | |
| 4L | Lagrangian | 0.2 | Follows DM | K | |
| 2E | Eulerian | 0.2 | Follows DM | K | |
| 3E | Eulerian | 0.2 | Follows DM | K | |
| 4E | Eulerian | 0.2 | Follows DM | K | |
| 2Lc | Lagrangian | 0.2 | Central 10% | K | |
| 3Lc | Lagrangian | 0.2 | Central 10% | K | |
| 4Lc | Lagrangian | 0.2 | Central 10% | K | |
| 2L15 | Lagrangian | 0.15 | Follows DM | K | |
| 3L15 | Lagrangian | 0.15 | Follows DM | K | |
| 4L15 | Lagrangian | 0.15 | Follows DM | K | |
| 2LRc | Lagrangian | 0.2 | Central 10% | K/ K | |
| 3LRc | Lagrangian | 0.2 | Central 10% | K/ K | |
| 4LRc | Lagrangian | 0.2 | Central 10% | K/ K |
3.1. Fiducial Modeling
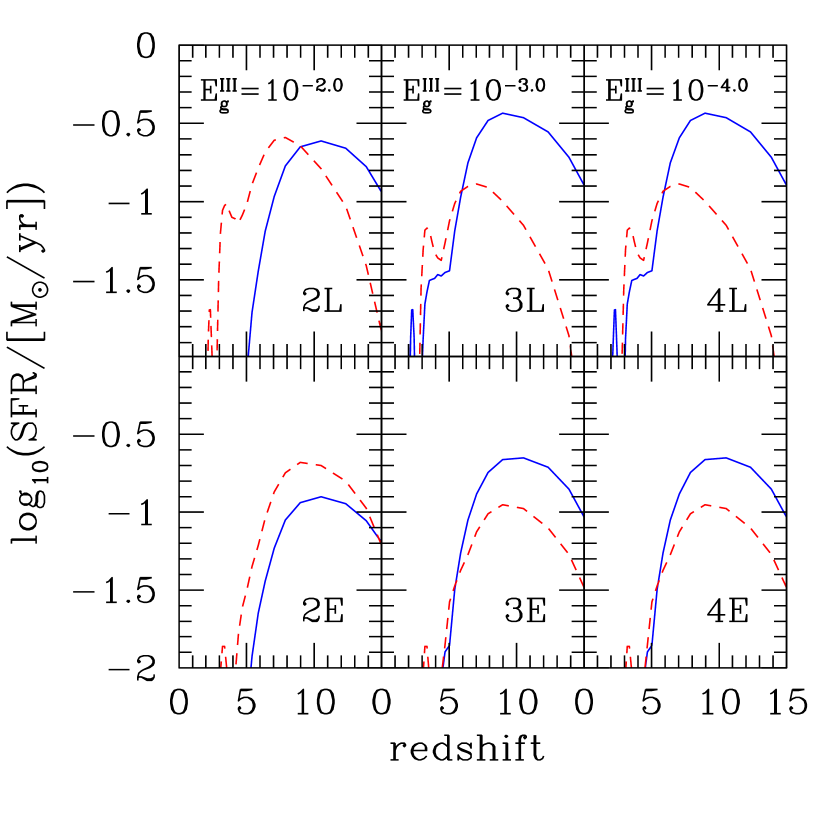
In Figure 1, we show the star formation rate in first and second stars as a function of redshift, for a wide range of feedback efficiencies and for both Lagrangian and Eulerian distances, corresponding to runs 2L-4L and 2E-4E in Table 1 respectively. When computing the star formation rate, we consider only stars that end up gravitationally bound to our final galaxy, so as to exclude objects formed near the boundary of the simulation volume. In all cases we assume such that 10% of the gas mass in each PopIII halo is converted into stars. Note that while this value is consistent with the observed star formation rate of normal stars at lower redshifts (e.g. Scannapieco, Ferrara, & Madau 02), it is certainly possible that metal-free star formation was less efficient and that a lower value such as is appropriate in the PopIII case. While this normalization will remain a primary uncertainty in our investigation, it can be easily accounted for by rescaling our final results, and does not affect the overall trends on which we are primarily focused.
In SSF03, we considered the range of physically possible values in detail. An upper bound is provided by the case in which the initial mass function (IMF) of primordial stars is biased to very high masses While much of the stars in this mass range would have died forming black holes, progenitors with masses between and end their lives in tremendously powerful pair-production supernovae. In these SNe, pair creation softens the equation state at the end of central carbon burning, leading to rapid collapse, followed by explosive burning (e.g. Barkat, Rakavy, & Sack 1967; Ober, El Eid, & Fricke 1983; Bond, Arnett, Carr 1984; Heger & Woosley 2002). The more massive the star, the higher the temperature at bounce and the heavier the elements that are produced by nuclear fusion. In all cases, the star is completely disrupted and the ejection energies ( ergs) are enormous. In this case, choosing a narrow Gaussian IMF centered at 200 , taking a 10% star formation efficiency, and fixing places a generous upper limit of corresponding to the strongest feedback model in Fig. 1. Note that while this extreme model is useful to set an upper limit on feedback, widespread enrichment from stars with such an IMF is inconsistent with the observed abundance patterns of metal poor stars owing to the absence of pair-instability yields in the data (Umeda & Nomoto 2003; Tumlinson, Venktesan, & Shull 2004).
A lower limit on on the other hand, is computed by assuming that such stars form with a typical Salpeter IMF, and which gives Not only does this model take metal ejection from PopIII to be somewhat less efficient than from PopII/I objects, but as shown in SSF03, even less efficient models of PopIII metal ejection are so weak that a large primordial star formation rate is predicted to this day. Thus the weakest, model shown in Figure 1 can be taken to represent a conservative estimate of the minimum efficiency with which metals from PopIII objects were mixed into their surroundings.
This large range of efficiencies of PopIII objects is what forces us to adopt a semi-analytical model of winds in the first place. Yet, as shown in Figure 1, robust general conclusions can be drawn despite these uncertainties. Firstly, the primordial objects that predated the Milky-Way were formed over an extremely large range of redshifts, mirroring the overall cosmological PopIII distribution (see SSF03). Furthermore, for all values, and in both the Eulerian and Lagrangian models, appreciable PopIII star formation continues down to a relatively low redshift of In fact, excluding the most extreme models, PopIII formation continues at a substantial rate down to
While increasing the efficiency of feedback has the impact of moving the PopIII star formation to higher redshifts, the overall peak and width of the epoch of PopIII formation are surprisingly constant among models. Instead, the distribution of second stars is much more sensitive to these uncertainties, ranging from an extended burst in the case, to a weak high-redshift burst in the case.
Again, we stress that these second stars are the stars forming in halos that have been initally pre-enriched by PopIII neighbors, and that a significant population of Pop-III enriched stars are also likely to exist in “first stars” halos forming of initially primordial gas. Finally, comparing the Eulerian and Lagrangian models, we find, as expected, that Eulerian distances lead to somewhat more efficient metal dispersal, although this is likely to be somewhat of an overestimate. Nevertheless the differences between these two models are relatively mild for all choices of giving us further confidence in the approximations involved in our semi-analytic approach.
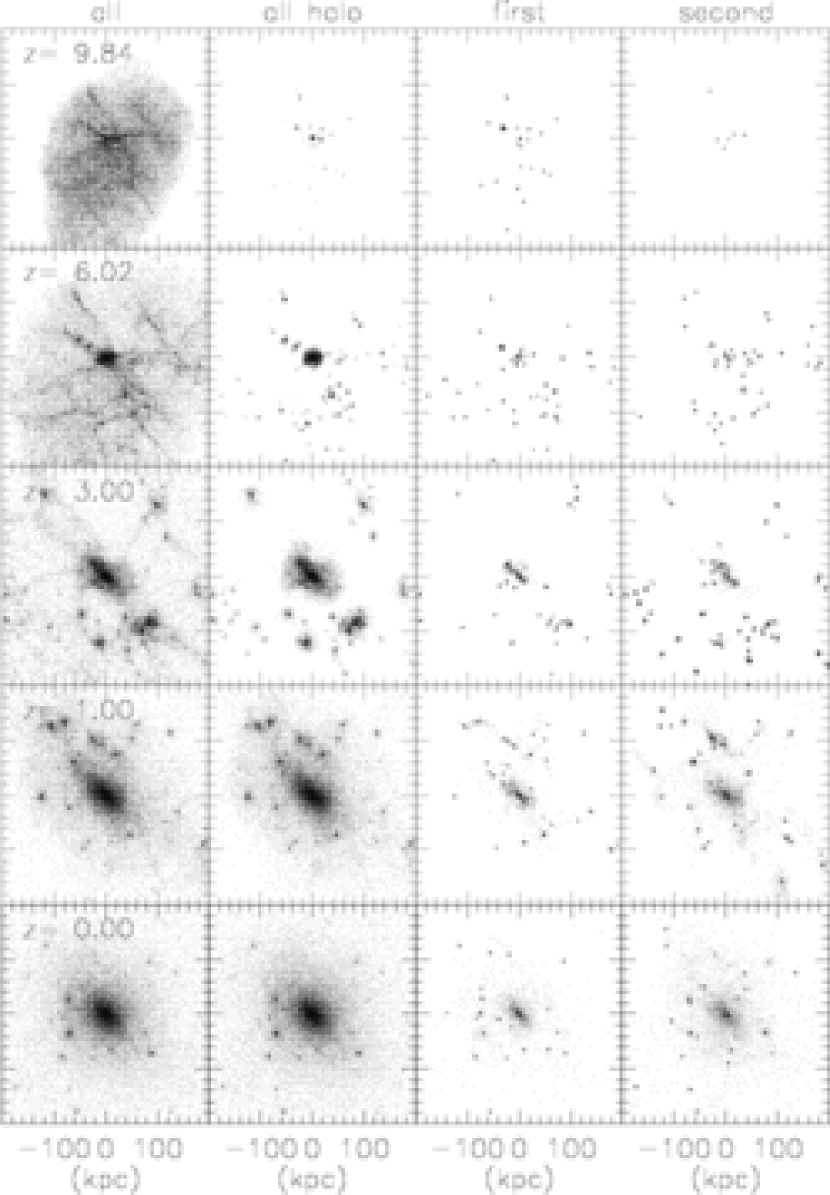
Figure 2 demonstrates the positions of the first and second stars at different redshifts in the Lagrangian model with . Here and below we compute the masses as they would be if there were no mass loss due to stellar evolution. Thus these plots should be rescaled by the fraction of first and second stars surviving to a given redshift, model-dependent quantities that we do not address here.
At early times (), the first stars are forming close to the central density peak of the progenitor galaxy, due to the higher density peaks in this region. Second stars form in the halo in the neighborhood of first stars, because they condense from gas that is enriched by the material from the explosions from these objects. At a later time (), new first stars are still forming, but now on the outer regions of the progenitor galaxy, because they are not yet affected by the bubbles from the first stars that formed preferentially in the central region. As seen in the star formation rate plot, Figure 1, the formation of the first and second stars is complete around , at which time the full region is enriched with metals. Also at this redshift, first and second stars start to be accreted into the assembling Galactic halo. This assembly is almost complete by , and thus the distribution at this redshift is similar to that at , although at the stars are more smoothly distributed.
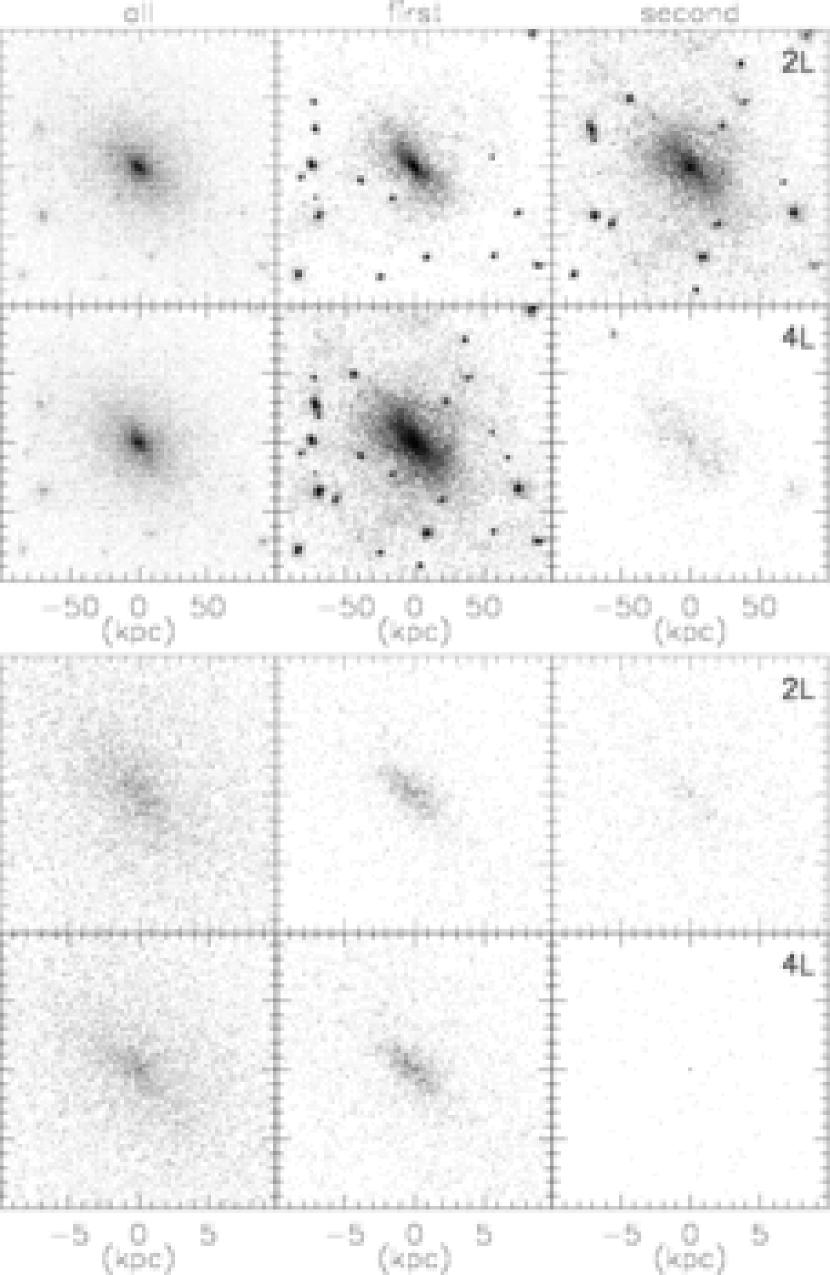
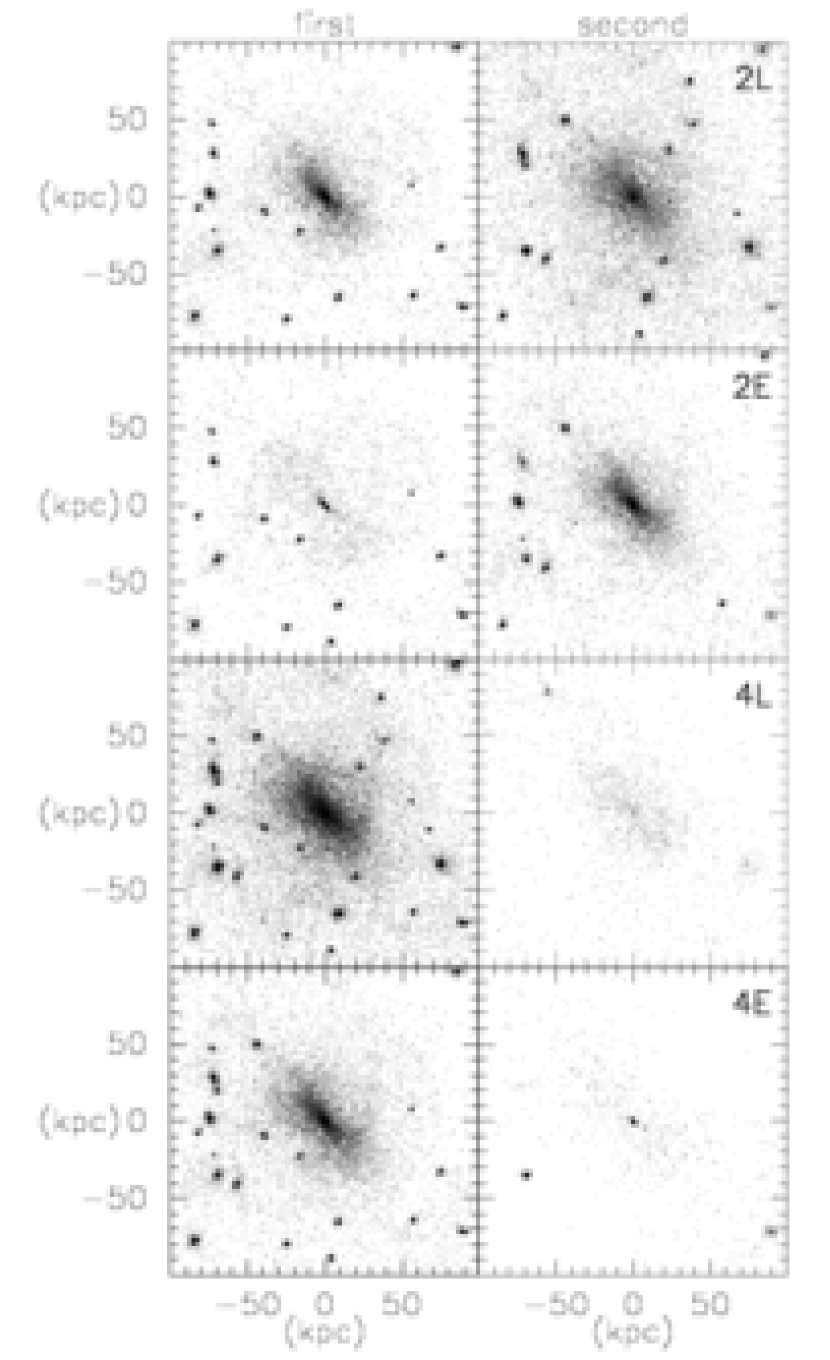
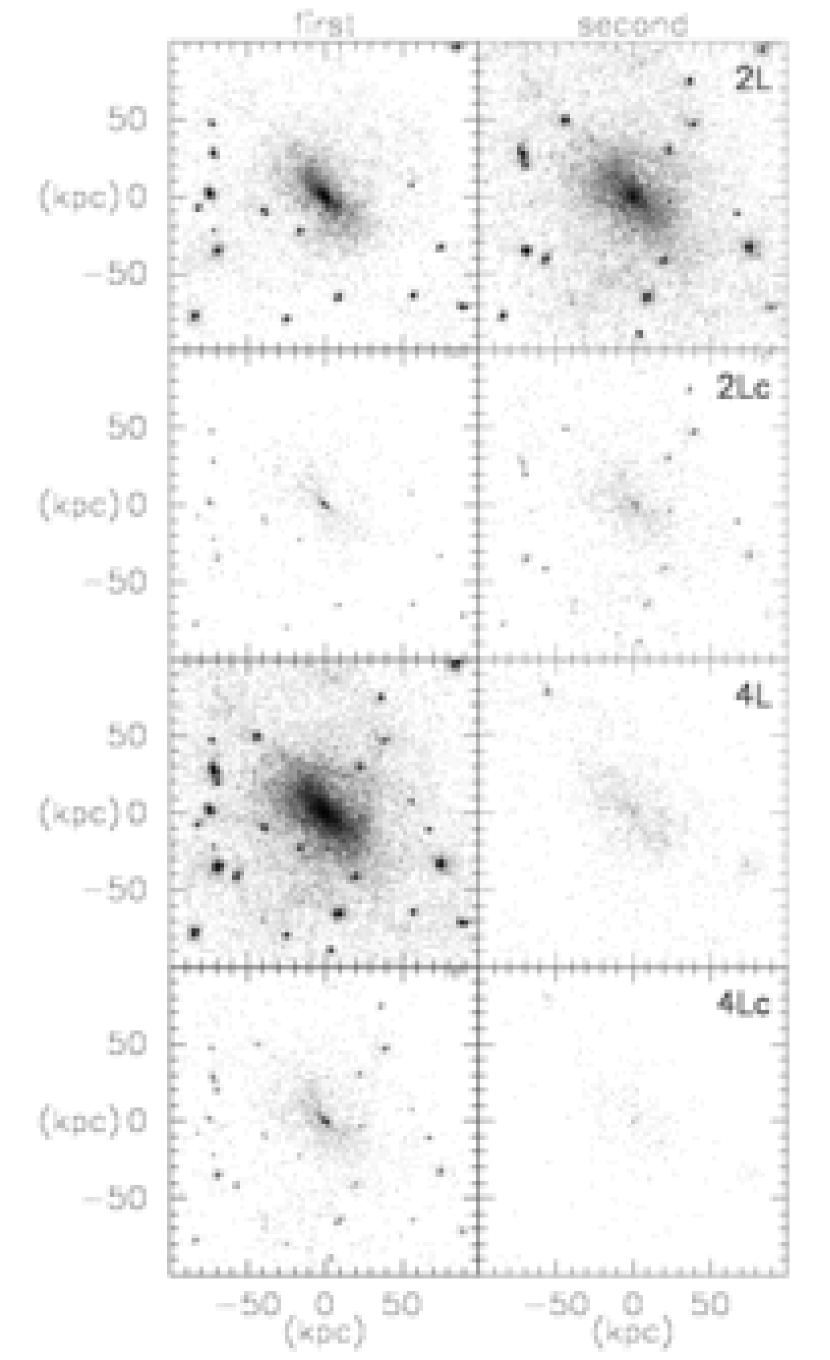
In Figure 3 we show the spatial distribution of the first and second stars in closer detail, contrasting two extreme models with strong and weak feedback. From this figure, we see that for all choices of , the first or second stars are not confined to the center of the Galaxy. Rather, this plots shows a widespread distribution that is punctuated by dense concentrations of stars associated with satellite galaxies, as seen most clearly in the 100 kpc panels. Furthermore, comparing the satellite distributions between the two models shows that as one moves from the strongest to the weakest feedback models, a large number of the satellite second-generation objects switch over to the first-generation population. This is because these objects were only enriched by primordial stars, thus a large number of them form from primordial gas if the winds from PopIII stars are weakened. The more isolated the satellite galaxy, the more likely it is to contain primordial stars even in strong feedback models.
Focusing on the central 10 kpc of our simulation, which is more representative of the Galaxy itself, we see that the distribution of first and second stars, while peaked towards the center, nevertheless contains many stars at large radii. Again this is true even in the most extreme feedback models, and it represents the single most important finding of our investigation. If they have sufficiently long lifetimes, a significant number of stars formed in initially primordial star clusters should be found in the Galactic halo, regardless of the specifics of PopIII star formation.
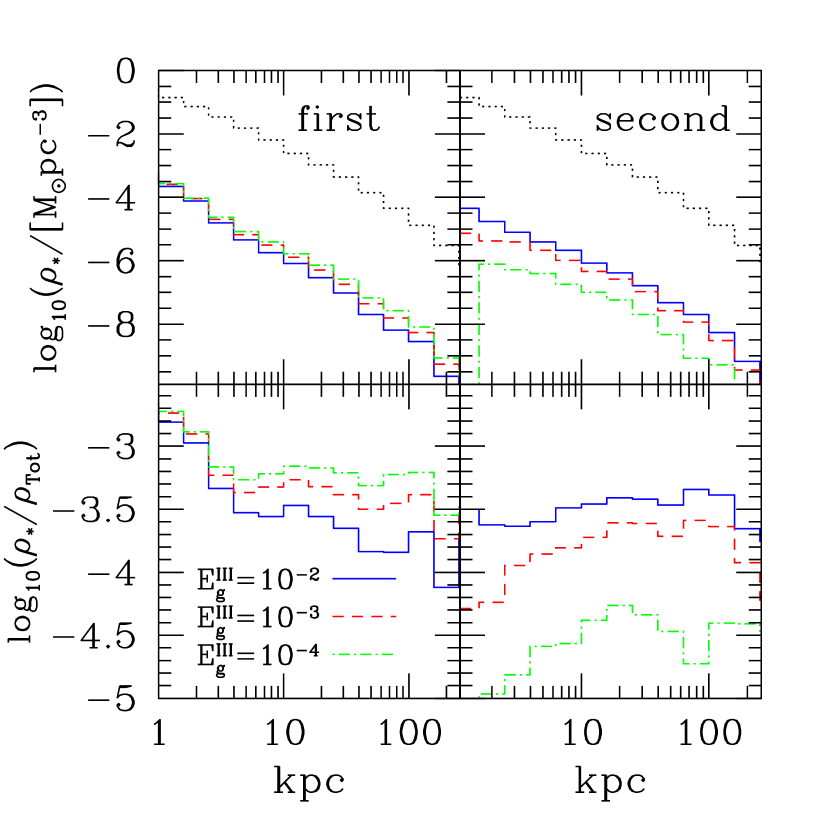
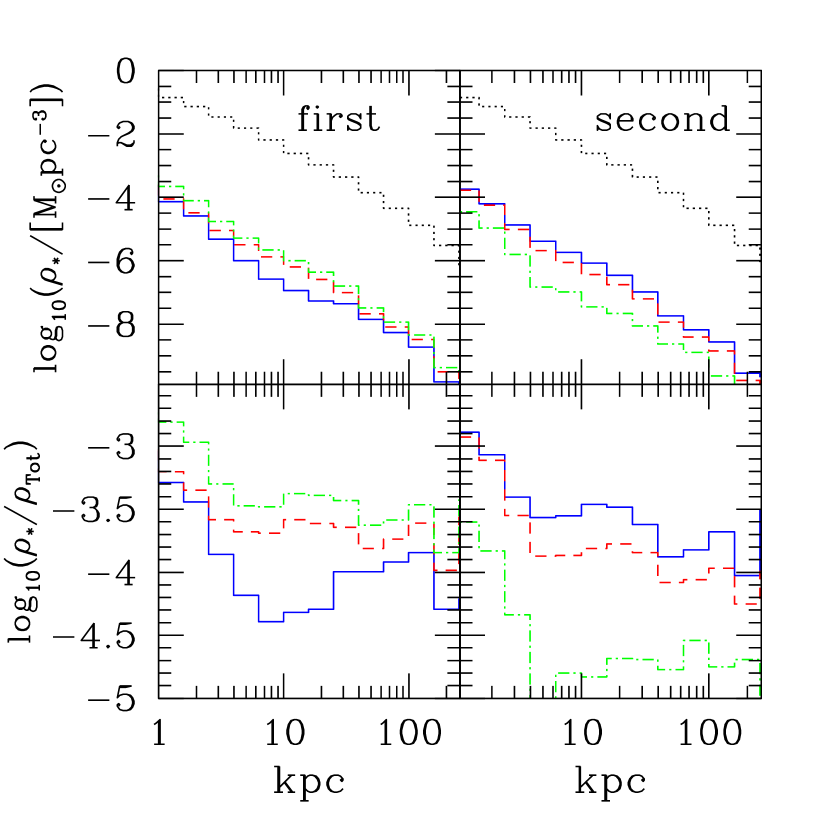
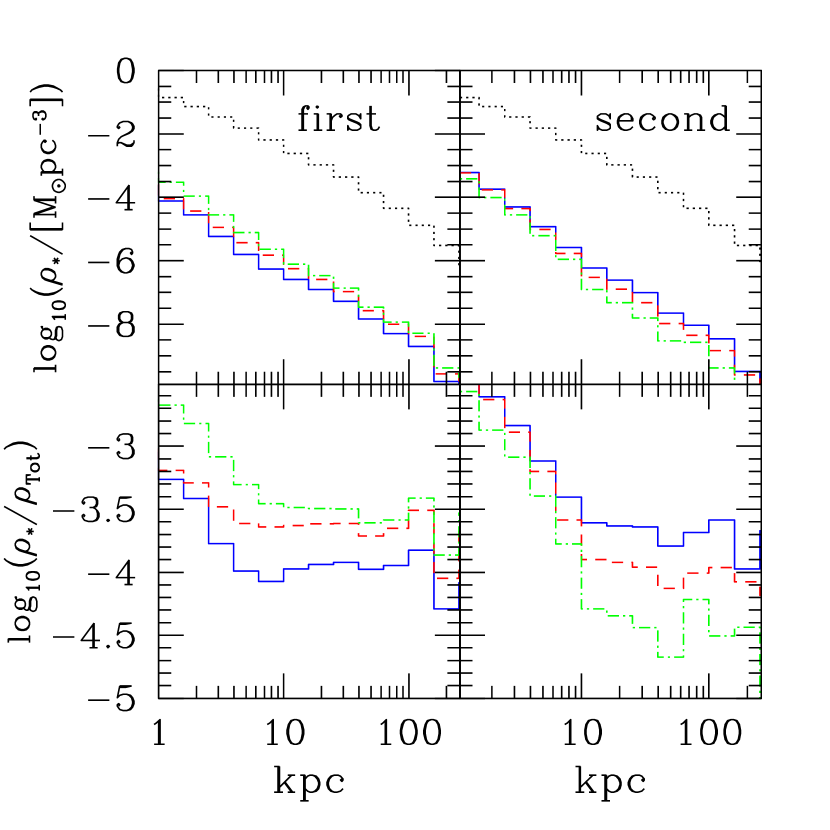
To quantify this statement further, in Figure 4 we plot the radial mass density of first and second stars, as compared to the dark matter distribution in our simulation. Again, in computing these masses, we assume that 10% of the gas mass in each halo is converted into stars and we intentionally make no attempt to account for mass loss due to the evolution of these stars. Furthermore, we plot only out to 250 kpc, which is 1/4 the size of the high-resolution region.
Here we see that the density profiles of first and second stars are similar to the total dark matter density profile, although the second stars have a slightly shallower slope. As a result, the density of first stars at the center is 100 times higher than at the 8 kpc orbital radius of the sun. However, the important number for developing observational strategies is the relative density of such stars with respect to field stars. While this is not directly computed in our simulation, the lower panels of Figure 4 show the local mass density of stars normalized by the local density of dark matter.
Amazingly, the mass fraction contained in the first stars varies only very weakly with radius. Moving from 1 to 100 kpc in the model, for example, the fraction of the mass in first stars decreases only by a factor Furthermore, increasing the efficiency of PopIII winds to has the effect of decreasing the fraction of first stars without strongly affecting their radial distribution. Note that in the inner region, the overall stellar density is expected to be higher than dark matter density (e.g. Widrow & Dubinski 2005), that is the density of spheroidal stellar component of the Milky Way decreases with the radius more quickly than the dark matter component. Therefore, the fraction of the first stars compared with the field stars should be somewhat higher at large radii than what Figure 4 predicts. This raises the possibility that the overall fraction of first stars may even be higher in the halo than in the bulge!
These results have a number of immediate implications. First, as stars enriched only by primordial stars (which trace the overall distribution of both first and second stars in our study) are found throughout the Galactic halo, measured abundances of metal-poor stars in the Galactic halo should be taken as directly constraining the properties of primordial objects. Furthermore since only a slightly larger fraction of stars in the Galactic bulge are primordial, there is no compelling theoretical reason that observations should have to focus in this extremely difficult region. Instead the lack of metal-free stars observed in the halo is likely to imply a real lower mass limit in the metal free IMF of at least the mass of a low-metallicity star with a lifetime comparable to the Hubble time (Fagotto et al. 1994). In fact the pc-3 value for PopIII stars in the solar neighborhood we compute is so high as compared to the observed stellar mass density of pc-3 (Preston, Shectman, & Beers 1991) that several primordial stars would have been observed even if were over an order of magnitude lower than the value we used to normalize our approach. Finally, it means that there is a good chance that many of the stars with extremely unusual abundances, such as HE0107-5240 (Christlieb et al. 2002) and HE1327-2326 (Frebel et al. 2005; Aoki et al. 2006), may in fact represent the products of self-enrichment in primordial star clusters, which display the yields of a single neighboring PopIII star (e.g. Umeda & Nomoto 2003; Suda et al. 2004; Iwamoto et al. 2005; Tsujimoto & Shigeyama 2006). Note that this widespread PopIII star distribution is also consistent with studies of the lithium-7 abundance of metal-poor [Fe/H] -1.3 stars, which suggest that a large fraction of the baryonic matter in the early halo may have been processed through such stars (Piau et al. 2006).
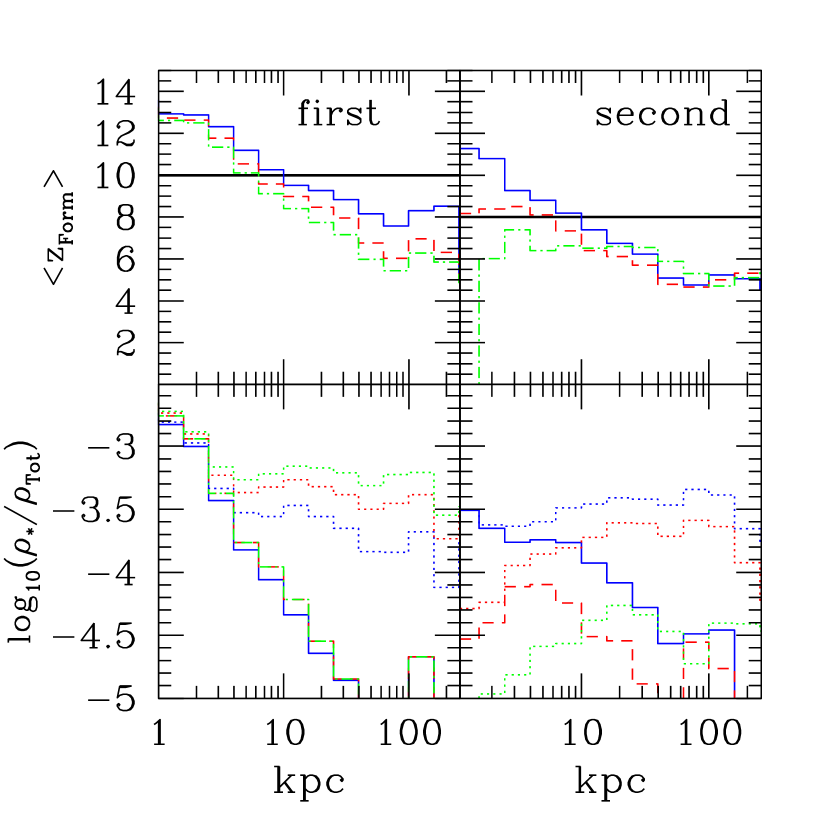
In the upper left panel of Figure 5 we plot the mean redshift of formation of the first stars as a function of radius. While this is not a directly observable quantity, it nevertheless helps in contrasting our results with previous estimates that assume a single formation redshift or for the first stars. In all models decreases monotonically with radius, moving from near the Galactic center, to at a distance of 100 kpc. In the lower left panel of this figure, we plot the normalized radial mass density of first stars with formation redshifts above 10. This shows that essentially all of the earliest forming first stars are located near the Galactic center, and that their relative number density drops by at least a factor of 30 as we move towards 8 kpc.
These results are reminiscent of those of White & Springel (2000) and Diemand, Madau, & Moore (2005), who used N-body simulations to show that the oldest stars are very strongly concentrated near the Galactic center (see also Miralda-Escudé 2000). Interestingly, White & Springel (2000) also estimated the history of very metal-poor Galactic stars by rescaling an N-body cluster simulation to Milky Way scales, and associating PopIII stars with all particles collapsing into K halos. They found that these stars had a mean formation redshift of and a spatial distribution closely following the overall dark matter distribution. Our more detailed modeling shows that metal free star formation displays elements of both these scenarios. Primordial stars form in the smallest halos that can cool efficiently, but only within a subset of these halos that is biased to the highest redshifts. These stars do not follow the overall mass distribution, but display a only weak radial density gradient. And their overall formation redshifts, while always high, nevertheless drop off strongly as a function of radius.
Finally, the upper right panel of Figure 5 shows the average formation redshift of second stars in our simulation. Again we remind the reader that these are the stars that contain metal from primordial stars but are not formed in the same star clusters. These stars display a similar radial trend as the first stars, but shifted to somewhat lower formation redshifts. In this case, the majority of these stars in the solar neighborhood are formed at redshifts below 8, as shown in the lower right panel of this figure.
3.2. Model Tests and Refinements
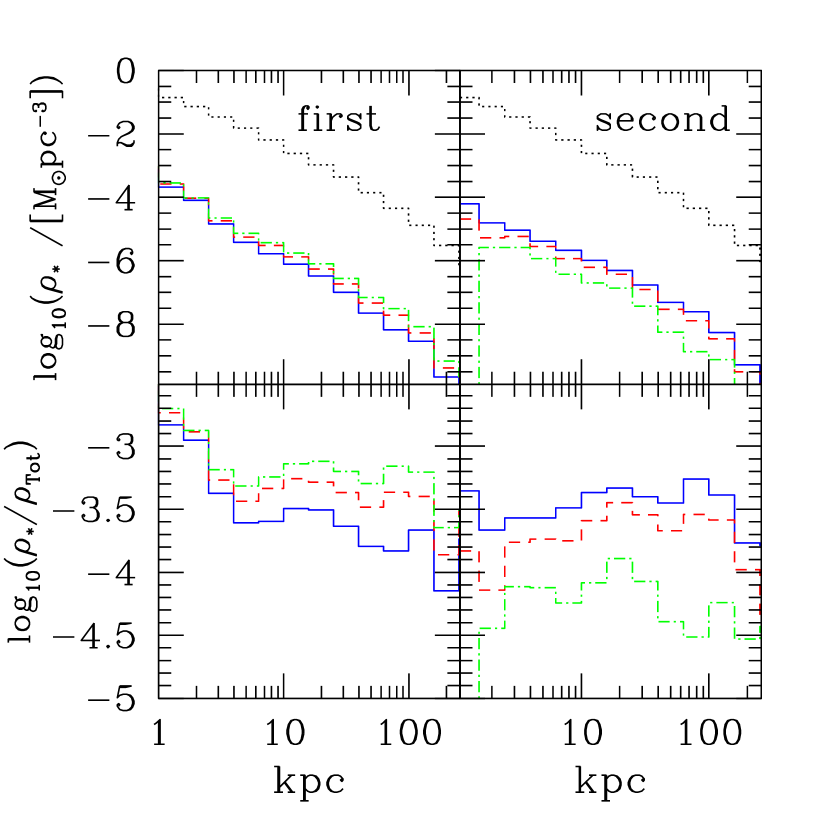
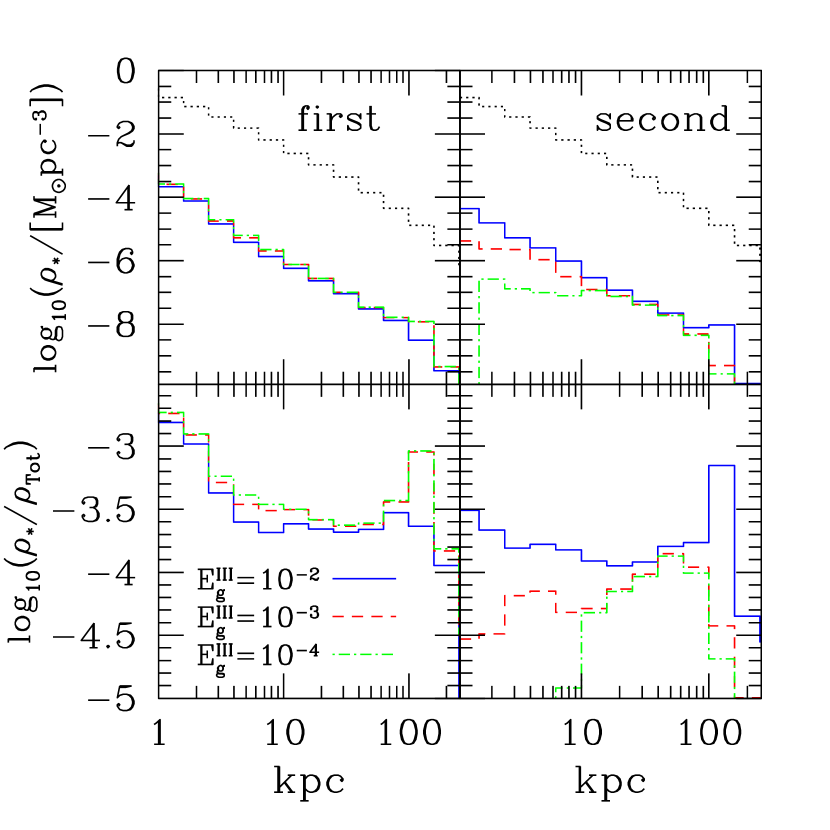
As our results in Figs. 3 and 4 have a number of wide-reaching implications, it is important to understand to what degree they are dependent on our assumptions. The primary simplification in our model is our use of a Lagrangian coordinate system combined with a bubble model that assumes expansion into the Hubble flow. To asses this approximation, we show in Figure 6 the results of a calculation that replaces the initial coordinates with “Eulerian positions” that re-center each bubble from output to output, as described in §2.2. As this approach combines the large bubble radii computed in the absence of infall, with the small separation computed by accounting for the proper motions of halos, it can be taken as providing a lower limit on the distribution of first stars.
Thus, it is not surprising that the densities of first stars in these models are lower than their Lagrangian counterparts. Yet, in no cases are these differences dramatic. Instead, the radial distributions in the (model E3 in Table 1) and (model E4) cases in Figure 4 show only a slightly lower overall normalization and a marginally steeper radial trend than seen in the Lagrangian case. The model also shows an overall radial trend that is very similar to that in Fig. 4, although it contains a gap from 5-20 kpc with a factor of deficit in stars. Thus, even in this most extreme of any of our models, the Galactic halo contains a substantial number of the remnants of PopIII objects.
On the other hand, much larger differences between our Eulerian and Lagrangian models are visible in the distribution of second stars. These stars are substantially more centrally-concentrated in the Eulerian models, and in the case this difference is so severe that very few second stars are located in the Galactic halo. This represents the largest uncertainty in our approach, and thus for the limited case of a weak-feedback model, we are unable to draw any clear conclusions as to the halo distribution of second stars.
The differences between the Lagrangian and Eulerian approaches are further investigated in Figure 7, which shows the spatial distribution of first and second stars in both models. Here we see the same overall trends as in the radial profiles. In the strong feedback case, first and second stars are more concentrated than in the Eulerian approach, although in both models significant numbers of these stars are found in the halo and in satellite galaxies. In the weak feedback case, on the other hand, the differences in the first-star distribution are minor, but the lack of second stars in the Galactic halo in the Eulerian model is considerable. Finally, apart from the difference in radial trends, the detailed distribution of satellites containing PopIII stars differ somewhat between each of these approaches. Although in general, there are fewer PopIII satellites in the Eulerian cases, there are also occasionally PopIII satellites in these models without Lagrangian counterparts.
A second important issue is our association of stars with the overall distribution of dark matter in each halo. In reality, the gas in a given object will condense into a rotationally-supported disk whose radius is substantially smaller that its dark matter virial radius. Furthermore, due to the increased impact of tidal effects on the most loosely bound particles, it is possible that stars forming in such disks may end up distributed significantly differently at than their associated dark matter.
To account for this possibility, we repeated our Lagrangian model, but now only associating stars with the inner 10% of the dark matter particles in first and second-generation objects, while leaving the number of stars formed in each halo fixed. The resulting radial distributions and spatial profiles are shown in Figures 8 and 9, respectively. Here we see that while limiting the number of particles associated with stars leads to larger statistical fluctuations, the distribution of first and second stars otherwise remains the same as in our fiducial modeling. Carrying out the same exercise in the Eulerian case yields similar agreement, and thus our results do not seem to be affected by differences in tides across halos.
Another important parameter in our analysis is our choice of linking length when identifying halos. To test the dependence of our results on this choice, we generated new lists using a much smaller length, which associates halos with objects almost twice as dense as in the standard picture. In Figure 10 we show the results of this calculation in the Lagrangian case (models 2L15-4L15).

From the left panels of this figure, we see that while adopting this more stringent criteria reduces the number of PopIII stars somewhat, this effect is no stronger than a factor of Furthermore, the overall radial profiles in the case are very similar, if not flatter than in the fiducial model, indicating that the choice of linking length has no impact on our conclusions about the radial distribution of first stars. On the other hand, changing results in a substantial increase the number of second-stars within kpc as shown in the right panels. This can be traced to the presence of a large object at , which was identified as a single large halo in the case, but split into several smaller objects in the case. While in the fiducial case, this large object was a direct descendant of a first stars halo, and thus excluded from the second-stars count, in the case, most of the mass in this object was tagged as neighboring halos, and was added to the second-stars count. While this difference is consistent with our approach to counting first and second stars, it nevertheless illustrates some of the ambiguities involved in distinguishing stars that are formed in gas initially enriched by primordial stars, from stars that are formed within purely self-enriched primordial gas. Note however, that at Galactocentric radii kpc, the overall distributions of second stars are similar between the models with different choices of linking length.
Another concern is the possibility that our models are assigning first and second stars to all halos that collapse in primordial areas or areas enriched only by primordial stars. However, a one-to-one association between dark matter halos and Milky-Way satellites leads to a large excess with respect to their observed numbers, which is commonly referred to as the missing satellite problem (e.g. Moore et al. 1999). Although ram pressure stripping before star formation (e.g. Scannapieco, Ferrara, & Broadhurst 2002) tidal stripping after star formation (e.g. Kravstov, Gnedin, & Klypin 2004) and other issues are important in resolving this issue, the largest source of suppression of dwarf galaxy formation is the increase in IGM thermal pressure following reionization (e.g. . Bullock, Kravstov,& Weinberg 2000). While reionization will clearly have the largest effect on the very latest forming stars, rather that the objects in which we are most concerned here, the relatively large number of satellites seen in plots such as Figs. 2 and 3 indicates that our results may nevertheless suffer from such a excess of Galactic satellites.
Recently Benson et al. (2002), have shown that incorporating the increase in IGM pressure associated with reionization into semi-analytical models of galaxy formation helps to bring their faint end galaxy counts into rough agreement with observations. Following their lead then, we carried out a set of reionization runs, in which we imposed the minimum filtering mass which approximates that computed in Gnedin (2000). In this case the minimum virial temperature in our calculation is increased linearly from the K molecular hydrogen limit at , to below the final overlap redshift of . The resulting spatial distributions and radial profiles are shown in Figures 11 and 12 respectively.
From these plots, it is clear that incorporating such suppression leads to far fewer first and second satellites, moving from such objects with 100 kpc in our fiducial models, to less than 10 in the reionization models. Nevertheless, as shown in Figure 12 the overall radial profile of first and second stars are quite similar to our fiducial results. With metal-free stars (first stars), and stars that contain the products of metal-free stars (first + second stars) forming at all Galactocentric radii. Thus we do not expect the details of suppression of dwarf galaxy formation to have a strong effect on our conclusions.
Finally, we note that the cosmological parameters used in our model have recently been revised by the 3-year data release from the Wilkinson Microwave Anisotropy Probe experiment (Spergel et al. 2006). In general, we expect that the low and values implied by these measurements should strenghten our conclusions. Indeed, the reduced power on small scales leads to a delay in the onset of star formation and metal enrichment in our K halos. As a consequence, the first stars will form at more recent epochs than in our fiducial model, and are likely to give a larger contribution to the halo population.
3.3. Kinematics of First and Second Stars
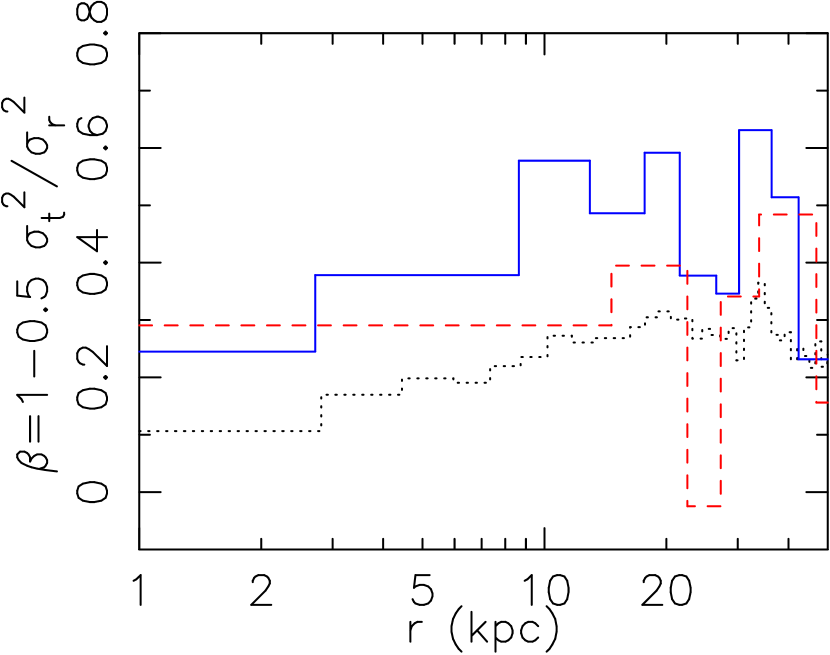
Our simulation results offer not only the spatial distribution of first and second stars, but also their kinematics. In this section, we present the results of a representative Lagrangian model, model 2Lc. Figure 13 demonstrates the predicted radial profile of the anisotropy parameter, , of the velocity dispersions first and second star particles as compared to the overall distribution. Here, , where is the radial velocity dispersion and is the tangential velocity dispersion. The bin sizes are adjusted so that each consists of 100 particles for first and second star case and 1000 particles for the overall distribution. Here, we focus on the results within 50 kpc. Overall DM particles show almost isotropic velocity dispersion in the central region, and gradually increases, i.e., the radial velocity dispersion becomes more dominant, with increasing radius. This is consistent with previous equally high-resolution N-body simulations of a Milky Way size halo (e.g., Diemand et al. 2005). Compared with the overall particles, the first star particles have higher , i.e., the radial velocity dispersion is more dominant, especially at smaller radii. This is expected, because the first star particles in the inner region form in halos closer to the density peak of the main system at high redshifts, and fall into the main system at earlier epochs. Second stars have a degree of anisotropy between the first particles and the overall distribution.
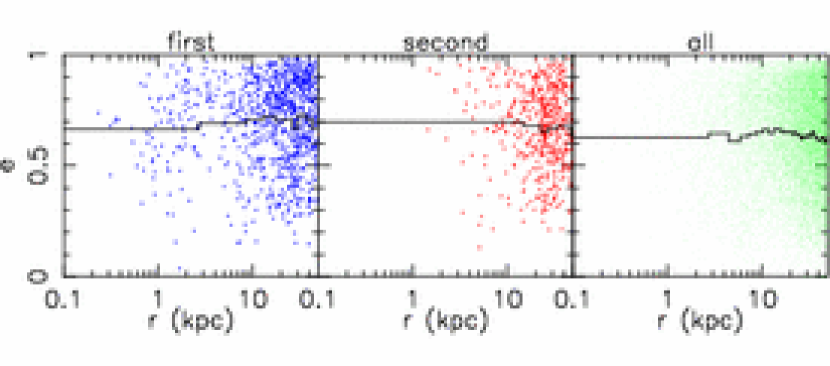
We also measure the eccentricity of the orbits of the first and second stars in Figure 14. To compute these values, we run an N-body simulation for these particles in the fixed potential of the final system. Here, we fix the position of all the particles within the virial radius, and follow the evolution of the first and second particles from their position and velocity at . We then compute the motion of each particle over a full orbit after its first passing through pericenter or apocenter, and measure the maximum, , and minimum, , radii over this full trajectory. The eccentricity is then defined as, . Figure 14 shows that both first and second particles have a relatively high eccentricity (). This slightly exceeds the mean value of the overall distribution, which is roughly consistent with the observed value of (Chiba & Beers 2000).
4. Conclusions
Theoretical models of PopIII star formation have focused on their overall cosmological distribution, or their contribution to the global star formation history of the Galaxy. But observations are not of this type. As PopIII stars would have been carrying out nuclear burning for roughly a Hubble time, they must be faint, low-mass stars that are only observable nearby, and in environments without significant dust extinction or crowding from higher-mass stars. For this reason searches for metal-poor stars have been targeted only in the halo of the Milky Way, with an emphasis on halo stars roughly in the solar neighborhood. This means that comparisons between theory and observations have been dependent on extremely uncertain extrapolations, drawn from measurements in a limited environment.
In this work, we have carried out the first theoretical investigation able to quantify the impact of this extrapolation. Our method relies upon two key ingredients. The first of these is an extremely high-resolution N-body simulation of the Milky Way, which is capable of reliably capturing the formation of objects down to the K atomic cooling limit. The second is a simple and flexible analytic model of metal-dispersal, which allows us to quickly identify regions of metal-free star formation, despite the enormous uncertainties in the properties of the first stars and supernovae.
Our results are robust and optimistic. Despite changing the efficiency of metal dispersal by two orders of magnitude, adopting widely different estimates for the distances between neighboring objects, and varying our assumptions as to the regions of star-formation within collapsed objects, local measurements place substantial constraints on PopIII star formation in all of our models. In particular we have found that:
(1) Galactic PopIII star formation occurs over a range of redshifts, as metal pollution takes a substantial amount of time to affect all the Milky Way progenitors. While Galactic PopIII star formation is likely to have peaked at , it should have continued at appreciable values down to , paralleling the overall cosmological evolution.
(2) The mass fraction of PopIII stars in the Galactic halo near the solar orbit is only slightly lower than it is in the bulge. Thus, if they have sufficiently long lifetimes, a significant number of stars formed in initially primordial star clusters should be found in the Galactic halo. This means that there is no compelling theoretical reason to motivate observational searches in more difficult environments, and present observations should be taken as directly constraining the properties of PopIII stars. This picture is also consistent with observational studies of the lithium-7 abundance of metal-poor stars, which suggests that a large fraction of the baryonic matter in the early halo may have been proceed by PopIII stars.
(3) While our models are not able to quantify self-enrichment within individual star clusters in detail, we expect that stars enriched purely by metal-free stars in the same cluster will exist cospatially with the “first stars” in our model. Furthermore we are able to make statements about the distribution of “second stars” that do not form cospatially with PopIII stars, but rather form out of gas that is enriched by neighboring clusters of PopIII stars. In almost all of our models, the mass fraction of such stars in the Galactic halo is comparable to that of PopIII stars, although there are very few second stars in our weakest , Eulerian case. Unless the efficiency of PopIII metal ejection was at the lower end of the allowed range, many of these stars should also be found nearby.
(4) We find that the final distribution of first and second stars remains practically unchanged when we move from our fiducial model, which associates stars with all dark-matter particles in each first and second generation object, to a centrally-concentrated model, which associates stars with only the inner 10% of particles in each object. Thus we do not expect the spatial distribution of stars within each first and second generation object to affect their distribution today.
(5) Incorporating the effects of reionization leads to an overall smaller number of satellite galaxies containing first and second stars, and helps to address the “missing satellite problem.” However including such effects does not change the overall widespread distribution of these stars.
While stars are the sources of all metals, metals need not be contained in every star. Furthermore, we have shown here that stars without metals need not to be located near the Galactic center. Rather observations of metal-poor halo stars are providing us with direct constraints on the properties of the first stars. Though primordial stars were formed in the distant past, some of our greatest clues to the process of primordial star formation are likely to come from our local Galactic neighborhood.
References
- (1)
- (2) Abel, T., Bryan, G., & Norman, M. 2000, ApJ, 540, 39
- (3) Aoki et al. 2006, ApJ, 639, 897
- (4) Aracil, B., Petitjean, P., Pichon, C., & Bergeron, J. 2004, A&A, 419, 811
- (5) Bailin, J., Kawata, D., Gibson, B.K. et al. 2005, ApJL, 627, 17
- (6) Barkat, Z., Rakavy, G., & Sack, N. 1967, Phys. Rev. Lett. 18, 379
- (7) Barklem, P., et al. 2005, A&A, 439, 129
- (8) Battaglia, G. et al. 2005, MNRAS, 364, 433,
- (9) Beers, T. C., Preston, G. W., & Schechtman, S. A. 1992, AJ, 103, 1987
- (10) Beers, T. C., & Christlieb, N. 2005, ARA&A, 43, 531
- (11) Benson, A. J., Lacey, C. G., Baugh, C. M., Cole, S., & Frenk, C. S. 2002, MNRAS, 333, 156
- (12) Bertschinger, E. 2001, ApJS, 137, 1
- (13) Bond, J. R., Arnett, W. D., & Carr, B. J. 1984, ApJ, 280, 825
- (14) Bromm, V., Ferrara, A., Coppi, P. S., & Larson, R. B. 2001, MNRAS, 328, 969
- (15) Bullock, J., Kravstov, A., V., & Weinberg, D. H. 2001, ApJ, 539, 517
- (16) Carretta, E., Gratton, R., Cohen, J.G., Beers, T. C., & Christlieb, N. 2002, AJ, 124, 481
- (17) Cayrel, R. et al. 2004, A&A, 416, 1117
- (18) Chiba, M., & Beers, T. C. 2000, AJ, 119, 2843
- (19) Christlieb, N. et al. 2002, Nature, 419, 904
- (20) Ciardi, B., Ferrara, A., & Abel, T. 2000, ApJ, 533, 594
- (21) Cohen, J. G., et al. 2004, ApJ, 612, 110
- (22) Davis, M., Efstathiou, G., Frenk, C. S., & White, S. D. M. 1985, ApJ, 292, 371
- (23) Dawson, S., et al. 2004, ApJ, 617, 707
- (24) Dehnen, W., McLaughlin, D., & Sachania, J. 2006, MNRAS, 369, 1688
- (25) Dekel, A., & Rees, M. J. 1987, Nature, 326, 455
- (26) Diemand, J., Madau, P., Moore, B. 2005, MNRAS, 364, 367
- (27) Fagotto, F. Bressan, A., Bertelli, G., & Chiosi, C. 1994, A&AS, 104, 365
- (28) Ferrara, A., Pettini, M., & Shchekinov, Y. 2000, MNRAS, 319, 539
- (29) Frebel, A., et al. 2005, Nature, 434, 871
- (30) Freeman, K., & Bland-Hawthorn, J. 2002, ARA&A, 40, 480
- (31) Glover, S. C. O., & Brand, P. W. J. L. 2001, MNRAS, 321, 385
- (32) Gnedin, N. Y. 2000, ApJ, 542, 535
- (33) Greif, T. H., & Bromm, V. 2006, MNRAS, submitted (astro-ph/0604367)
- (34) Haiman, Z., Rees, M. J., & Loeb, A. 1996, ApJ, 467, 522
- (35) Haiman, Z., Rees, M. J., & Loeb, A. 1997, ApJ, 476, 458
- (36) Heger, A. & Woosley, S. E. 2002, ApJ, 567, 532
- (37) Hernandez, X. & Ferrara, A. 2001, MNRAS, 324, 484
- (38) Iwamoto, N., Umeda, H., Tominaga, N., Nomoto, K., & Maeda, K. 2005, Science, 309, 4511
- (39) Karlsson, T. 2006, ApJ, 641, 41
- (40) Kawata, D. & Gibson, B. K. 2003a, MNRAS, 340, 908
- (41) Kawata, D. & Gibson, B. K. 2003b, MNRAS, 346, 135
- (42) Kiyatama, T. & Suto, Y. 1996, ApJ, 469, 480
- (43) Klypin, A. Zhao, H. & Somerville, R. S, 2002, ApJ, 573, 597
- (44) Kravtsov, A. V., Gnedin, Oleg Y., & Klypin, A. A.2004, ApJ, 609, 482
- (45) Machacek, M . E., Bryan, G. L., & Abel, T. 2003, MNRAS, 338, 273
- (46) McWilliam, A., Preston, G. W., Sneden, C., & Searle, L. 1995, AJ, 109, 2757
- (47) Miralda-Escudeé, J. 2000, in The First Stars, MPA/ESO Workshop, ed. A. Weiss, T. G. Abel, V. Hill, Springer, p.327
- (48) Moore, B., Ghigna, F., Governato, F., Lake, G., Stadel, J., & Tozzi, P. 1999, ApJ, 524, L19
- (49) Mori, M., Ferrara, A., & Madau, P. 2002, ApJ, 571, 40
- (50) Nakamura, F., & Umemura, M. 1999, ApJ, 515, 239
- (51) Ober, W. W., El Eid, M. F., & Fricke, K. J. 1983, A&A, 119, 61
- (52) Oey, M. S. 2002, MNRAS, 339, 849
- (53) Oh, S. P. 2001, ApJ, 553, 25
- (54) Oh, S. P., & Haiman, Z. 2002, ApJ, 569, 558
- (55) O’Shea, Abel, T., Whalen, D. & Norman, M. L. 2005, ApJ,628, L5
- (56) Ostriker, J. P., & McKee, C. F. 1988, Rev. Mod. Phys., 60, 1
- (57) Pettini, M. et al. 2003, ApJ, 594, 695
- (58) Piau, L., Beers, T. C., Balasara, D. S., Sivarani, T., Truran, J. W., & Ferguson, J. W.,
- (59) Preston, G. W., Shectman, S. A., & Beers, T. 1991, ApJ 375, 121
- (60) Ripamonti, E., Haardt, F., Ferrara, A., & Colpi, M. 2002, MNRAS, 334, 401
- (61) Ryan, S. G., & Norris, J. E. 1991, AJ, 101, 1865
- (62) Scannapieco, E., Ferrara, A., & Broadhurst, T. 2000, ApJ, 536L,11
- (63) Scannapieco, E. & Broadhurst, T. 2001, ApJ, 550, L39
- (64) Scannapieco, E., Ferrara, A., & Madau P. 2002, ApJ, 574, 590
- (65) Scannapieco, E., Schneider, R., & Ferrara, A. 2003, ApJ, 589, 35 (SSF03)
- (66) Schaye, J. et al. 2003, ApJ, 596, 768
- (67) Schaerer, D. 2002, A&A, 382, 28
- (68) Schneider, R., Ferrara, A., Natarajan, P., & Omukai, K. 2002, ApJ, 571, 30
- (69) Schneider, R., Ferrara, A., Salvaterra, R., Omukai, K., & Bromm, V. 2003, Nature, 422, 869
- (70) Schneider, R., Salvaterra, R., Ferrara, A., & Ciardi, B. 2006, MNRAS, 369, 825
- (71) Searle, L. C. & Sargent, W. L. W. 1972, ApJ, 173, 25
- (72) Spergel, D. N., et al. 2003, ApJS, 14, 175
- (73) Spergel, D. N., et al. 2003, ApJ, submitted (astro-ph/0603449)
- (74) Suda, T., Aikawa, M., Machida, M.N., Fujimoto, M.Y., & Iben, I. Jr. 2004, ApJ, 611, 476
- (75) Susa, H., & Umemura, M. 2006, ApJ, 645, 93
- (76) Tan, J. C., & McKee, C. F. 2004, ApJ, 603, 383
- (77) Tegmark, M., Silk, J., & Evrard, A. 1993, ApJ, 417, 54
- (78) Thacker, R. J., Scannapieco, E., & Davis, M. 2002, ApJ, 574, 590
- (79) Tsujimoto, T., & Shigeyama, T. 2006, ApJL, 638, L109
- (80) Tumlinson, J., Venkatesan, A., & Shull, J. M. 2004, ApJ, 612, 602
- (81) Tumlinson, J. 2006, ApJ, 641, 1
- (82) Umeda, H., & Nomoto, K. 2003, Nature, 619, 427
- (83) Venkatesan, A., Tumlinson, J., & Shull, J. M. 2003, ApJ, 584, 621
- (84) White, S. D. M., & Springel, V. 2000, in The First Stars, MPA/ESO Workshop, ed. A. Weiss, T. G. Abel, V. Hill, Springer, p.327
- (85) Widrow, L.M., & Dubinski, J. 2005, ApJ, 631, 835
- (86) Yoshida, N., Abel, T., Hernquist, L., & Sugiyama, N 2003, ApJ, 593, 645
- (87)