The Position of Sagittarius A*:
III. Motion of the Stellar Cusp
Abstract
In the first two papers of this series, we determined the position of Sgr A* on infrared images, by aligning the positions of red giant stars with positions measured at radio wavelengths for their circumstellar SiO masers. In this paper, we report detections of 5 new stellar SiO masers within 50” (2 pc) of Sgr A* and new and/or improved positions and proper motions of 15 stellar SiO masers. The current accuracies are mas in position and mas y-1 in proper motion. We find that the proper motion of the central stellar cluster with respect to Sgr A* is less than km s-1. One star, IRS 9, has a three-dimensional speed of km s-1 at a projected distance of 0.33 pc from Sgr A*. If IRS 9 is bound to the inner parsec, this requires an enclosed mass that exceeds current estimates of the sum of the mass of Sgr A* and luminous stars in the stellar cusp by M⊙. Possible explanations include i) that IRS 9 is not bound to the central parsec and has “fallen” from a radius greater than 9 pc, ii) that a cluster of dark stellar remnants accounts for some of the excess mass, and/or iii) that R0 is considerably greater than 8 kpc.
1 Introduction
Sagittarius A* (Sgr A*), the compact radio source at the center of the Galaxy (Balick & Brown, 1974), is almost surely a super-massive black hole. Infrared-bright stars orbit about the radio position of Sgr A* and require M⊙ within a radius of AU (Eisenhauer et al., 2005; Ghez et al., 2005). While orbiting stars move at thousands of km s-1, Sgr A* is essentially stationary at the dynamical center of the Galaxy, moving km s-1 out of the Galactic plane, (Backer & Sramek, 1999; Reid, Readhead, Vermeulen & Treuhaft, 1999; Reid & Brunthaler, 2004). This indicates that the radiative source Sgr A*, which is less than 1 AU in size (Rogers et al., 2004; Krichbaum et al., 1998; Doeleman et al., 2001; Bower et al., 2004; Shen et al., 2005), contains a significant fraction () of the gravitational mass (Reid & Brunthaler, 2004).
The Galactic Center stellar cluster contains red giant stars that are both strong radio sources (from circumstellar SiO maser emission) and bright infrared sources. Because these stars are visible at both radio and infrared wavelengths, one can use their radio positions, measured with respect to Sgr A*, to determine accurate scale, rotation, and distortion corrections for an infrared image. This allows the highly accurate radio reference frame to be transfered to the infrared images, improving the quality of the infrared astrometry and precisely locating the position of Sgr A*. In Menten et al. (1997) and Reid et al. (2003), hereafter Papers I & II, we developed this technique and determined the position of Sgr A* on diffraction-limited 2.2 m wavelength images of the Galactic Center with an accuracy of mas. Locating Sgr A* on infrared images has been important for determining its emission in the presence of confusing stellar sources and verifying that foci of stellar orbits coincide with the position of Sgr A*. This links the radiative (compact radio) source with the gravitational source.
We present new VLA observations of stellar SiO masers in the central cluster, updating their positions and, by more than doubling the observing time-span, significantly improving their proper motion determinations. We place the proper motions of infrared stars in the central cluster in a reference frame tied to Sgr A*. In §2 we describe the radio measurements of the positions and proper motions of 15 SiO maser stars, and in §3 we present the latest infrared positions and proper motions of those stars within 20′′ of Sgr A*. We use these data to transfer the infrared proper motions to a reference frame tied to Sgr A* in §4. Finally, in §5, we use the three-dimensional speeds and projected offsets of stars from Sgr A* to constrain the combined mass of Sgr A* and the central (luminous and dark) stellar cluster.
2 Radio Observations
Over the period 1995 to 2006 we have searched for and mapped SiO masers associated with late-type stars that are projected near Sgr A*. We used the NRAO111NRAO is a facility of the National Science Foundation operated under cooperative agreement by Associated Universities, Inc. VLBA and VLA to measure accurately the relative positions of SiO maser stars and Sgr A*.
Red giant and super-giant stars of late-M spectral class often exhibit SiO masers in their extended atmospheres. These masers are strongly variable over time scales of y. SiO maser emission emanates from a typical radius of AU (e.g., Diamond & Kemball (2003)), which corresponds to mas at the assumed 8.0 kpc distance of the Galactic Center (Reid, 1993). As our measurements were made over a time-span much longer than the stellar cycle, we cannot track individual maser features, and we accept an intrinsic stellar position uncertainty of about mas owing to possible variations across the maser shell. For a late-type super-giant, the stellar radius is considerably larger than for a red giant of similar spectral class, and its SiO masers are found at radii roughly an order of magnitude larger. Variation of the SiO masers in a super-giant can considerably degrade inferred stellar position and proper motion measurements (see discussion of IRS 7 in §2.1).
2.1 VLA Observations
Our VLA observations were conducted in the A-configuration in 1995 June (reported in Paper I), 1998 May and 2000 October/November (reported in Paper II) and 2006 March (reported here). Near the Galactic Center, SiO masers are likely detectable over a very wide range of velocities, probably exceeding 700 km s-1. However, wide-band observations at the VLA are currently severely limited by the correlator. In order to obtain adequate spectral resolution and sensitivity, we chose to limit our velocity coverage and observe in seven 6.25 MHz bands (each covering km s-1 excluding band edges). We observed in both right and left circular polarization for each band and obtained 64 spectral channels per band, resulting in uniformly weighted spectral channel spacings of about 98 kHz or 0.67 km s-1.
Our 2006 observations were conducted on March 5, 18, & 19. The VLA had 24 antennas in operation, and the synthesized beam toward Sgr A* was about mas elongated in the north-south direction. Except for occasional calibration sources, we pointed on the position of Sgr A*, allowing detection of masers within the primary beam of a VLA antenna ( HWHM at 43 GHz). We observed by cycling among bands centered at LSR velocities of km s-1; the latter six bands covered the LSR velocity range km s-1 with only two small gaps. This setup allowed for deeper integrations for the previously known, or suspected, SiO maser stars than would be possible for a “wide-open” search.
Initial calibration of the VLA data was done in a standard manner recommended by the Astronomical Image Processing System (AIPS) documentation. The flux density scale was based on observations of 3C 286, assuming 1.49 Jy for interferometer baselines shorter than 300 k. Amplitude and bandpass calibration was accomplished with observations of NRAO 530, which had a flux density of 2.8 Jy during the 2006 observations. The visibility data were then self-calibrated (amplitude and phase) on Sgr A* for each individual 10-sec integration. This removed essentially all interferometer phase fluctuations, owing to propagation through the Earth’s atmosphere, and placed the phase center at the position of Sgr A*.
Sgr A* is known to vary occassionally in flux density by 10% on hourly time scales (Yusef-Zadeh et al., 2006). Were this to happen during our observations, self-calibrating on Sgr A* would introduce false gain (amplitude) variations of a similar magnitude and degrade somewhat the dynamic range of the SiO maser images. However, this is unlikely to shift the measured position of the masers significantly, as the positions are determined almost entirely by the phase data.
We searched for new maser stars by making very large images, covering about ′′, or most of the primary beam of an individual VLA antenna at 43 GHz, about Sgr A*. This was done by limiting the range of uv-data used and resulted in maps with a nearly circular beam of 0.15′′. Typical rms noise levels in these images were near 9 mJy, allowing detections of 54 mJy. Five new SiO maser stars were discovered: SiO-14, SiO-15, SiO-16, SiO-17, and IRS 19NW.
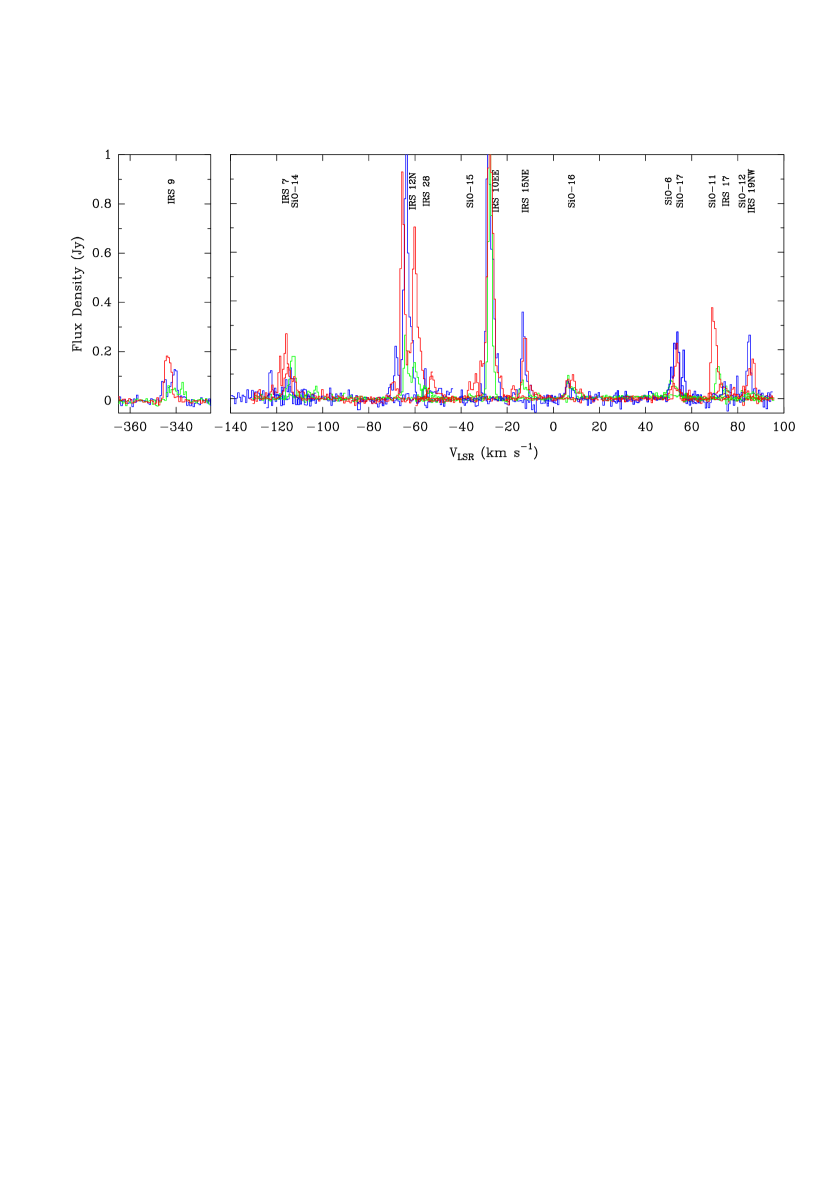
Once the approximate location of a maser was known, either from previous observations or from the large images, we mapped each band with up to five small sub-images centered on known or suspected masers with emission in that band. These synthesized maps typically had single spectral-channel noise levels of about 5 mJy. We always included a sub-image for Sgr A* at the phase center of the interferometric data. By simultaneously imaging the stellar SiO masers and the continuum emission from Sgr A*, the strong continuum emission from Sgr A* did not degrade the detections of relatively weak SiO masers far from Sgr A*. A composite spectrum from all seven observing bands for the 1998, 2000, and 2006 observations is shown in Fig. 1.
As described in Paper II, we obtained a single position for each star at each observing epoch by 1) fitting a 2-dimensional Gaussian brightness distribution to each spectral channel with detectable SiO emission, 2) averaging, using variance weighting, to obtain a best stellar position and estimated uncertainty (if the reduced was greater than unity, we increased the position uncertainties accordingly), and 3) correcting for differential aberration, an effect of mas for stars ′′ of Sgr A*.
We list the positions of the SiO maser stars, relative to Sgr A*, in Table 1. We include the results from the 1995 VLA observations reported in Paper I, the 1998 and 2000 VLA observations reported in Paper II, and the 2006 results reported in this paper. Since stellar SiO masers are variable in strength over the period of the stellar pulsation and the sensitivity of each epoch’s data differed somewhat, only the stronger sources are detected at all epochs.
One of the stars, IRS 7, is a super-giant. As discussed in Paper II, it has SiO maser features spread over km s-1 and is highly variable. We would expect its stronger SiO maser peaks could be spread over a region of at least mas. Thus, the positions determined from the brightest SiO maser feature(s) in IRS 7 may not indicate the stellar position to better than about 5 mas, and we have increased the position uncertainties for IRS 7 in Table 2 to allow for this possibility.
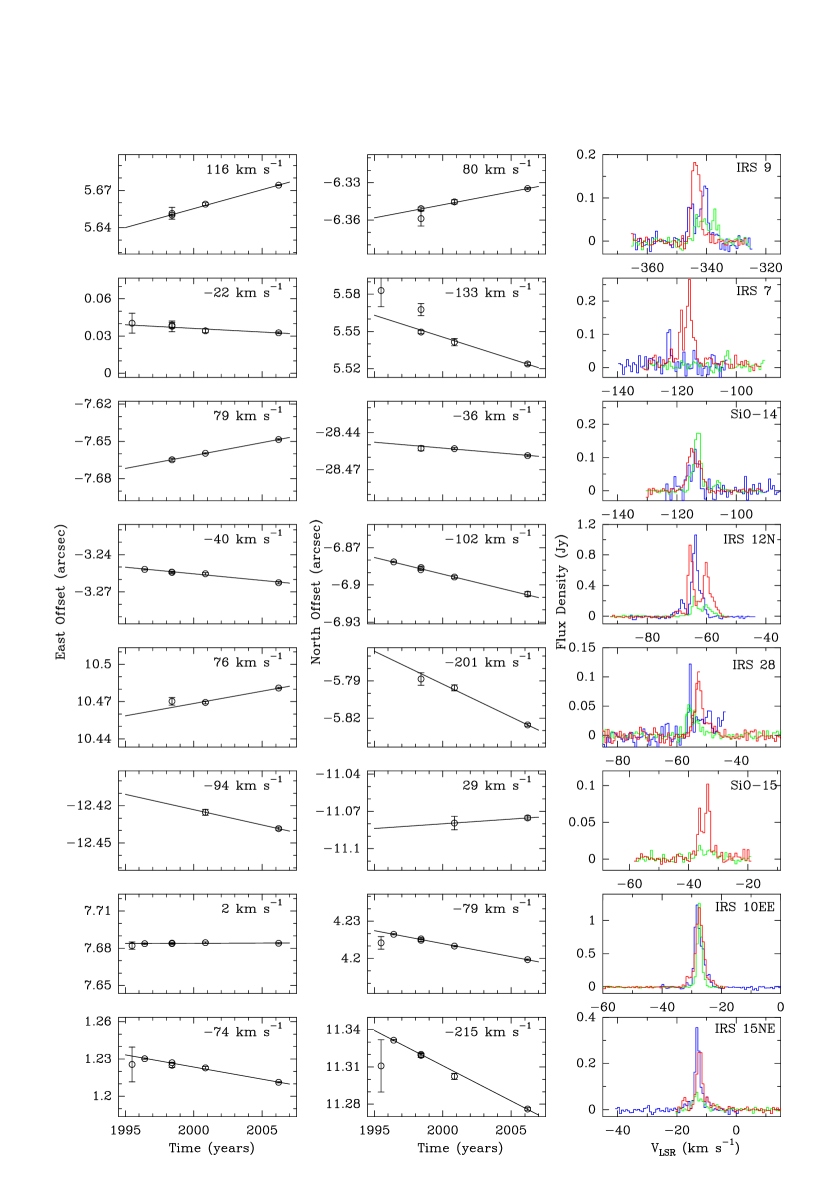
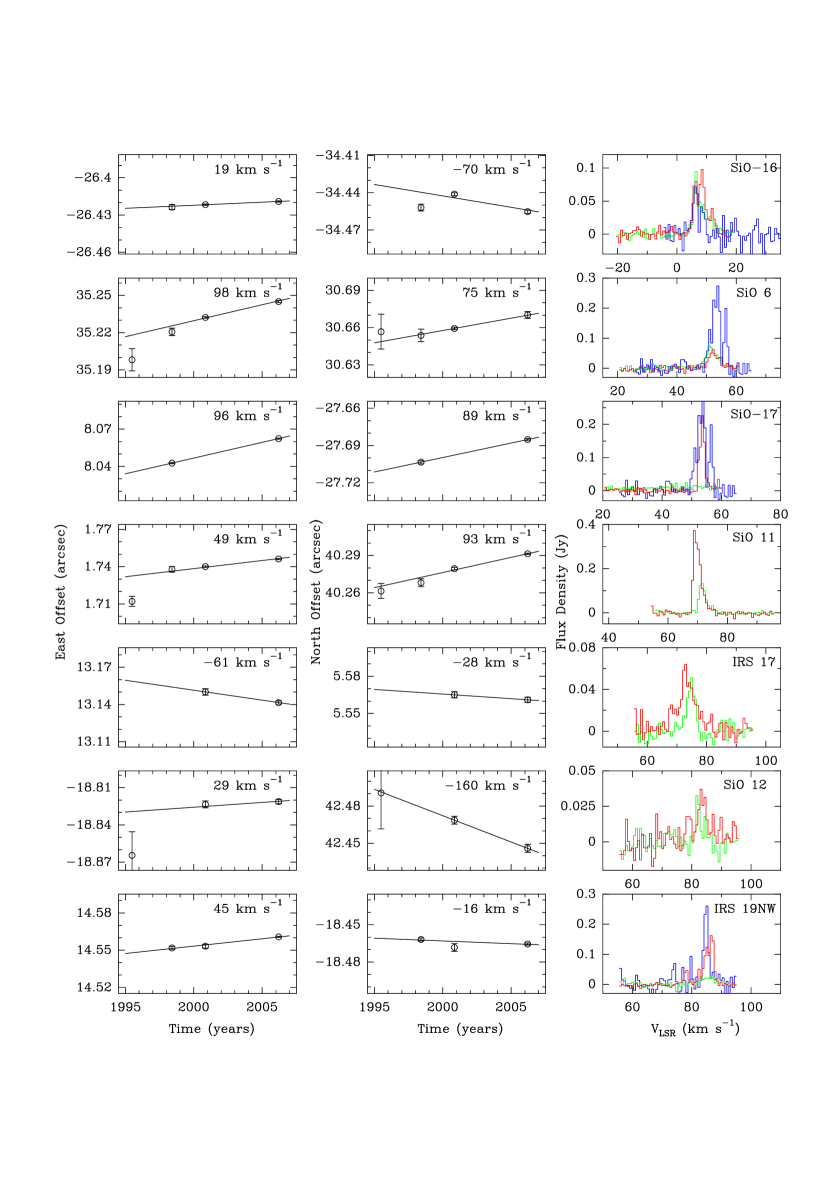
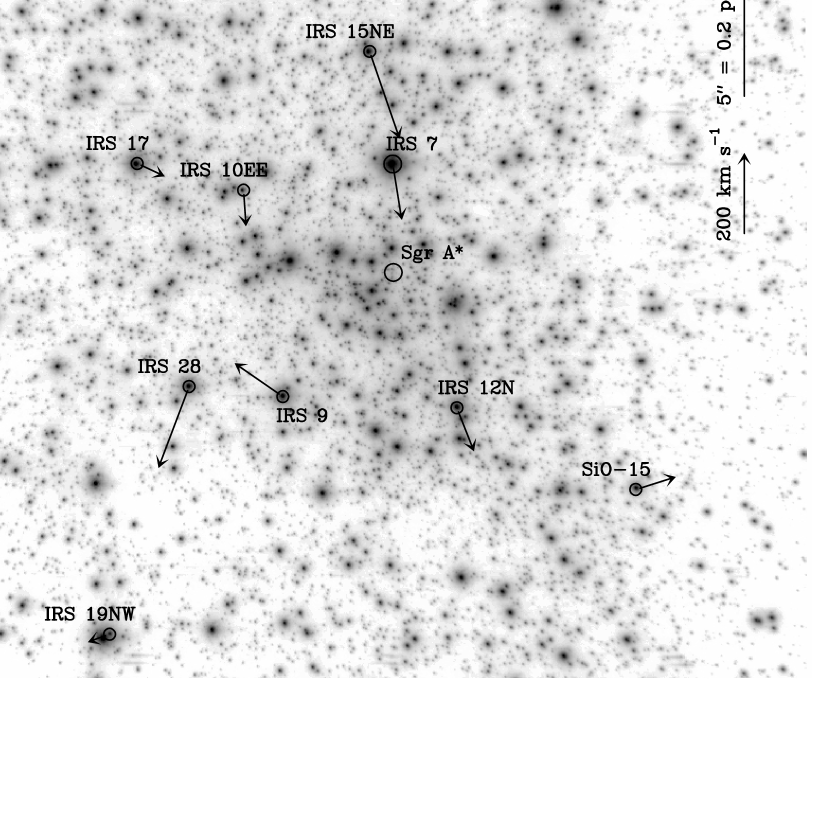
We constructed spectra at the pixel of peak brightness for SiO masers detected in the 1998, 2000, and 2006 VLA observations. These spectra are displayed in Figs. 2 & 3. Most of these SiO spectra are as expected for Mira variables located at the distance of the the Galactic Center: they show flux densities Jy covering a velocity range of km s-1 and strong variability over timescales of years. Fig. 4 shows the Galactic Center region, with the positions and proper motions of the nine SiO maser stars that are projected within the inner 21” displayed.
2.2 SiO Maser Proper Motions
We determined stellar proper motions by fitting a variance-weighted straight line to the positions as a function of time from all of the available data compiled in Table 1. These proper motion fits are given in Table 2 and displayed graphically in Figs. 2 & 3. The reference epoch for the proper motion solution was chosen as the variance-weighted mean epoch for each star, in order to obtain uncorrelated position and motion estimates. Since the estimated uncertainties for individual east-west and north-south positions were neither identical, nor exactly linearly related, we chose a single, average reference epoch for each star (instead of a separate reference epoch for the east-west and north-south directions), which resulted in slight parameter correlations.
Assuming a distance of 8.0 kpc to the Galactic Center (Reid, 1993), we convert proper motions to linear velocities and, with the radial velocities, determine the full 3-dimensional speed, , of each star with respect to Sgr A*. These speeds are given in Table 3. While the speeds on the plane of the sky are directly referenced to Sgr A*, the speeds along our line-of-sight are in the LSR reference frame. Thus, our values of assume that Sgr A* has a near-zero line-of-sight speed with respect to the LSR. As no spectral lines have been detected from Sgr A*, there is no direct observational evidence supporting this assumption. However, the lack of a detectable proper motion of Sgr A* suggests that it anchors the dynamical center of the Galaxy (Reid & Brunthaler, 2004) and should be nearly at rest in the LSR frame.
3 Infrared Observations
Near-IR observations were obtained on the 8.2-m UT4 (Yepun) of the ESO-VLT on Cerro Paranal, Chile, using the detector system NAOS/CONICA (hereafter NACO) consisting of the adaptive optics system NAOS (Rousset et al., 2003) and the -pixel near-IR camera CONICA (Hartung et al., 2003). We obtained 8 data sets in H and K bands with a scale of 27 mas/pixel (large scale) covering 5 epochs (May 2002, May 2003, June 2004, May 2005, April 2006).
Each image covers a field of view (FOV) of arcsec. During each observation the camera pointing was shifted so that the total FOV of a complete data set was between and arcsec, centered on Sgr A*. In all cases the spatial resolution was (nearly) diffraction limited, leading to a typical FWHM of mas. Typical limiting magnitudes were 18th mag at K band and 20th mag at H band. All images were sky-subtracted, bad-pixel removed and flat-field corrected. In order to obtain the best signal-to-noise ratios and maximum FOV coverages in single maps, we combined all good-quality images belonging to the same data set to mosaics after correcting for instrumental geometric distortion. Details of the distortion correction will be given in Trippe et al. (in preparation).
In order to establish an astrometric near-IR reference frame, we selected one high-quality mosaic (May 2005), extracted image positions for all detected stars and transformed them into astrometric coordinates using the positions of all 9 maser stars in the FOV interpolated to the epoch of the image. To compare positions among images of different epochs, we chose an ensemble of “well-behaved” stars (i.e., stars that are well-separated from neighbors and are bright but not saturated) in the “master mosaic” and computed in each image all stellar positions relative to this ensemble. Due to varying FOVs, the number of stars usable for a given mosaic varied between about 400 to 600.
In each image, positions were extracted by fitting stars with 2-dimensional elliptical Gaussian brightness distributions. Although over the entire FOV significant departures from isoplanicity occur, this effect elongates the stellar PSFs symmetrically and does not affect significantly the centroids of Gaussian-fitted positions. Proper motions were computed by fitting the positions versus times with straight lines. To assure statistically “clean” errors for the proper motions, outlier rejection and error rescaling were applied where possible. This led to typical position accuracies of mas and typical proper motion accuracies of mas y-1. Unfortunately, this accuracy was not achieved for all maser stars, as some are very bright stars and are affected by detector non-linearity/saturation in some images; also the star most distant from Sgr A* (IRS19NW) was observed only in the last two epochs. Thus, some of the maser stars have errors larger than typical.
4 Radio & Infrared Frame Alignments
The proper motions of stars in the Galactic Center cluster, measured from infrared images, are relative motions only. One can add an arbitrary constant vector to all of the stellar proper motions without violating observational constraints. Until now, the “zero points” of the motions have been determined by assuming isotropy and removing the average motion of the entire sample. Since the radio proper motions are inherently in a reference frame tied directly to Sgr A*, one can use any one of the SiO stars, or the mean motion of a group of them, to place the infrared proper motions in Sgr A*’s frame.
We have measured radio positions and proper motions, relative to Sgr A*, for the nine bright SiO maser stars that appear on the NACO images (ie, within ′′ of Sgr A*). The position and proper motion accuracies typically are mas and mas y-1, respectively. This allows us to align the radio and infrared frames, both in position and in proper motion. Thus, not only can the location of Sgr A* can be accurately determined on infrared images, but also stellar proper motions from infrared data can be referenced directly to Sgr A*, without assumptions of isotropy or homogeneity of the stellar motions.
The radio and infrared proper motions measured for the nine stars are listed in Table 4. The nine stars have weighted mean differences (and standard errors of the means) of mas y-1 toward the east, and mas y-1 toward the north. These results are qualitatively similar to those published in Paper II. Quantitatively, the differences between the IR motions of Paper II and this paper for some stars (notably IRS 12N) are greater than expected based on the quoted uncertainties. Since the IR motions in Paper II were based on 2 epochs only, which did not allow for an internal check on the formal motion uncertainties, we believe those uncertainties were somewhat optimistic.
Currently only one star, IRS 7, has a significant discrepancy between the radio and infrared motions in the both coordinates. This is the only super-giant star in the sample and, owing to its extreme brightness, the infrared measurements are compromised by detector saturation. Additionally, the radio measurements are subject to significant uncertainty from the large SiO maser shell size. After removing IRS 7, the weighted mean differences between the radio and IR motions change only slightly and become mas y-1 toward the east, and mas y-1 toward the north.
When comparing how well the IR frame matches the radio frame, we need to consider the statistical uncertainty of the average IR motion, which has been removed. For most epochs, the average motion is based on stars, each of which has a typical motion of km s-1. Thus, the mean IR motion should have an uncertainty of roughly km s-1. Adopting the result with IRS 7 removed, converting to linear speeds for a distance of 8.0 kpc to the Galactic Center (Reid, 1993), and adding in quadrature a km s-1 uncertainty for the mean IR motion removed from each coordinate, implies that the infrared stellar cluster moves km s-1 toward the east, and km s-1 toward the north, with respect to Sgr A*. The northward component motion does not deviate significantly from zero; the eastward component formally presents a significance. Combining these components in quadrature formally yields a speed difference of km s-1. However, at this time, we do not consider that we have firmly detected motion of the stellar cluster, and we adopt a upper limit of km s-1 for the proper motion of the stellar cusp with respect to Sgr A*.
5 Enclosed Mass versus Radius from Sgr A*
Estimates of the enclosed mass versus projected radius from Sgr A*, based on infrared stellar motions, rely on relative motions not tied directly to Sgr A*. Since, the 3-dimensional motions of the SiO masers in this paper are both very accurate and directly tied to Sgr A*, they provide valuable information on the enclosed mass within projected radii of 0.2 to 2 pc of Sgr A*.
In Paper II, we derived a lower limit to the enclosed mass at the projected radius of each star, assuming the stellar motions reflect gravitational orbits dominated by a central point mass. Given the 3-dimensional speed, , and projected distance from Sgr A*, , for each star, we obtained a strict lower limit to the mass enclosed, , within the true radius, , of that star from Sgr A*. For a given enclosed mass, semi-major axis and eccentricity (), the greatest orbital speed occurs at pericenter for . Since the projected pericenter distance cannot exceed the true distance, we obtained
Note that this enclosed mass limit is a factor of two lower than would be obtained for a circular orbit. This lower limit approaches an equality only when three criteria are met: 1) , 2) the star is near pericenter, and 3) it has an eccentricity near unity. The a priori chance of any star satisfying all three of these criteria is small, especially since a star in a highly eccentric orbit spends very little time near pericenter. Thus, Eq. (1) provides a very conservative limit on enclosed mass.
We evaluate the lower limit to using Eq. 1 by adopting conservatively the smallest total velocity allowed by measurement uncertainties, i.e., by subtracting from in Table 3 before calculating a mass limit. The mass limits, given in Table 3, are mostly consistent with the enclosed mass versus projected distance from Sgr A* given by Genzel, Eckart, Ott, & Eisenhauer (1997) and Ghez, Klein, Morris & Becklin (1998). For many of the stars, the lower mass limits are well below the estimated enclosed mass curves, as expected given the very conservative nature of the calculated limits.
Our most significant lower mass limit is from IRS 9. In Paper II, we arrived at a limit M⊙, which exceeded the then favored model of a M⊙ black hole (Genzel, Eckart, Ott, & Eisenhauer, 1997; Ghez, Klein, Morris & Becklin, 1998), plus a M⊙ contribution from the central stellar cluster (Genzel et al., 2003), by about 50%. With our improved proper motions, we now find a more stringent limit of M⊙ at a projected radius of 0.33 pc from Sgr A*.
Fig. 5 displays our enclosed mass versus radius constraint based on the 3-dimension motion of IRS 9, along with other constraints in the recent literature. The current best estimate for the mass of the SMBH (Sgr A*) is M⊙, for the distance to the Galactic Center, , of kpc. This mass estimate comes from an unweighted average of the results of Eisenhauer et al. (2005) and Ghez et al. (2005), based on stellar orbit determinations. Adding in a M⊙ contribution from the central stellar cluster, based on a density profile of M⊙ pc-3 by Genzel et al. (2003), yields M⊙, still leaving a discrepancy of M⊙, for kpc. Formally, this is about a discrepancy, assuming an uncertainty of M⊙ in the mass estimate of Sgr A* and an estimated % uncertainty in the mass of the stellar cusp.
Since we do not know the line-of-sight distance of IRS 9 from Sgr A*, one might be tempted to argue that and the star is simply sensing an enclosed mass of M⊙ from the central stellar cluster at that radius. However, the mass limit derived from Eq. (1) scales as and would be approximately M⊙ for pc. Thus, the mass discrepancy only increases for , as shown by the slanted line in Fig. 5 (but see §5.2).
How can the lower limit to the enclosed mass provided by IRS 9 be explained? We now discuss some possibilities.
5.1 Dark Matter in the Central Stellar Cluster
One could explain the motion of IRS 9, were the central stellar cluster to contain dark matter (in addition to Sgr A*) whose mass exceeds M⊙ within pc. Morris (1993) estimates that M⊙ of “dark” stellar remnants (eg, white dwarfs, neutron stars, black holes) could have accumulated in the inner few tenths of a parsec of the Galaxy. Mouawad et al. (2005) show that, with data available at the time, the orbital fit of star S2 allows for (but does not require) M⊙ of dark matter distributed within 0.001 pc of Sgr A*. Should such a dark component exist and extend to greater radii, it might explain some of the IRS 9 mass discrepancy. However, other estimates of the total mass in black holes in the central few tenths of a pc do not exceed M⊙ (Miralda-Escudé & Gould, 2000; Freitag, Amaro-Seoane & Kalogera, 2006). Given these estimates and the evidence from other enclosed mass indicators that do not support M⊙ of dark matter within pc of Sgr A* (Genzel et al., 2000), it seems unlikely that a dark component could explain more than a modest fraction of the IRS 9 mass discrepancy.
5.2 IRS 9 not bound to the central parsec
A critical assumption for calculating the minimum enclosed mass using IRS 9’s space velocity (Eq. 1) is that it is in a bound orbit dominated by a central point mass. If IRS 9 is in a highly eccentric orbit with a semimajor axis greater than a few parsecs, this assumption can break down. In such a case, the star’s space velocity could exceed the “local” escape velocity, based on the mass enclosed at its current radius, but still be bound at a larger radius. For example, a star could be bound by mass within pc of Sgr A*, but observed plunging into the inner few tenths of a parsec at a speed that makes it appear unbound. This could happen via gravitational scattering starting either at small radii and increasing orbital energy or at large radii and removing angular momentum. van Langevelde et al. (1992) suggest a similar explanation for three OH/IR stars with large radial velocities; these stars are seen projected tens of parsecs from Sgr A* and would require semimajor axes of a few kpc.
Consider a Galactic Center star with a large semimajor axis and little angular momentum (), so that it essentially “falls” toward the Center. We derive the infall velocity for a star that starts “falling” at a radius, and reaches a radius of Assume a central point mass, plus an extended component with density, The kinetic energy gained by a star falling from to is equal to the difference in gravitational potential energy at those radii. Gravitational potential energy per unit mass, , for a spherically symmetric mass distribution has the properties that for mass interior to
and for mass exterior to
(For spherically symmetric systems, interior mass acts identically as a point mass equal to the enclosed mass located at the center of the distribution, while exterior mass results in zero gravitational force and a constant gravitational potential dependent on its radial position, but independent of the position of a “test” mass.)
Following Genzel et al. (2003), where M⊙ pc-3, pc, and for pc and for pc. This leads to an enclosed stellar mass within of where M⊙, plus a contribution of from Sgr A*. Adding the contributions to the potential from different mass components for a star at radius (for ) gives
The first three terms on the right hand side of Eq. (2) sum the effects of the mass components interior to , and the fourth term is the contribution from the mass exterior to . Evaluating Eq. (2) we find
For a star “falling” from to , the kinetic energy per unit mass gained is equal to the difference in potential energy per unit mass. From Eq. (3), we find
where
and
Evaluating Eq. (4) for pc, which is a reasonable value for the 3-dimensional radius of IRS 9, gives km s-1 for an initial radius pc. Thus, if IRS 9 is in a highly eccentric orbit that takes it out to a radius of pc, it could achieve its very high observed 3-D velocity without violating the enclosed masses estimated by other methods.
A priori it might seem very unlikely that even one of 15 stars with detectable SiO masers would have such an orbit and be observed near closest approach to Sgr A* (where it spends little time). However, it is beyond the scope of this paper to evaluate the likelihood, especially with the limited statistics available at this time.
5.3 The distance to the Galactic Center () exceeds kpc
Were the mass of Sgr A* M⊙, no mass discrepancy would exist. The best current mass estimates are based on fitting orbits for many stars and should be robust. However, the greatest uncertainty in the mass of Sgr A* comes its strong dependence on the adopted value of kpc for the distance to the Galactic Center. Eisenhauer et al. (2005) derive central masses from orbit fitting of M⊙ when adopting kpc and M⊙ for a best fit kpc. These values suggest an enclosed mass . Our mass limit based on IRS 9’s 3-D motion would also increase with , but more weakly. Since the LSR velocity is the dominant component in the 3-dimensional motion for IRS 9 (and is not dependent on ), our minimum mass estimate (Eq. 1) scales approximately as , mostly through Allowing to increase to about 9 kpc removes the mass discrepancy. However, such a large value for seems very unlikely (Reid, 1993; Eisenhauer et al., 2005).
5.4 Non-zero for Sgr A*
Were Sgr A* moving toward the Sun along the line-of-sight with a speed km s-1, this would lower and, hence, the limit to While it seems very unlikely that a super-massive object would have such a large motion (Reid et al., 2003), we now consider this possibility. One method to approach this problem is to average the velocities of large samples of stars very close to Sgr A*, assuming that this average would apply to Sgr A*.
Our sample of SiO maser stars, which should be nearly complete in the LSR velocity range to km s-1, does not show any obvious bias. Infrared observations of CO band-head velocities from late-type stars in the central parsecs yield average LSR velocities that are not statistically different from zero. For example, the integrated CO-band head velocities (within a 20” diameter aperture) of McGinn et al. (1989) indicate positive (negative) velocities at positive (negative) Galactic longitude, consistent with the direction of Galactic rotation, and a value of km s-1 at the position of Sgr A*. (However, these authors find possibly significant stellar velocities of km s-1 for four pointing offsets perpendicular to the Galactic plane.) Individual stellar velocities compiled by Rieke & Rieke (1988) of 54 stars projected within pc of Sgr A* have a mean velocity of km s-1. Alternatively, Winnberg et al. (1985) and Sjouwerman et al. (1998) measured velocities of OH masers for 33 and 229 OH/IR stars, respectively, within about pc of Sgr A*, which yield average velocities of and km s-1. Overall, it appears that radial velocities of stars near Sgr A* suggest an average LSR velocity near zero, within km s-1.
5.5 IRS 9 is (or was) in a binary
Were IRS 9 in a tight, massive binary, perhaps a significant portion of its space velocity might be contributed by internal orbital motion, possibly reducing its speed with respect to Sgr A*. However, we have observed IRS 9 for about 8 years and see no changes in its radial or proper motion velocity components. The spectra of IRS 9 shown in Fig. 2 are characteristic of Mira variables, which show variable emission over a range of 5 to 10 km s-1 about the stellar velocity. We estimate that the stellar radial velocity of IRS 9 has changed by less than 2 km s-1 over 8 years. Also, the proper motion components are well-fit by constant velocities, with upper limits to accelerations of 0.4 and 0.6 mas y-2 (15 and 23 km s-1 y-1 at 8.0 kpc) for the eastward and northward components, respectively.
The observed changes in radial velocity (or proper motion components) would have different characteristics depending on the relative values of the time span of the observations, , and the orbital period, . For , we would have sampled large changes in the orbital mean anomaly and hence would have seen quasi-random changes of magnitude equal to the orbital speed. Our limit of km s-1 change in the radial velocity over 8 y, would place a limit of km s-1 for the radial component of any orbital velocity. Alternatively, if , then we could be sampling only a small portion of an orbit and detecting a velocity change might be difficult. However, setting y requires y. Since any bright companion for IRS 9 would have been observed, we adopt companion mass of M⊙. This would even allow for most black hole companions. For M⊙ and y, we find an upper limit for an orbital speed of km s-1. Thus, a binary orbital contribution to the observed space velocity of IRS 9 could not exceed km s-1 and likely would be considerably less. Thus, it is highly unlikely that the extreme velocity of IRS 9 could be explained as owing to a binary orbit.
Could IRS 9 have been in a binary system and come unbound (or bound at a much larger radius as discussed in §5.2) after a close encounter with Sgr A*? A small number of “hyper-velocity” stars are thought to have been ejected from the Galactic Center in this manner (Hills, 1988; Yu & Tremaine, 2003; Brown et al., 2005). However, these are estimated to be very rare events ( in y) and we are statistically unlikely to be witnessing a newly created hyper-velocity star so close to Sgr A*. All hyper-velocity stars discovered to date are early-type main-sequence stars; they are found in the outer Galaxy and are moving at speeds of km s-1, even after climbing out of the gravitational potential of the inner Galaxy. Main sequence stars can survive the strong tidal forces experienced during close encounters with Sgr A*. However, IRS 9 is an AGB star and, thus, is a very extended ( solar radii) and low surface-gravity object. It is unclear if such a star could survive the ejection event, without losing its extended atmosphere.
6 Conclusions
We have now measured the radio positions and proper motions of 15 late type stars with SiO maser emission in the Galactic Center stellar cluster. All but two of these stars have been detected at three or more epochs and have measurement accuracies of mas in position and mas y-1 in proper motion. Nine of these stars have multi-epoch measurements of proper motions at infrared wavelengths. A comparison of the radio motions, which are relative to Sgr A*, with the infrared motions indicates that the stellar cusp moves with Sgr A* to within 45 km s-1.
The three-dimensional speeds and projected distances of individual stars from Sgr A* yield lower limits to the enclosed mass. The enclosed mass limit for one star, IRS 9, exceeds current estimates of the combined mass of Sgr A* and the luminous stars in the cusp within the central parsec. This result is puzzling, but might be explained, for example, by a combination of i) a population of dark stellar remnants in the central parsec, ii) IRS 9 being on a plunging “orbit” with a semimajor axis pc, and/or iii) a value of kpc.
References
- Alexander & Loeb (2001) Alexander, T. & Loeb, A. 2001, ApJ, 551, 223
- Backer & Sramek (1999) Backer, D. C. & Sramek, R. A. 1999, ApJ, 524, 805
- Balick & Brown (1974) Balick, B. & Brown, R. L. 1974, ApJ, 194, 265
- Beloborodov et al. (2006) Beloborodov, A. M., Levin, Y., Eisenhauer, F., Genzel, R., Paumard, T., Gillessen, S. & Ott, T. 2006, astro-ph/0601273
- Bower & Backer (1998) Bower, G. C. & Backer, D. C. 1998, ApJ, 496, L97
- Bower et al. (2004) Bower, G. C., Falcke, H., Herrnstein, R. M., Zhao, J.-H., Goss, W. M. & Backer, D. C. 2004, Science, 304, 704
- Brown et al. (2005) Brown, W. R., Geller, M. J., Kenyon, S. J. & Kurtz, M. J. 2005, ApJ, 622, L33
- Chatterjee, Hernquist, & Loeb (2002) Chatterjee, P., Hernquist, L., & Loeb, A. 2002, ApJ, 572, 371
- Diamond & Kemball (2003) Diamond, P. J. & Kemball, A. J. 2003, AJ, 599, 1372
- Doeleman et al. (2001) Doeleman, S. S. et al. 2001, AJ, 121, 2610
- Eckart & Genzel (1996) Eckart, A. & Genzel, R. 1996, Nature, 383, 415
- Eckart & Genzel (1997) Eckart, A. & Genzel, R. 1997, MNRAS, 284, 576
- Eckart, Genzel, Ott, & Schödel (2002) Eckart, A., Genzel, R., Ott, T., & Schödel, R. 2002, MNRAS, 331, 917
- Eisenhauer et al. (2005) Eisenhauer et al.2005, ApJ, 628, 246
- Fomalont et al. (1992) Fomalont, E. B., Goss, W. M., Lyne, A. G., Manchester, R. N., & Justtanont, K. 1992, MNRAS, 258, 497
- Freitag, Amaro-Seoane & Kalogera (2006) Freitag, M., Amaro-Seoane, P. & Kalogera, V. 2006, astro-ph/0603280
- Genzel, Eckart, Ott, & Eisenhauer (1997) Genzel, R., Eckart, A., Ott, T., & Eisenhauer, F. 1997, MNRAS, 291, 219
- Genzel et al. (2000) Genzel, R., Pichon, C., Eckart, A., Gerhard, O. E., & Ott, T. 2000, MNRAS, 317, 348
- Genzel et al. (2003) Genzel, R. et al. 2003, ApJ, 594, 812
- Ghez, Klein, Morris & Becklin (1998) Ghez, A. M., Klein, B. L., Morris, M., & Becklin, E. E. 1998, ApJ, 509, 678
- Ghez et al. (2000) Ghez, A. M., Morris, M., Becklin, E. E., Tanner, A., & Kremenek, T. 2000, Nature, 407, 349
- Ghez et al. (2005) Ghez, A. M. et al. 2005, ApJ, 620, 744
- Hartung et al. (2003) Hartung, M. et al.2003, SPIE, 4841, 425
- Hills (1988) Hills, J. G. 1988, Nature, 331, 687
- Hornstein et al. (2002) Hornstein, S. D., Ghez, A. M., Tanner, A., Morris, M., Becklin, E. E., & Wizinowich, P. 2002, ApJ, 577, L9
- Krichbaum et al. (1998) Krichbaum, T. P. et al.1998, A&A, 335, L106
- Lada & Reid (1978) Lada, C. J. & Reid, M. J. 1978, ApJ, 219, 95
- van Langevelde et al. (1992) van Langevelde, H. J., Brown, A. G. A., Lindqvist, M., Habing, H. J. & de Zeeuw, P. T. 1992, A&AS, 261, L17
- McGinn et al. (1989) McGinn, M. T., Sellgren, K., Becklin, E. E. & Hall, D. N. B. 1989, ApJ, 338, 824
- Menten et al. (1997) Menten, K. M., Reid, M. J., Eckart, A.& Genzel, R. 1997, ApJ, 475, L111 (Paper I)
- Miralda-Escudé & Gould (2000) Miralda-Escudé, J. & Gould, A. 2000, ApJ, 545, 847
- Morris (1993) Morris, M. 1993, ApJ, 408, 496
- Mouawad et al. (2005) Mouawad, N., Eckart, A., Pfalzner, S., Schödel, R., Moultaka, J. & Spurzem, R. 2005, Astronomische Nachrichten, 326 (Issue 2), 83
- Reid (1993) Reid, M. J. 1993, ARA&A, 31, 345
- Reid & Brunthaler (2004) Reid, M. J. & Brunthaler, A. 2004, ApJ, 616, 872
- Reid & Menten (1997) Reid, M. J. & Menten, K. M. 1997, ApJ, 476, 327
- Reid et al. (2003) Reid, M. J. Menten, K. M., Genzel, R. Ott, T. & Schödel, R., 2003, ApJ, 587, 208 (Paper II)
- Reid, Readhead, Vermeulen & Treuhaft (1999) Reid, M. J., Readhead, A. C. S., Vermeulen, R. C. & Treuhaft, R. N. 1999, ApJ, 524, 816
- Rieke & Rieke (1988) Rieke, G. H. & Rieke, M. J. 1988, ApJ, 330, L33
- Rogers et al. (2004) Rogers, A. E. E. et al. 2004, ApJ, 434, L59
- Rousset et al. (2003) Rousset, G. et al.2003, SPIE, 4839, 140
- Schödel et al. (2002) Schödel, R. et al. 2002, Nature, 419, 694
- Shen et al. (2005) Shen, Z.–Q., Lo, K. Y., Liang, M.–C., Ho, P. T. P. & Zhao, J.–H. 2005, Nature, 438, 62
- Sjouwerman et al. (1998) Sjouwerman, L. O., van Langevelde, H. J., Winnberg, A., & Habing, H. J. 1998, A&AS, 128, 35
- Trippe et al. (in preparation) Trippe, S. et al. in preparation
- Wardle & Yusef-Zadeh (1992) Wardle, M. & Yusef-Zadeh, F. 1992, ApJ, 387, L65
- Winnberg et al. (1985) Winnberg, A, Baud, B., Matthews, H. E., Habing, H. J & Olnon, F. M. 1985, ApJ, 291, L45
- Yu & Tremaine (2003) Yu, Q. & Tremaine, S. 2003, ApJ, 599, 1129
- Yusef-Zadeh et al. (2006) Yusef-Zadeh, F., Roberts, D., Wardle, M., Heinke, C. O. & Bower, G. C. 2006, ApJ, 650, 189.

| Star | Epoch | Telescope | |||
|---|---|---|---|---|---|
| ( km s-1) | (arcsec) | (arcsec) | (y) | ||
| IRS 9 ….. | 1998.39 | VLA | |||
| 1998.41 | VLA | ||||
| 2000.85 | VLA | ||||
| 2006.20 | VLA | ||||
| IRS 7 ….. | 1995.49 | VLA | |||
| 1998.39 | VLA | ||||
| 1998.41 | VLA | ||||
| 2000.85 | VLA | ||||
| 2006.20 | VLA | ||||
| SiO-14 ….. | 1998.41 | VLA | |||
| 2000.85 | VLA | ||||
| 2006.20 | VLA | ||||
| IRS 12N …. | 1996.41 | VLBA | |||
| 1998.39 | VLA | ||||
| 1998.41 | VLA | ||||
| 2000.85 | VLA | ||||
| 2006.20 | VLA | ||||
| IRS 28 ….. | 1998.41 | VLA | |||
| 2000.85 | VLA | ||||
| 2006.20 | VLA | ||||
| SiO-15 ….. | 2000.85 | VLA | |||
| 2006.20 | VLA | ||||
| IRS 10EE … | 1995.49 | VLA | |||
| 1996.41 | VLBA | ||||
| 1998.39 | VLA | ||||
| 1998.41 | VLA | ||||
| 2000.85 | VLA | ||||
| 2006.20 | VLA | ||||
| IRS 15NE … | 1995.49 | VLA | |||
| 1996.41 | VLBA | ||||
| 1998.39 | VLA | ||||
| 1998.41 | VLA | ||||
| 2000.85 | VLA | ||||
| 2006.20 | VLA | ||||
| SiO-16 ….. | 1998.41 | VLA | |||
| 2000.85 | VLA | ||||
| 2006.20 | VLA | ||||
| SiO–6 ….. | 1995.49 | VLA | |||
| 1998.39 | VLA | ||||
| 2000.85 | VLA | ||||
| 2006.20 | VLA | ||||
| SiO-17 ….. | 1998.41 | VLA | |||
| 2006.20 | VLA | ||||
| SiO–11 …. | 1995.49 | VLA | |||
| 1998.39 | VLA | ||||
| 2000.85 | VLA | ||||
| 2006.20 | VLA | ||||
| IRS 17 ….. | 2000.85 | VLA | |||
| 2006.20 | VLA | ||||
| SiO–12 …. | 1995.49 | VLA | |||
| 2000.85 | VLA | ||||
| 2006.20 | VLA | ||||
| IRS 19NW ….. | 1998.41 | VLA | |||
| 2000.85 | VLA | ||||
| 2006.20 | VLA |
Note. — VLBA positions are reported at a single reference epoch. VLA data have been corrected for differential aberration. and are angular offsets, and and are proper motions, relative to Sgr A* toward the east and north, respectively, in the J2000 coordinate system.
| Star | Epoch | Number | |||||
|---|---|---|---|---|---|---|---|
| ( km s-1) | (arcsec) | (arcsec) | (mas y-1) | (mas y-1) | (y) | Epochs | |
| IRS 9 ….. | 2003.34 | 3 | |||||
| IRS 7 ….. | 2004.37 | 4 | |||||
| SiO-14 …. | 2002.89 | 3 | |||||
| IRS 12N …. | 1998.17 | 4 | |||||
| IRS 28 ….. | 2005.00 | 3 | |||||
| SiO-15 ….. | 2005.68 | 2 | |||||
| IRS 10EE … | 2000.24 | 5 | |||||
| IRS 15NE … | 1998.92 | 5 | |||||
| SiO-16 ….. | 2002.82 | 3 | |||||
| SiO–6 ….. | 2001.43 | 4 | |||||
| SiO-17 ….. | 2003.68 | 2 | |||||
| SiO–11 …. | 2004.38 | 4 | |||||
| IRS 17 ….. | 2004.49 | 2 | |||||
| SiO–12 …. | 2003.83 | 3 | |||||
| IRS 19NW .. | 2003.79 | 3 |
Note. — For sources with VLBA detections, only a single position was used when fitting for proper motions. VLA data have been corrected for differential aberration. and are angular offsets at the listed epoch, and and are proper motions, relative to Sgr A* toward the east and north, respectively, in the J2000 coordinate system. IRS 7 was shifted by +0.010” northward to “center the star” between two maser positions; its position and proper motion uncertainties were increased to 0.005” and 0.5 mas y-1. Formal proper motion uncertainties were doubled for the stars with only 2-epoch motions.
| Star | Rproj | Mencl | |||||||
|---|---|---|---|---|---|---|---|---|---|
| ( km s-1) | ( km s-1) | ( km s-1) | ( km s-1) | (pc) | ( M⊙) | ||||
| IRS 9 … | |||||||||
| IRS 7 … | |||||||||
| SiO-14 … | |||||||||
| IRS 12N … | |||||||||
| IRS 28 … | |||||||||
| SiO-15 … | |||||||||
| IRS 10EE … | |||||||||
| IRS 15NE … | |||||||||
| SiO-16 … | |||||||||
| SiO–6 … | |||||||||
| SiO-17 … | |||||||||
| SiO–11 … | |||||||||
| IRS 17 … | |||||||||
| SiO–12 … | |||||||||
| IRS 19NW … |
Note. — and are proper motions speeds toward the East and North, respectively. is the total speed of the stars relative to Sgr A*. Proper motion speeds, projected distances, total speeds and enclosed mass limits assume a distance to the Galactic Center of 8.0 kpc.
| Star | ||||||||
|---|---|---|---|---|---|---|---|---|
| (mas y-1) | (mas y-1) | (mas y-1) | (mas y-1) | (mas y-1) | (mas y-1) | |||
| IRS9 … | ||||||||
| IRS7 … | ||||||||
| IRS12N … | ||||||||
| IRS28 … | ||||||||
| SiO-15 … | ||||||||
| IRS10EE … | ||||||||
| IRS15NE … | ||||||||
| IRS17 … | ||||||||
| IRS19NW … |
Note. — and are proper motions relative to Sgr A* toward the east and north, respectively. Differenced motions (infrared minus radio) are indicated with the superscript “Dif”. Radio motions are in a reference frame tied to Sgr A*; infrared motions are relative motions, with an average of star motions removed.