The discovery of the first luminous quasar in the UKIDSS Large Area Survey
Abstract
We present the initial results from our search for high redshift, , quasars using near infrared data from the UKIRT Infrared Deep Sky Survey (UKIDSS) Large Area Survey (LAS). Our analysis of 106 deg2 of sky from Data Release 1 (DR1) has resulted in the discovery of ULAS J020332.38+001229.2, a luminous (, , ) quasar at . Following candidate selection from the combined IR and optical catalogue data and stacking of multiple epoch Sloan Digital Sky Survey (SDSS) data, we have obtained optical spectroscopy for the only two quasar candidates. The VLT FORS2 spectrum of ULAS J020332.38+001229.2 shows broad Ly + N V 1240 emission at 8350 Å and an abrupt continuum break due to absorption by the Ly forest. The quasar is not present in the SDSS DR5 catalogue and the continuum spectral index of =-1.4 () is redder than a composite of SDSS quasars at similar redshifts (=-0.5). The discovery of one quasar in 100 deg2 in a complete sample within our selection criteria down to a median depth of (7) is consistent with existing SDSS results. We describe our survey methodology, including the use of optical data from the SDSS and the highly effective procedures developed to isolate the very small surface density of high-probability quasar candidates.
keywords:
cosmology: observations, galaxies: quasars: general, galaxies: quasars: individual: ULAS J020332.38+001229.21 Introduction
Quasars are powerful probes of the high-redshift Universe since, by virtue of their high luminosities, they can be observed out to immense distances with large look back times. The host galaxies of the highest redshift quasars are probably still forming and most likely occur in overdense regions in the matter distribution of the early Universe. Studies of their space densities, host galaxies and local environments provide potentially powerful constraints on theories of the formation and growth of supermassive black holes, the growth of large scale structure and the formation and evolution of the first galaxies (e.g. Kauffmann & Haehnelt 2000).
In addition to being of intrinsic interest, bright high-redshift quasars are particularly valuable as probes of the Universe via absorption studies of cosmologically distributed intervening material and can be used to determine the baryonic content and physical conditions (metallicity, temperature, ionization state) of the intergalactic medium (IGM) and gas within intervening galaxies.
Finding quasars above redshift is of crucial importance since it is in the epoch of reionization between the redshift where the Strömgren spheres of the reionization sources overlap (, Gnedin & Fan 2006), as shown by the observations of the Gunn-Peterson optical depth at , and the lower bound (1) to the epoch of reionization from the 3-year WMAP polarization results at (Page et al. 2006) which corresponds roughly to the epoch when the Universe was half-ionized (by volume).
Over the last few years there has been considerable progress in wide area searches for high-redshift quasars. Storrie-Lombardi et al. (2001) reported the final results of a large survey for quasars over 8000 deg2 which resulted in 50 quasars in the redshift range . This survey used photographic data and was based on the drop across Ly caused by the Ly forest, depressing the observed flux in the -band relative to the -band. The advent of the CCD-based Sloan Digital Sky Survey (SDSS, York et al. 2000) extended wide-area surveys to longer wavelengths with the inclusion of the - and -bands, enabling searches for quasars based on colour and redshifts of were reached (Fan et al. 2000). There are now around 20 quasars known, with the highest redshift quasar at (Fan et al. 2003, 2006).
However, finding quasars beyond using the SDSS is practically almost impossible because the sources become too faint in the reddest passband (the -band) due to absorption by the intervening Ly forest. To reach higher redshift requires wide-field near-infrared imaging to substantially fainter fluxes then the 2 Micron All Sky Survey (2MASS, Skrutskie et al. 2006). This is the parameter space explored by the UK Infrared Telescope (UKIRT) Infrared Deep Sky Survey (UKIDSS) Large Area Survey (LAS). One of the main science drivers of the UKIDSS LAS is the discovery of quasars with .
In this Letter, we report the first high-redshift quasar discovered with UKIDSS, ULAS J020332.38+001229.2 at . All magnitudes are given in the AB system using the Vega to AB conversions provided in Hewett et al. (2006) and a -dominated cosmology with H km s-1 Mpc-1, , and is adopted.
2 Survey imaging data
The near infrared data are from the UKIDSS LAS (Lawrence et al. 2006) which is being carried out using the UKIRT Wide Field Camera (WFCAM, Casali et al. 2006) on the 3.8-m UKIRT. WFCAM has a sparse packed mosaic of four 20482048 pixel Rockwell Hawaii-II arrays with a pixel scale of 04 pixel-1. The instantaneous field of view is 0.21 deg2. The arrays are spaced by 0.94 times the detector width. A mosaic of four pointings gives a tile with a continuous covered area of 0.77 deg2. See Dye et al. (2006) for technical details of UKIDSS.
The LAS consists of nominal 40-s exposures in the -, -, - and -bands. The -band (0.97–1.07 m) is specially designed to fall between the -band and the -band, occupying the clean wavelength range between the atmospheric absorption bands at 0.95 m and 1.14 m. The -band is needed to distinguish high-redshift quasars from the more numerous cool stars, such as L- and T-dwarfs (Hewett et al. 2006, see also Fig. 1).
In this Letter, we use data from the Data Release 1 (DR1, Warren et al. 2006). The UKIDSS observations were obtained during the period 2005 August to 2006 January. The data was released to the ESO community in 2006 July (see Warren et al. 2006 for further details). The median 5 point source depths in AB magnitudes are =20.8, =20.5, =20.2 and =20.1 (Warren et al. 2006). We have restricted our analysis to the UKIDSS LAS area that is imaged at multiple epochs by the SDSS Southern Survey (, called Stripe 82 in the SDSS footprint, York et al. 2000). This region of sky is being imaged by the SDSS collaboration in 5 passbands (, , , , ) repeatedly during three months (September, October and November) in each of three years (2005-2007) as part of the SDSS-II project. In addition Stripe 82 was imaged 10-20 times during the SDSS-I project (see Adelman-McCarthy et al. 2006). The SDSS data is released as DRSN1 (Sako et al. 2005) and DRsup (Adelman-McCarthy et al. 2006). The area covered by the LAS in both - and -bands in the SDSS Southern Survey area is 106 deg2. In this area 950 000 objects are detected in both and with a signal-to-noise ratio in .
We matched the UKIDSS DR1 data with the catalogues from the SDSS DR5, using a search radius of 2 arcsec. The colours of objects are computed using the SDSS PSF magnitudes and the UKIDSS magnitudes which are computed using a diameter of 2 arcsec, corrected for apertures losses on a pointing by pointing basis.
3 Quasar selection
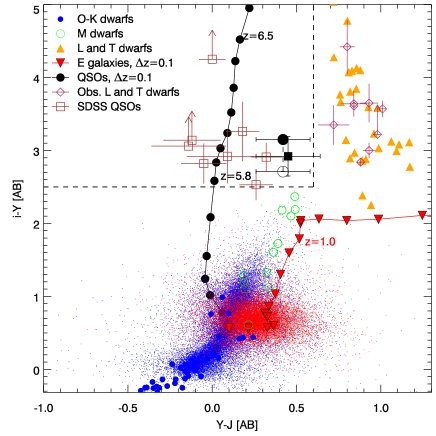
Candidate high-redshift () quasars down to a signal-to-noise ratio of 7 in , corresponding to a median depth of , were selected on the basis of their blue UKIDSS colour and, either, (i) red colours from our combined UKIDSS-SDSS catalogue, or, (ii) absence in the SDSS - and/or -band catalogue. The colour-colour diagram shown in Fig. 1 demonstrates the principles behind our selection criteria. The colour cuts used were and . The cut is used to avoid the L and T dwarfs. The cut selects quasars above and discriminates against foreground Galactic stars.
An additional requirement for candidate quasars was that they should be undetected in the SDSS -, - and -bands. We regarded an object as undetected in SDSS, if the SDSS PSF-magnitude was fainter than the 3 limiting magnitude of the SDSS pixel () field in which the object was found. We made an empirical determination of the 3 magnitude limit for each SDSS field from the SDSS catalogue. If an object was detected in the -band, we also required that following the criterion used by Fan et al. (2003).
We performed various steps to remove false positives from our candidate quasar sample. These steps included:
-
1.
Removal of intra-quadrant cross-talk images. Cross-talk images are artifacts caused by bright stars (see Dye et al. 2006 for a detailed description). The cross-talk images appear offset from the bright star by multiples of 51.2 arcsec (or 128 pixels with scale 04) corresponding to a single read out channel on the same quadrant. More than 99 per cent of the -dropouts are cross-talk images. We used the 2MASS catalog to locate all stars in the surveyed area down to . We then used the positions of these stars to remove all candidates that were located within a radius of 5 arcsec of multiples of 51.2 arcsec in the North/South or East/West direction as appropriate for the quadrant (see Dye et al. 2006) out to 6 arcmin on the -band images from the 2MASS stars.
-
2.
Independent repeat photometry on the SDSS images using the pixel data of the SDSS to measure the photometry of candidate quasars in the -, - and -bands. This removed objects that do not appear in the SDSS catalogues but are present on the images, such as in the case where objects lie near perturbing brighter objects and the edges of the SDSS data. This photometric analysis also provided upper limits.
-
3.
Co-adding of up to seven epochs of SDSS data from DRsup and DRSN1 taken in photometric conditions to detect objects that lie below the SDSS single-epoch catalogue limits in the optical - and -bands. The co-added images were obtained by averaging multiple single-epoch SDSS images centered on the location of the UKIDSS object, scaled to a common zeropoint using the DR5 catalogue.
-
4.
Screening by eye to identify spurious candidates which had not been removed at any earlier stage (e.g. moving objects such as asteroids and corrupted objects near perturbing bright objects). UKIDSS observations in each waveband are not simultaneous and the time interval between consecutive observations in different wavebands is generally in the range 30 to 120 mins. Asteroids could be recognized as they move between the observations in the different UKIDSS bands. An object that appears on more than one band and shifts by arcsec hr-1 could be identified as moving, down to the flux limit we considered.
These steps reduced the number of candidates from 5000, the majority of which were cross-talk artifacts, down to 10, the follow-up observations of which are described next.
4 Candidate follow-up observations
| Band | Source | mag [AB] | Date |
|---|---|---|---|
| SDSS DR5 | 2002-09-05 | ||
| Co-add (DRSN1, DRsup) | 23.70.2 | 2002–2005 | |
| SDSS DR5 | 21.20.3 | 2002-09-05 | |
| Co-add (DRSN1, DRsup) | 20.90.1 | 2002–2005 | |
| NTT/EMMI | 20.690.06 | 2006-07-18 | |
| UKIDSS | 20.400.12 | 2005-11-26 | |
| UKIDSS | 19.980.10 | 2005-11-26 | |
| UKIDSS | 19.210.08 | 2005-12-09 |
4.1 ESO NTT imaging observations
Candidates were observed with filter in the ESO Multi-Mode Instrument (EMMI, Dekker, Delabre & Dodorico 1986), at the 3.6-m New Technology Telescope (NTT)111Based on observations made with ESO Telescopes at the La Silla Observatory under programme ID 077.A-0807, for 900 s on the night beginning 2006 August 18. The filter/detector combination is referred to here as and is similar to the SDSS -band. Using the measured CCD sensitivity curve, and the filter transmission curve, we followed the procedure used by Hewett et al. (2006) to establish the colour relation (in AB magnitudes), for dwarf stars, O to M. Photometry in and of SDSS DR5 sources in the field was converted to , and the brightness of the source was measured via relative photometry using a fixed aperture size. For a typical quasar at the difference between and is at most 0.05 mag.
With the -band photometry eight of the 10 observed objects were too blue in and too red in to be considered as likely quasars (see Table A.1 for the names of these rejected candidates). Such objects appear to be the main contaminant in our search. Due to photometric errors, the -band magnitudes are scattered to a brighter value, making the objects appear redder than and blue in .
The two remaining candidates, where the magnitude confirmed the co-added SDSS -band magnitude, were selected for spectroscopic follow-up.
4.2 ESO VLT spectroscopic observations
Spectra of the two candidates were obtained on 2006 September 1 and 2 using the FOcal Reducer/ low dispersion Spectrograph 2 (FORS2, Appenzeller et al. 1998) on the 8.2-m Very Large Telescope (VLT) Antu222Based on observations made with ESO Telescopes at the Paranal Observatory under programme ID 077.A-0310. The candidates were observed through the 600z holographic grism with a 10 wide long slit. Individual exposures were 600 s duration. The pixels were 22 binned to decrease the readout time and noise, giving a spatial scale 025 pixel-1 and a dispersion of 1.62 Å pixel-1. The nights were photometric with seeing around 05. For the wavelength calibration, exposures of He, HgCd and Ne arc lamps were obtained. The rms of the wavelength calibration was better than 0.2 Å. The spectra cover the wavelength range 7370–10200. The spectrophotometric standard star GD50 (Oke 1990) was observed with a 5 arcsec slit for relative flux calibration, and the absolute calibration was determined using the observed -band flux. Total exposure times were 1200 s for ULAS J020332.38+001229.2 (hereafter ULAS J0203+0012) and 2400 s for ULAS J022905.11+005506.5.
5 Results
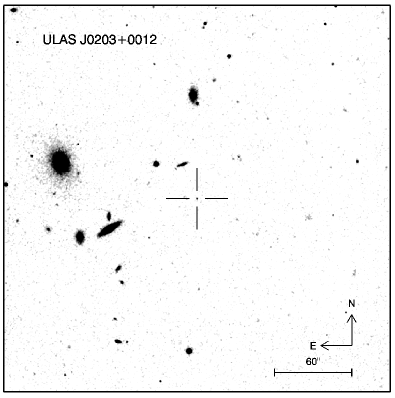
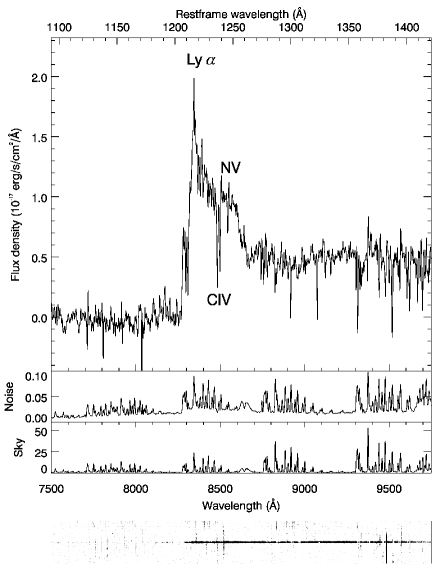
Fig. 2 shows the spectrum of ULAS J0203+0012. The spectrum is characterized by a broad, asymmetric emission line and a continuum break around 8350 Å. We interpret these features as the Ly emission line and the continuum break resulting from Ly forest absorption at a redshift of . The N V 1240 emission line is blended with the Ly line. The C IV 1549 emission line would lie at 10630 Å, outside the wavelength range of the spectrum. We determined the redshift of the quasar by fitting a Gaussian to the red part of the Ly line. This gives a redshift of 5.8640.003. The peak of the emission is at 8342 Å giving a redshift of . The rest-frame equivalent width of the Ly + N V emission line is 64 Å (uncorrected for Ly forest absorption), which is comparable to other quasars (e.g. Fan et al. 2004). A finding chart of the quasar is shown in Fig. 3 and the magnitudes are given in Table 1. It should be stressed that ULAS J0203+0012 is too faint in the optical passbands to be present in the SDSS DR5 catalogue. The 3 -band magnitude listed in Table 1 is derived using aperture photometry on the SDSS pixel image at the location of the UKIDSS source.
The second candidate, ULAS J022905.12+005506.5, turned out to be a star, probably an M dwarf.
6 Discussion
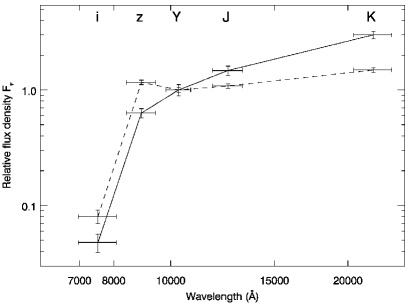
In Fig. 4 we compare the optical and infrared magnitudes of ULAS J0203+0012 with a composite of three SDSS quasars which were observed during the science verification of WFCAM. Both spectral energy distributions (SEDs) are scaled to at the centre of the -band at 10305 Å. ULAS J0203+0012 is significantly redder in the infrared than the SDSS quasar composite. If we approximate the SEDs in the infrared by a power law with slope () then the slopes for ULAS J0203+0012 are between the and and between and . The SDSS quasars have average slopes of and between and and and respectively. This is consistent with the average slope of that was found for a sample of 45 SDSS quasars with by Pentericci et al. (2003).
ULAS J0203+0012 is significantly fainter than the SDSS quasars. The absolute magnitude at 1450 Å in the rest-frame is , nearly a magnitude fainter than that of the SDSS composite (). However, because ULAS J0203+0012 is redder, the extrapolated absolute -band magnitude is similar to that of the SDSS composite, and respectively.
7 Conclusions
We have reported initial results of a survey program using UKIDSS LAS data to discover high-redshift quasars. Our results from 106 deg2 demonstrate that the federated UKIDSS and SDSS data can be used to carry out such a survey. The analysis and follow-up strategy we have described is relatively efficient and should be applicable to the entire UKIDSS LAS survey area of 4000 deg2.
Follow-up observations of the UKIDSS DR1 quasar candidates in the SDSS Stripe 82 region are now complete. It is difficult to draw any strong conclusions regarding the space density of quasars from one object but we can estimate the number of quasars we would expect in the UKIDSS survey by extrapolating the luminosity function of Fan et al. (2004) to fainter magnitudes. The density of high-redshift quasars as found in the SDSS is Mpc-3 (Fan et al. 2004) at a redshift of . We assume that the comoving density of quasars evolves with redshift as log() (Schmidt, Schneider & Gunn 1995).
Number density predictions are calculated for the -band, corresponding to a rest-frame wavelength of 1450 Å at , for which no correction for the presence of Ly emission or the Ly forest is required. Integrating down to (the median limit of the DR1 data) we expect one quasar in 130 deg2 in the redshift range . This is consistent with the one object, ULAS J0203+0012, that was found in 106 deg2. We can estimate in the same way the surface density of quasars in the LAS and we find one object per 390 deg2 down to . The UKIDSS LAS two-year plan (Dye et al. 2006) will cover around deg2. We expect this area to contain new quasars (excluding six quasars already discovered by SDSS), of which about six would be at .
Above a redshift of the Ly line shifts out of the -band. Potentially quasars above this redshift could be discovered as -band dropout objects. However, the predicted number density for such quasars is very low ( quasar in 2100 deg2).
Acknowledgments
We acknowledge the contributions of the staff of UKIRT, in particular Andy Adamson, to the implementation UKIDSS survey and the Cambridge Astronomical Survey Unit and the Wide Field Astronomy Unit in Edinburgh for processing the UKIDSS data. We thank G. Miley and F. Maschietto for their help in obtaining the VLT spectra, and the referee M. Strauss for his valuable comments. This work is based in part on data obtained as part of the UKIRT Infrared Deep Sky Survey. The United Kingdom Infrared Telescope is operated by the Joint Astronomy Centre on behalf of the U.K. Particle Physics and Astronomy Research Council.
References
- (1) Adelman-McCarthy J. K. et al., 2006, submitted to ApJS
- Appenzeller et al. (1998) Appenzeller I. et al. 1998, The Messenger, 94, 1
- (3) Casali M. et al., 2006, A&A in press
- (4) Dekker H., Delabre B., Dodorico S., 1986, SPIE, 627, 339
- Dye et al. (2006) Dye S. et al. 2006, MNRAS, 372, 1227
- (6) Fan X. et al., 2000, AJ, 120, 1167
- (7) Fan X. et al., 2003, AJ, 125, 1649
- (8) Fan X. et al., 2004, AJ, 128, 515
- (9) Fan X. et al., 2006, AJ, 132, 117
- Gnedin & Fan (2006) Gnedin N. Y., Fan X., 2006, ApJ, 648, 1
- (11) Hewett P. C., Warren S. J., Leggett S. K., Hodgkin S. T., 2006, MNRAS, 367, 454
- Kauffmann & Haehnelt (2000) Kauffmann G., Haehnelt M., 2000, MNRAS, 311, 576
- Lawrence et al. (2006) Lawrence A. et al., 2006, submitted to MNRAS (astro-ph/0604426)
- Oke (1990) Oke J. B., 1990, AJ, 99, 1621
- Page et al. (2006) Page L. et al., 2006, submitted to ApJ (astro-ph/0603450)
- (16) Pentericci L. et al., 2003, A&A, 410, 75
- Sako et al. (2005) Sako M. et al. 2005, astro-ph/0504455
- Schmidt et al. (1995) Schmidt M., Schneider D., Gunn J., 1995, AJ, 110, 68
- Skrutskie et al. (2006) Skrutskie M. F. et al., 2006, AJ, 131, 1163
- (20) Storrie-Lombardi L. J., Irwin M. J., McMahon R. G., Hook I. M., 2001, MNRAS, 322, 933
- Warren et al. (2006) Warren S. J. et al., 2006, MNRAS in press (astro-ph/0610191)
- York et al. (2000) York D. G. et al., 2000, AJ, 120, 1579
Appendix A
| UKIDSS name |
|---|
| ULAS J030352.55+003334.1 |
| ULAS J003852.24005324.0 |
| ULAS J022119.09010905.9 |
| ULAS J223845.14+011132.8 |
| ULAS J021753.93+003906.9 |
| ULAS J223457.11+005136.6 |
| ULAS J011650.20+011532.2 |
| ULAS J021047.00001419.6 |